Pleasure Ridge Park, KY (Kentucky) Houses and Residents
| Pleasure Ridge Park: | $215,911 |
| Kentucky: | $196,300 |
Total population: 26,433 (Urban population: 25,978, Rural population: 0)
Houses: 10,690 (10,312 occupied: 8,133 owner occupied, 2,179 renter occupied)
| % of renters here: | 21% |
| State: | 31% |
Housing density: 1,284 houses/condos per square mile
Median price asked for vacant for-sale houses and condos in 2022 in this county: $108,908.
Median contract rent in 2022: $822 (lower quartile is $670, upper quartile is $1,045)
Median rent asked for vacant for-rent units in 2022: $882
Median gross rent in Pleasure Ridge Park, KY in 2022: $1,031
Housing units in Pleasure Ridge Park with a mortgage: 5,186 (695 second mortgage, 898 home equity loan, 26 both second mortgage and home equity loan)
Houses without a mortgage: 2,692
Compare current foreclosures near Pleasure Ridge Park, KY:
| Photo | Address | Area | Beds / Baths | Price | Details |
|---|---|---|---|---|---|

|
#1
Melody Way
Louisville, KY 40299
|
1,242 sq. feet
|
1 baths 3 beds |
$300,000
|
show details |

|
#2
Doe Run Way
New Albany, IN 47150
|
1,380 sq. feet
|
2 baths 3 beds |
$285,000
|
show details |

|
#3
Chillicoop Rd
Shepherdsville, KY 40165
|
- sq. feet
|
2 baths 4 beds |
$99,900
|
show details |

|
#4
Jersey Park Rd
Floyds Knobs, IN 47119
|
720 sq. feet
|
1 baths 1 beds |
show details | |

|
#5
S Clark Blvd
Clarksville, IN 47129
|
2,304 sq. feet
|
2 baths 3 beds |
show details | |

|
#6
Welch Dr
Louisville, KY 40272
|
740 sq. feet
|
1 baths 2 beds |
show details | |

|
#7
W Chestnut St
Louisville, KY 40203
|
1,568 sq. feet
|
3 baths 3 beds |
show details | |

|
#8
N 41st St
Louisville, KY 40212
|
1,100 sq. feet
|
1 baths 4 beds |
show details | |

|
#9
S Bayly Ave
Louisville, KY 40206
|
2,610 sq. feet
|
2 baths 2 beds |
show details | |

|
#10
Jessamine Ln
Louisville, KY 40258
|
1,107 sq. feet
|
1 baths 3 beds |
show details |
| Photo | Address | Area | Beds / Baths | Price | Details |
|---|---|---|---|---|---|

|
#11
Belmar Dr
Louisville, KY 40213
|
1,458 sq. feet
|
1 baths 3 beds |
show details | |

|
#12
Elliott Ave
Louisville, KY 40211
|
1,235 sq. feet
|
1 baths 2 beds |
show details | |

|
#13
S Campbell St Unit 210
Louisville, KY 40206
|
1,237 sq. feet
|
1 baths 1 beds |
show details | |

|
#14
Breckenridge Ln
Louisville, KY 40218
|
1,472 sq. feet
|
1 baths 2 beds |
show details | |

|
#15
Morris Ave
Jeffersonville, IN 47130
|
1,320 sq. feet
|
1 baths 3 beds |
show details | |

|
#16
Saint Roche Dr
Louisville, KY 40299
|
1,094 sq. feet
|
2 baths 4 beds |
show details | |

|
#17
Cross Rd
Louisville, KY 40204
|
2,696 sq. feet
|
2 baths 2 beds |
show details | |

|
#18
S 5th St
Louisville, KY 40214
|
1,008 sq. feet
|
1 baths 3 beds |
show details | |

|
#19
S 42nd St
Louisville, KY 40211
|
1,078 sq. feet
|
1 baths 1 beds |
show details | |

|
#20
Fieldstone Ct
New Albany, IN 47150
|
1,276 sq. feet
|
2 baths 3 beds |
show details |
| Photo | Address | Area | Beds / Baths | Price | Details |
|---|---|---|---|---|---|

|
#21
Dorset Rd
Louisville, KY 40214
|
1,125 sq. feet
|
1 baths 4 beds |
show details | |

|
#22
Mary St
Jeffersonville, IN 47130
|
1,144 sq. feet
|
1 baths 2 beds |
show details | |

|
#23
Genung Dr
New Albany, IN 47150
|
864 sq. feet
|
1 baths 2 beds |
show details | |

|
#24
Ealy St
New Albany, IN 47150
|
1,036 sq. feet
|
1 baths 4 beds |
show details | |

|
#25
Garda Dr
Louisville, KY 40219
|
900 sq. feet
|
1 baths - beds |
show details | |

|
#26
Hover Ct
Sellersburg, IN 47172
|
1,756 sq. feet
|
2 baths 3 beds |
show details | |

|
#27
Cheryl Dr
Jeffersonville, IN 47130
|
999 sq. feet
|
1 baths 3 beds |
show details | |

|
#28
S Peak Ave
Shepherdsville, KY 40165
|
1,659 sq. feet
|
2 baths 3 beds |
show details | |

|
#29
Main St
Jeffersonville, IN 47130
|
1,260 sq. feet
|
1 baths 3 beds |
show details | |

|
#30
Crimson Point Dr
Jeffersonville, IN 47130
|
1,860 sq. feet
|
2 baths 3 beds |
show details |
| Photo | Address | Area | Beds / Baths | Price | Details |
|---|---|---|---|---|---|

|
#31
Crimson Point Dr
Jeffersonville, IN 47130
|
2,257 sq. feet
|
2 baths 3 beds |
show details | |

|
#32
Tony Ln
Shepherdsville, KY 40165
|
1,748 sq. feet
|
2 baths 3 beds |
show details | |

|
#33
Sunflower Ave
Louisville, KY 40216
|
1,188 sq. feet
|
1 baths - beds |
show details | |

|
#34
Flagstaff Dr
Jeffersonville, IN 47130
|
1,752 sq. feet
|
3 baths 3 beds |
show details | |

|
#35
Mud Hen Dr
Shepherdsville, KY 40165
|
1,249 sq. feet
|
2 baths 3 beds |
show details | |

|
#36
Griffin St
New Albany, IN 47150
|
720 sq. feet
|
1 baths 3 beds |
show details | |

|
#37
Spicewood Dr
Clarksville, IN 47129
|
1,911 sq. feet
|
1 baths 4 beds |
show details | |

|
#38
Brigetta Dr NE
Corydon, IN 47112
|
1,260 sq. feet
|
2 baths 3 beds |
show details | |

|
#39
Pennwood Dr
New Albany, IN 47150
|
2,372 sq. feet
|
2 baths 4 beds |
show details | |

|
#40
Parkway Dr
New Albany, IN 47150
|
1,372 sq. feet
|
1 baths 3 beds |
show details |
| Photo | Address | Area | Beds / Baths | Price | Details |
|---|---|---|---|---|---|

|
#41
Highway 11
Lanesville, IN 47136
|
1,436 sq. feet
|
1 baths 3 beds |
show details | |

|
#42
Seneca Dr NE
Georgetown, IN 47122
|
1,488 sq. feet
|
2 baths 3 beds |
show details | |

|
#43
Old Hickory Ct
New Albany, IN 47150
|
1,136 sq. feet
|
2 baths 3 beds |
show details | |

|
#44
Blackiston Ridge Ct
Clarksville, IN 47129
|
1,478 sq. feet
|
2 baths 3 beds |
show details | |

|
#45
N Larkspur Dr
Jeffersonville, IN 47130
|
1,161 sq. feet
|
1 baths 3 beds |
show details | |

|
#46
Wahoo Dr
New Albany, IN 47150
|
988 sq. feet
|
1 baths 3 beds |
show details | |

|
#47
Mctavish Dr
Clarksville, IN 47129
|
832 sq. feet
|
1 baths 2 beds |
show details | |

|
#48
Hurst Rd
Brooks, KY 40109
|
2,145 sq. feet
|
2 baths 3 beds |
show details | |

|
#49
Deerwood Dr
New Albany, IN 47150
|
2,340 sq. feet
|
2 baths 3 beds |
show details | |

|
Check over 1 million property listings on Foreclosure.com!
|
browse all offers | |||

 | Home prices - can we even afford a house in a nice are of Louisville? (22 replies) |
| Five years gone (13 replies) |
| How does Louisville compare... (84 replies) |
| Family move to Louisville! (9 replies) |
| Relocating single mom w/ Special needs child, Louisville (3 replies) |
| Relocation to Work at Mill Creek Power Station (2 replies) |

Household type by relationship:
Households: 726,943- In family households: 580,435 (118,887 male householders, 70,095 female householders)
126,329 spouses, 205,111 children (190,669 natural, 5,126 adopted, 9,316 stepchildren), 18,004 grandchildren, 7,360 brothers or sisters, 5,615 parents, foster children, 8,500 other relatives, 17,409 non-relatives
- In nonfamily households: 146,508 (55,241 male householders (43,300 living alone)), 64,952 female householders (55,543 living alone)), 26,315 nonrelatives
- In group quarters: 14,153 (8,529 institutionalized population)
98,371 married couples with children.
51,135 single-parent households (8,275 men, 42,860 women).
97.2% of residents of Pleasure Ridge Park speak English at home.
1.4% of residents speak Spanish at home (80% speak English very well, 9% speak English well, 7% speak English not well, 4% don't speak English at all).
0.8% of residents speak other Indo-European language at home (83% speak English very well, 15% speak English well, 2% speak English not well).
0.4% of residents speak Asian or Pacific Island language at home (30% speak English very well, 13% speak English well, 50% speak English not well, 7% don't speak English at all).
0.1% of residents speak other language at home (65% speak English very well, 35% speak English well).
Foreign born population: 723 (2.5%)
(67.9% of them are naturalized citizens)
| Here: | 5.4 |
| State: | 6.4 |
| Here: | 4.2 |
| State: | 4.4 |

- Bedrooms in owner-occupied houses and condos in Pleasure Ridge Park, Kentucky
- 10no bedroom
- 1471 bedroom
- 1,2462 bedrooms
- 5,5283 bedrooms
- 1,0704 bedrooms
- 1325+ bedrooms

- Bedrooms in renter-occupied apartments in Pleasure Ridge Park, Kentucky
- 53no bedroom
- 7301 bedroom
- 7222 bedrooms
- 5573 bedrooms
- 954 bedrooms
- 225+ bedrooms

- Cars and other vehicles available in Pleasure Ridge Park in owner-occupied houses/condos
- 258no vehicle
- 2,2151 vehicle
- 3,9002 vehicles
- 1,3193 vehicles
- 3584 vehicles
- 835+ vehicles

- Cars and other vehicles available in Pleasure Ridge Park in renter-occupied apartments
- 242no vehicle
- 1,1471 vehicle
- 6492 vehicles
- 1293 vehicles
- 04 vehicles
- 125+ vehicles

- Rooms in owner-occupied houses in Pleasure Ridge Park, Kentucky
- 01 room
- 302 rooms
- 1203 rooms
- 5214 rooms
- 2,8515 rooms
- 2,6586 rooms
- 1,0257 rooms
- 5048 rooms
- 4249+ rooms

- Rooms in renter-occupied apartments in Pleasure Ridge Park, Kentucky
- 481 room
- 772 rooms
- 5173 rooms
- 5474 rooms
- 5145 rooms
- 2996 rooms
- 887 rooms
- 268 rooms
- 639+ rooms


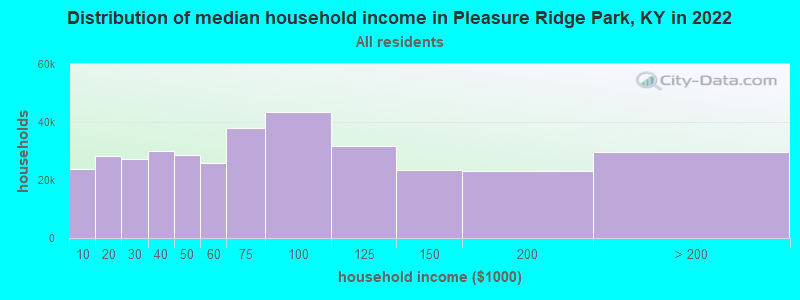
Pleasure Ridge Park, KY household income distribution

- 23,824Less than $10,000
- 28,403$10,000 to $19,999
- 27,322$20,000 to $29,999
- 30,134$30,000 to $39,999
- 28,544$40,000 to $49,999
- 25,923$50,000 to $59,999
- 37,847$60,000 to $74,999
- 43,519$75,000 to $99,999
- 31,590$100,000 to $124,999
- 23,415$125,000 to $149,999
- 22,994$150,000 to $199,999
- 29,592$200,000 or more
Percentage of workers working in this county: 90.6%
Number of people working at home: 2,147 (14.4% of all workers)
Travel time to work (commute)
- Less than 5 minutes: 209
- 5 to 9 minutes: 822
- 10 to 14 minutes: 1,891
- 15 to 19 minutes: 1,829
- 20 to 24 minutes: 2,164
- 25 to 29 minutes: 1,415
- 30 to 34 minutes: 2,406
- 35 to 39 minutes: 387
- 40 to 44 minutes: 378
- 45 to 59 minutes: 444
- 60 to 89 minutes: 217
- 90 or more minutes: 236
Means of transportation to work:
- Drove a car alone: 10,806 (85.6%)
- Carpooled: 1,217 (9.6%)
- Bus or trolley bus: 144 (1.1%)
- Motorcycle: 7 (0.1%)
- Bicycle: 11 (0.1%)
- Walked: 135 (1.1%)
- Other means: 78 (0.6%)
- Worked at home: 222 (1.8%)


- Year of entry for the foreign-born population in Pleasure Ridge Park, Kentucky
- 381995 to March 2000
- 361990 to 1994
- 451985 to 1989
- 431980 to 1984
- 51975 to 1979
- 141970 to 1974
- 01965 to 1969
- 90Before 1965

First ancestries reported:
- United States: 5,191 (23.4%)
- German: 4,558 (20.6%)
- Irish: 3,836 (17.3%)
- Other: 3,314 (15.0%)
- English: 2,257 (10.2%)
- French: 537 (2.4%)
- Italian: 522 (2.4%)
- Dutch: 468 (2.1%)
- Scottish: 375 (1.7%)
- Scotch-Irish: 328 (1.5%)
- Polish: 132 (0.6%)
- Arab: 104 (0.5%)
- Swiss: 73 (0.3%)
- Welsh: 71 (0.3%)
- French Canadian: 69 (0.3%)
- Swedish: 58 (0.3%)
- Danish: 51 (0.2%)
- Portuguese: 46 (0.2%)
- Subsaharan African: 36 (0.2%)
- Hungarian: 35 (0.2%)
- Russian: 34 (0.2%)
- Norwegian: 29 (0.1%)
- Czech: 16 (0.07%)
- West Indian: 10 (0.05%)
Most common places of birth for foreign-born residents (%):
| Pleasure Ridge Park: | 22.1% (60) |
| Kentucky: | 8.3% (6,658) |
| Pleasure Ridge Park: | 9.2% (25) |
| Kentucky: | 0.3% (265) |
| Pleasure Ridge Park: | 9.2% (25) |
| Kentucky: | 3.4% (2,702) |
| Pleasure Ridge Park: | 9.2% (25) |
| Kentucky: | 19.3% (15,511) |
| Pleasure Ridge Park: | 8.5% (23) |
| Kentucky: | 3.5% (2,816) |
| Pleasure Ridge Park: | 6.3% (17) |
| Kentucky: | 4.3% (3,464) |
| Pleasure Ridge Park: | 4.4% (12) |
| Kentucky: | 0.5% (370) |
| Pleasure Ridge Park: | 4.1% (11) |
| Kentucky: | 0.9% (749) |
| Pleasure Ridge Park: | 3.7% (10) |
| Kentucky: | 0.2% (175) |
| Pleasure Ridge Park: | 3.7% (10) |
| Kentucky: | 0.7% (567) |
| Pleasure Ridge Park: | 3.3% (9) |
| Kentucky: | 4.7% (3,734) |
| Pleasure Ridge Park: | 3.0% (8) |
| Kentucky: | 3.1% (2,459) |
| Pleasure Ridge Park: | 2.6% (7) |
| Kentucky: | 0.2% (182) |
| Pleasure Ridge Park: | 2.6% (7) |
| Kentucky: | 0.3% (225) |
| Pleasure Ridge Park: | 2.6% (7) |
| Kentucky: | 0.7% (575) |
| Pleasure Ridge Park: | 1.8% (5) |
| Kentucky: | 0.7% (551) |
| Pleasure Ridge Park: | 1.8% (5) |
| Kentucky: | 0.3% (204) |
| Pleasure Ridge Park: | 1.8% (5) |
| Kentucky: | 0.9% (730) |
Place of birth for U.S.-born residents:
- This state: 22,310
- Other state: 3,230
- Northeast: 380
- Midwest: 1,284
- South: 1,291
- West: 275
62% of Pleasure Ridge Park residents lived in the same house 5 years ago.
Out of people who lived in different houses, 84% lived in this county.
Out of people who lived in different counties, 33% lived in Kentucky.
Education attainment for males 25 years and older:
- No schooling: 80
- Nursery to 4th grade: 15
- 5th and 6th grade: 110
- 7th and 8th grade: 390
- 9th grade: 376
- 10th grade: 355
- 11th grade: 328
- 12th grade, no diploma: 225
- High school graduate (or equivalency): 3,730
- Less than 1 year of college: 568
- Some college more than 1 year, no degree: 1,006
- Associate degree: 504
- Bachelor's degree: 589
- Master's degree: 151
- Professional school degree: 37
- Doctorate degree: 0

Education attainment for females 25 years and older:
- No schooling: 24
- Nursery to 4th grade: 33
- 5th and 6th grade: 54
- 7th and 8th grade: 401
- 9th grade: 356
- 10th grade: 417
- 11th grade: 318
- 12th grade, no diploma: 321
- High school graduate (or equivalency): 3,921
- Less than 1 year of college: 812
- Some college more than 1 year, no degree: 1,170
- Associate degree: 489
- Bachelor's degree: 442
- Master's degree: 242
- Professional school degree: 51
- Doctorate degree: 17


Housing units in structures:
- One, detached: 9,175
- One, attached: 157
- Two: 31
- 3 or 4: 308
- 5 to 9: 336
- 10 to 19: 320
- 20 to 49: 238
- 50 or more: 89
- Mobile homes: 36
Median worth of mobile homes: $128,674
Housing units lacking complete kitchen facilities: 0.3%

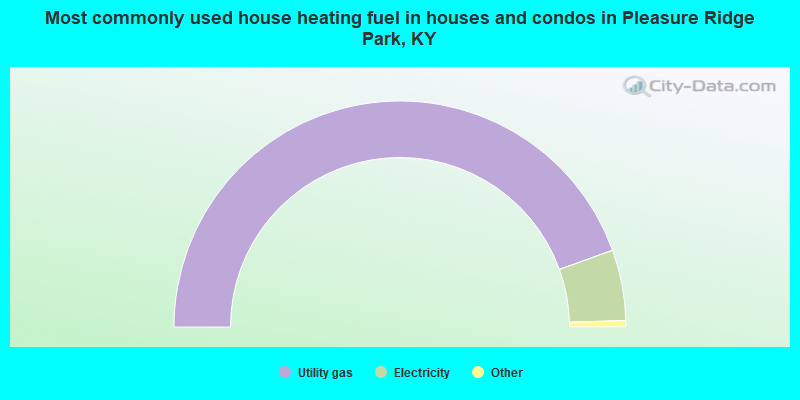
- 89.0%Utility gas
- 10.1%Electricity
- 0.4%Bottled, tank, or LP gas
- 0.2%Coal or coke
- 0.2%Other fuel
- 0.1%Wood
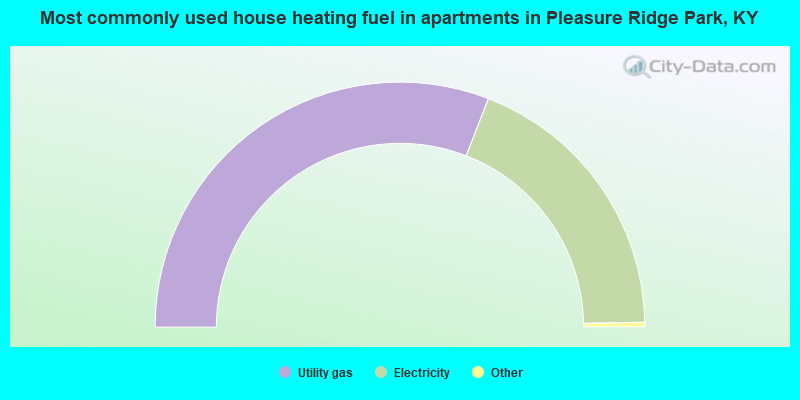
- 61.7%Utility gas
- 37.6%Electricity
- 0.3%Other fuel
- 0.3%No fuel used
Private vs. public school enrollment:
| Here: | 18.2% |
| Kentucky: | 11.9% |
| Here: | 14.1% |
| Kentucky: | 10.6% |
| Here: | 19.9% |
| Kentucky: | 18.1% |


