Pleasant Grove, UT (Utah) Houses and Residents
Estimated median house or condo value in 2022: $518,901 (it was $161,500 in 2000 )
Pleasant Grove:
$518,901Utah:
$499,500
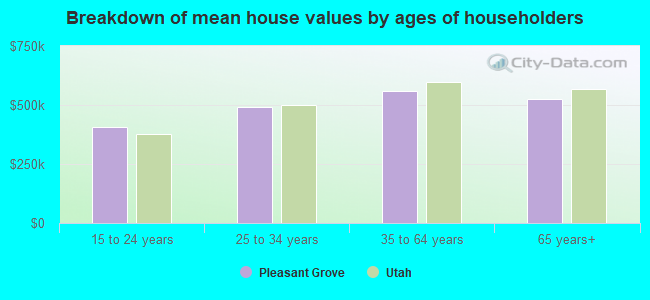
Lower value quartile - upper value quartile: $402,978 - $654,672Mean price in 2022: Detached houses: $559,936 Here:
$559,936State:
$607,750
Townhouses or other attached units: $359,734 Here:
$359,734State:
$444,505
In 3-to-4-unit structures: $809,833 Here:
$809,833State:
$362,850
In 5-or-more-unit structures: $242,851 Here:
$242,851State:
$412,810
Mobile homes: $53,456 Here:
$53,456State:
$113,475
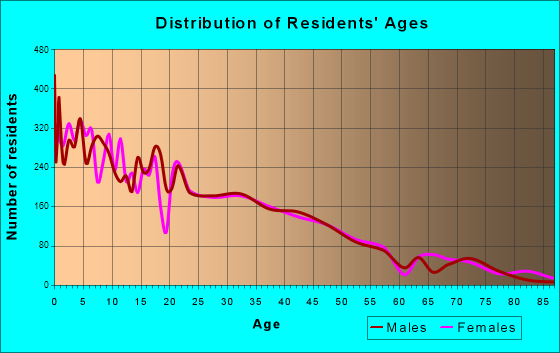
Total population: 37,064 (Urban population: 23,373, Rural population: 168 (all nonfarm) )
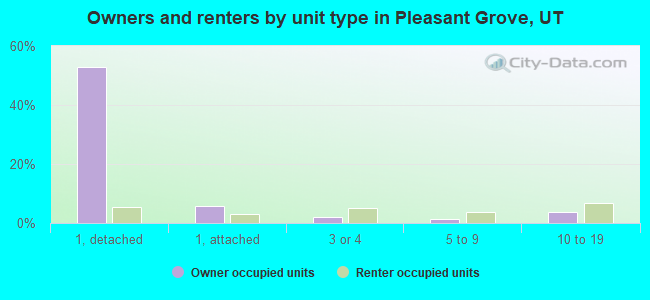
Houses: 13,095 (12,517 occupied: 8,404 owner occupied, 4,138 renter occupied )
% of renters here:
33%State:
29%
Housing density: 1,502 houses/condos per square mile
Median price asked for vacant for-sale houses and condos in 2022: $2,950,040.
Median contract rent in 2022: $1,353 (lower quartile is $1,126, upper quartile is $1,616)
Median rent asked for vacant for-rent units in 2022: $1,683
Median gross rent in Pleasant Grove, UT in 2022: $1,465
Housing units in Pleasant Grove with a mortgage: 5,642 (939 second mortgage, 19 home equity loan, 748 both second mortgage and home equity loan )Houses without a mortgage: 72
Median household income for houses/condos with a mortgage: $117,676
Median household income for apartments without a mortgage: $104,077
Median monthly housing costs: $1,444
Data:
Median house or condo value ($)
Median house or condo value ($ change since 2000)
Median house or condo value ($) - White
Median house or condo value ($) - Black or African American
Median house or condo value ($) - Asian
Median house or condo value ($) - Hispanic or Latino
Median house or condo value ($) - American Indian and Alaska Native
Median house or condo value ($) - Multirace
Median house or condo value ($) - Other Race
Median price asked for mobile homes ($)
Household density (households per square mile)
Mean house or condo value by units in structure - 1, detached ($)
Mean house or condo value by units in structure - 1, attached ($)
Mean house or condo value by units in structure - 2 ($)
Mean house or condo value by units in structure by units in structure - 3 or 4 ($)
Mean house or condo value by units in structure - 5 or more ($)
Mean house or condo value by units in structure - Boat, RV, van, etc. ($)
Mean house or condo value by units in structure - Mobile home ($)
Median contract rent ($)
Median contract rent - Lower quartile ($)
Median contract rent - Upper quartile ($)
Median gross rent ($)
Urban houses (%)
Rural houses (%)
Houses occupied (%)
Houses occupied (% change since 2000)
Houses owner occupied (%)
Houses owner occupied (% change since 2000)
Houses renter occupied (%)
Houses renter occupied (% change since 2000)
Vacant housing units - For rent (%)
Vacant housing units - For rent (% change since 2000)
Vacant housing units - For sale only (%)
Vacant housing units - For sale only (% change since 2000)
Vacant housing units - Rented or sold, not occupied (%)
Vacant housing units - Rented or sold, not occupied (% change since 2000)
Vacant housing units - For seasonal, recreational, or occasional use (%)
Vacant housing units - For seasonal, recreational, or occasional use (% change since 2000)
Vacant housing units - For migrant workers (%)
Vacant housing units - For migrant workers (% change since 2000)
Vacant housing units - Other vacant (%)
Vacant housing units - Other vacant (% change since 2000)
Median monthly housing costs ($)
Median household income for houses/condos with a mortgage ($)
Median household income for houses/condos without a mortgage ($)
Median household income ($)
Median household income ($) - White
Median household income ($) - Black or African American
Median household income ($) - Asian
Median household income ($) - Hispanic or Latino
Median household income ($) - American Indian and Alaska Native
Median household income ($) - Multirace
Median household income ($) - Other Race
Mortgage status - with mortgage (%)
Mortgage status - with second mortgage (%)
Mortgage status - with home equity loan (%)
Mortgage status - with both second mortgage and home equity loan (%)
Mortgage status - without a mortgage (%)
Median year house/condo built
Median year apartment built
Household type by relationship - Male householder living alone (%)
Household type by relationship - Male householder not living alone (%)
Household type by relationship - Female householder living alone (%)
Household type by relationship - Female householder not living alone (%)
Household type by relationship - Opposite-Sex spouse (%)
Household type by relationship - Same-Sex spouse (%)
Household type by relationship - Opposite-Sex unmarried partner (%)
Household type by relationship - Same-Sex unmarried partner (%)
Household type by relationship - In group quarters (%)
Size of family households - 2-person household (%)
Size of family households - 3-person household (%)
Size of family households - 4-person household (%)
Size of family households - 5-person household (%)
Size of family households - 6-person household (%)
Size of family households - 7-or-more-person household (%)
Size of nonfamily households - 1-person household (%)
Size of nonfamily households - 2-person household (%)
Size of nonfamily households - 3-person household (%)
Size of nonfamily households - 4-person household (%)
Size of nonfamily households - 5-person household (%)
Size of nonfamily households - 6-person household (%)
Size of nonfamily households - 7-or-moreperson household (%)
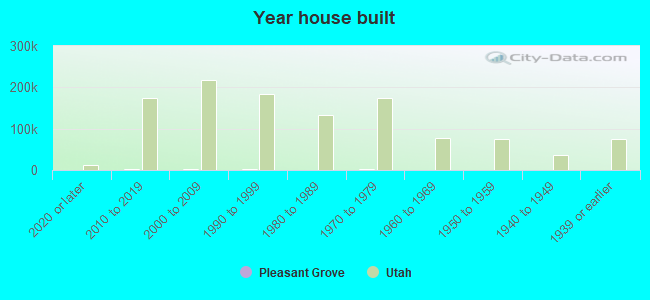
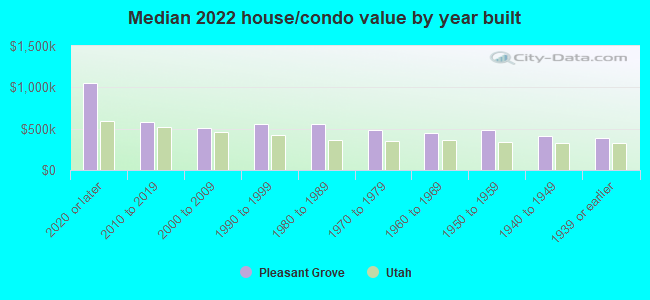
Year house built - Built 2010 or later (%)
Year house built - Built 2000 to 2009 (%)
Year house built - Built 1990 to 1999 (%)
Year house built - Built 1980 to 1989 (%)
Year house built - Built 1970 to 1979 (%)
Year house built - Built 1960 to 1969 (%)
Year house built - Built 1950 to 1959 (%)
Year house built - Built 1940 to 1949 (%)
Year house built - Built 1939 or earlier (%)
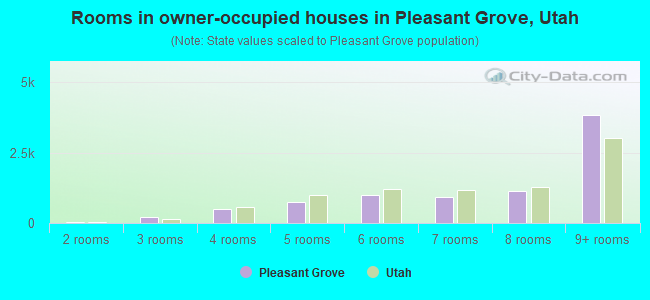
Median number of rooms in houses and condos
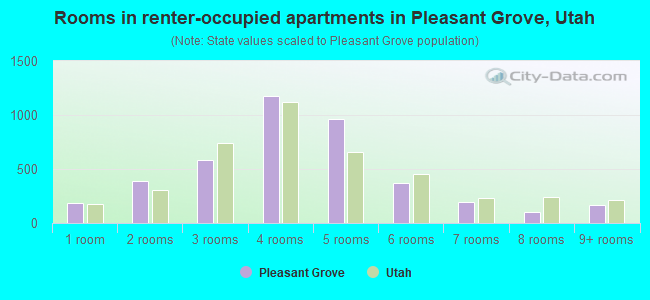
Median number of rooms in apartments
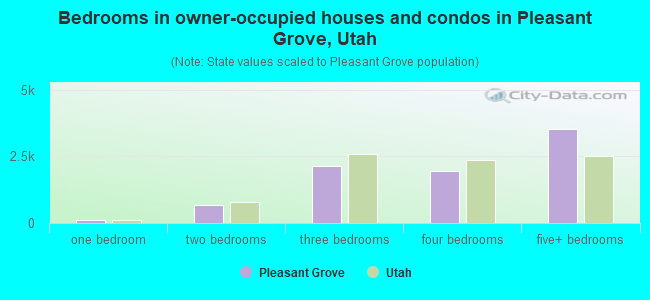
Median number of bedrooms in owner occupied houses
Mean number of bedrooms in owner occupied houses
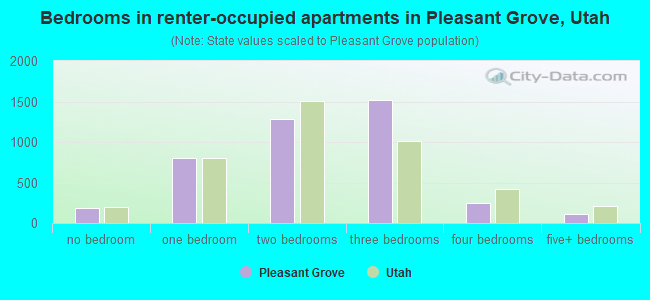
Median number of bedrooms in renter occupied houses
Mean number of bedrooms in renter occupied houses
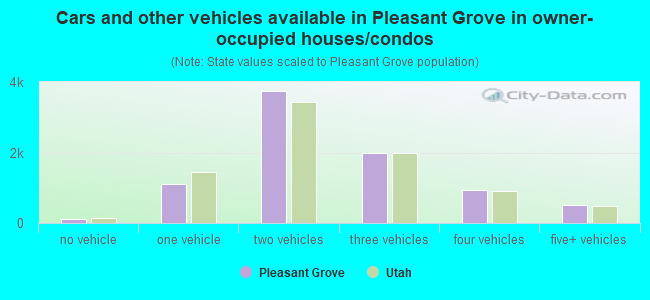
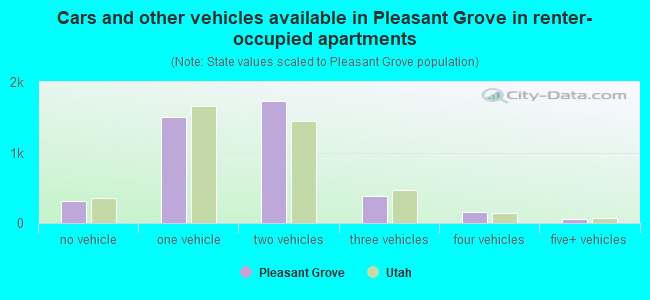
Median number of vehichles in owner occupied houses
Mean number of vehichles in owner occupied houses
Median number of vehichles in renter occupied houses
Mean number of vehichles in renter occupied houses
Rooms in owner-occupied houses - 1 room (%)
Rooms in owner-occupied houses - 2 rooms (%)
Rooms in owner-occupied houses - 3 rooms (%)
Rooms in owner-occupied houses - 4 rooms (%)
Rooms in owner-occupied houses - 5 rooms (%)
Rooms in owner-occupied houses - 6 rooms (%)
Rooms in owner-occupied houses - 7 rooms (%)
Rooms in owner-occupied houses - 8 rooms (%)
Rooms in owner-occupied houses - 9+ rooms (%)
Rooms in renter-occupied houses - 1 room (%)
Rooms in renter-occupied houses - 2 rooms (%)
Rooms in renter-occupied houses - 3 rooms (%)
Rooms in renter-occupied houses - 4 rooms (%)
Rooms in renter-occupied houses - 5 rooms (%)
Rooms in renter-occupied houses - 6 rooms (%)
Rooms in renter-occupied houses - 7 rooms (%)
Rooms in renter-occupied houses - 8 rooms (%)
Rooms in renter-occupied houses - 9+ rooms (%)
Bedrooms in owner-occupied houses - no bedrooms (%)
Bedrooms in owner-occupied houses - 1 bedroom (%)
Bedrooms in owner-occupied houses - 2 bedrooms (%)
Bedrooms in owner-occupied houses - 3 bedrooms (%)
Bedrooms in owner-occupied houses - 4 bedrooms (%)
Bedrooms in owner-occupied houses - 5+ bedrooms (%)
Bedrooms in renter-occupied houses - no bedrooms (%)
Bedrooms in renter-occupied houses - 1 bedroom (%)
Bedrooms in renter-occupied houses - 2 bedrooms (%)
Bedrooms in renter-occupied houses - 3 bedrooms (%)
Bedrooms in renter-occupied houses - 4 bedrooms (%)
Bedrooms in renter-occupied houses - 5+ bedrooms (%)
Vehicles available in owner-occupied houses - no vehicle available (%)
Vehicles available in owner-occupied houses - 1 vehicle available(%)
Vehicles available in owner-occupied houses - 2 Vehicles available (%)
Vehicles available in owner-occupied houses - 3 Vehicles available (%)
Vehicles available in owner-occupied houses - 4 Vehicles available (%)
Vehicles available in owner-occupied houses - 5+ Vehicles available (%)
Vehicles available in renter-occupied houses - no vehicle available (%)
Vehicles available in renter-occupied houses - 1 vehicle available (%)
Vehicles available in renter-occupied houses - 2 Vehicles available (%)
Vehicles available in renter-occupied houses - 3 Vehicles available (%)
Vehicles available in renter-occupied houses - 4 Vehicles available (%)
Vehicles available in renter-occupied houses - 5+ Vehicles available (%)
Housing units in structures - 1, detached (%)
Housing units in structures - 1, attached (%)
Housing units in structures - 2 (%)
Housing units in structures - 3 or 4 (%)
Housing units in structures - 5 to 9 (%)
Housing units in structures - 10 to 19 (%)
Housing units in structures - 20 to 49 (%)
Housing units in structures - 50 or more (%)
Housing units in structures - Mobile home (%)
Housing units in structures - Boat, RV, van, etc. (%)
Housing units in structures - Owners - 1, detached (%)
Housing units in structures - Owners - 1, attached (%)
Housing units in structures - Owners - 2 (%)
Housing units in structures - Owners - 3 or 4 (%)
Housing units in structures - Owners - 5 to 9 (%)
Housing units in structures - Owners - 10 to 19 (%)
Housing units in structures - Owners - 20 to 49 (%)
Housing units in structures - Owners - 50 or more (%)
Housing units in structures - Owners - Mobile home (%)
Housing units in structures - Owners - Boat, RV, van, etc. (%)
Housing units in structures - Renters - 1, detached (%)
Housing units in structures - Renters - 1, attached (%)
Housing units in structures - Renters - 2 (%)
Housing units in structures - Renters - 3 or 4 (%)
Housing units in structures - Renters - 5 to 9 (%)
Housing units in structures - Renters - 10 to 19 (%)
Housing units in structures - Renters - 20 to 49 (%)
Housing units in structures - Renters - 50 or more (%)
Housing units in structures - Renters - Mobile home (%)
Housing units in structures - Renters - Boat, RV, van, etc. (%)
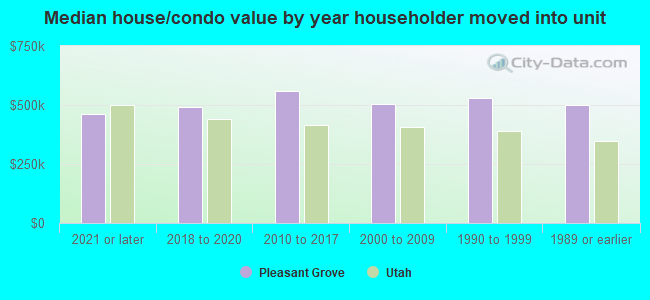
House/condo owner moved in on average (years ago)
Renter moved in on average (years ago)
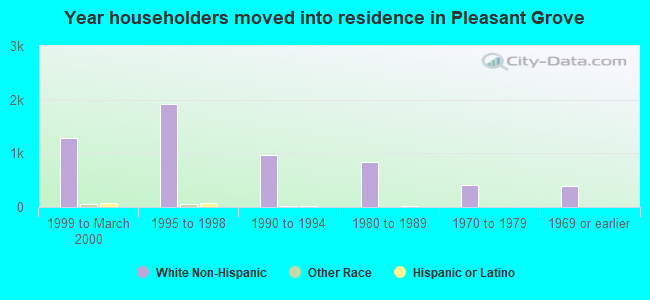
Year householder moved into unit - Moved in 1999 to March 2000 (%)
Year householder moved into unit - Moved in 1999 to March 2000 (%) - White
Year householder moved into unit - Moved in 1999 to March 2000 (%) - Black or African American
Year householder moved into unit - Moved in 1999 to March 2000 (%) - Asian
Year householder moved into unit - Moved in 1999 to March 2000 (%) - Hispanic or Latino
Year householder moved into unit - Moved in 1999 to March 2000 (%) - American Indian and Alaska Native
Year householder moved into unit - Moved in 1999 to March 2000 (%) - Multirace
Year householder moved into unit - Moved in 1999 to March 2000 (%) - Other Race
Year householder moved into unit - Moved in 1995 to 1998 (%)
Year householder moved into unit - Moved in 1995 to 1998 (%) - White
Year householder moved into unit - Moved in 1995 to 1998 (%) - Black or African American
Year householder moved into unit - Moved in 1995 to 1998 (%) - Asian
Year householder moved into unit - Moved in 1995 to 1998 (%) - Hispanic or Latino
Year householder moved into unit - Moved in 1995 to 1998 (%) - American Indian and Alaska Native
Year householder moved into unit - Moved in 1995 to 1998 (%) - Multirace
Year householder moved into unit - Moved in 1995 to 1998 (%) - Other Race
Year householder moved into unit - Moved in 1990 to 1994 (%)
Year householder moved into unit - Moved in 1990 to 1994 (%) - White
Year householder moved into unit - Moved in 1990 to 1994 (%) - Black or African American
Year householder moved into unit - Moved in 1990 to 1994 (%) - Asian
Year householder moved into unit - Moved in 1990 to 1994 (%) - Hispanic or Latino
Year householder moved into unit - Moved in 1990 to 1994 (%) - American Indian and Alaska Native
Year householder moved into unit - Moved in 1990 to 1994 (%) - Multirace
Year householder moved into unit - Moved in 1990 to 1994 (%) - Other Race
Year householder moved into unit - Moved in 1980 to 1989 (%)
Year householder moved into unit - Moved in 1980 to 1989 (%) - White
Year householder moved into unit - Moved in 1980 to 1989 (%) - Black or African American
Year householder moved into unit - Moved in 1980 to 1989 (%) - Asian
Year householder moved into unit - Moved in 1980 to 1989 (%) - Hispanic or Latino
Year householder moved into unit - Moved in 1980 to 1989 (%) - American Indian and Alaska Native
Year householder moved into unit - Moved in 1980 to 1989 (%) - Multirace
Year householder moved into unit - Moved in 1980 to 1989 (%) - Other Race
Year householder moved into unit - Moved in 1970 to 1979 (%)
Year householder moved into unit - Moved in 1970 to 1979 (%) - White
Year householder moved into unit - Moved in 1970 to 1979 (%) - Black or African American
Year householder moved into unit - Moved in 1970 to 1979 (%) - Asian
Year householder moved into unit - Moved in 1970 to 1979 (%) - Hispanic or Latino
Year householder moved into unit - Moved in 1970 to 1979 (%) - American Indian and Alaska Native
Year householder moved into unit - Moved in 1970 to 1979 (%) - Multirace
Year householder moved into unit - Moved in 1970 to 1979 (%) - Other Race
Year householder moved into unit - Moved in 1969 or earlier (%)
Year householder moved into unit - Moved in 1969 or earlier (%) - White
Year householder moved into unit - Moved in 1969 or earlier (%) - Black or African American
Year householder moved into unit - Moved in 1969 or earlier (%) - Asian
Year householder moved into unit - Moved in 1969 or earlier (%) - Hispanic or Latino
Year householder moved into unit - Moved in 1969 or earlier (%) - American Indian and Alaska Native
Year householder moved into unit - Moved in 1969 or earlier (%) - Multirace
Year householder moved into unit - Moved in 1969 or earlier (%) - Other Race
Housing units lacking complete plumbing facilities (%)
Housing units lacking complete kitchen facilities (%)
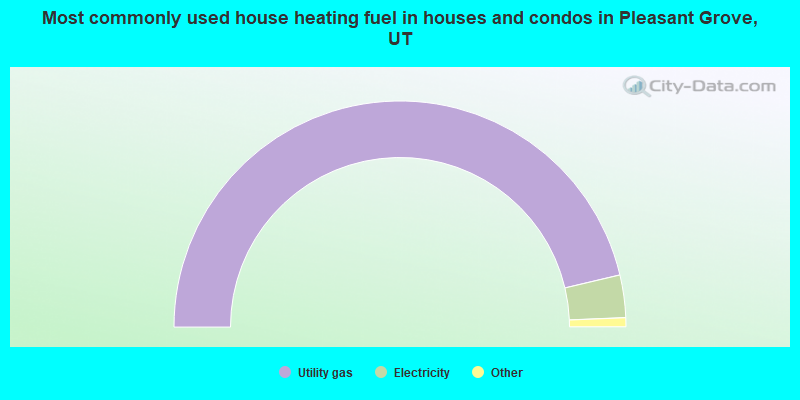
House heating fuel used in houses and condos - Utility gas (%)
House heating fuel used in houses and condos - Bottled, tank, or LP gas (%)
House heating fuel used in houses and condos - Electricity (%)
House heating fuel used in houses and condos - Fuel oil, kerosene, etc. (%)
House heating fuel used in houses and condos - Coal or coke (%)
House heating fuel used in houses and condos - Wood (%)
House heating fuel used in houses and condos - Solar energy (%)
House heating fuel used in houses and condos - Other fuel (%)
House heating fuel used in houses and condos - No fuel used (%)
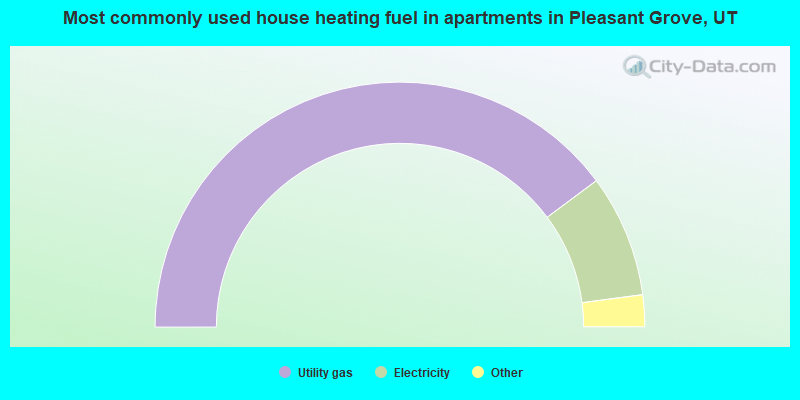
House heating fuel used in apartments - Utility gas (%)
House heating fuel used in apartments - Bottled, tank, or LP gas (%)
House heating fuel used in apartments - Electricity (%)
House heating fuel used in apartments - Fuel oil, kerosene, etc. (%)
House heating fuel used in apartments - Coal or coke (%)
House heating fuel used in apartments - Wood (%)
House heating fuel used in apartments - Solar energy (%)
House heating fuel used in apartments - Other fuel (%)
House heating fuel used in apartments - No fuel used (%)
Median year house/condo built: 1996Median year apartment built: 2006Household type by relationship:
Households: 39,500
Male householders: 6,753 (1,183 living alone ), Female householders: 5,367 (915 living alone )8,303 spouses (8,250 opposite-sex spouses ), 402 unmarried partners , (399 opposite-sex unmarried partners ), 15,613 children (14,986 natural , 291 adopted , 335 stepchildren ), 630 grandchildren , 402 brothers or sisters , 455 parents , 0 foster children , 800 other relatives , 688 non-relatives In group quarters: 82
Size of family households: 2,964 2-persons , 2,315 3-persons , 1,782 4-persons , 1,534 5-persons , 825 6-persons , 454 7-or-more-persons .
Size of nonfamily households: 2,255 1-person , 280 2-persons , 141 3-persons , 41 4-persons .
9,717 married couples with children. single-parent households (948 men , 715 women ).
88.5% of residents of Pleasant Grove speak English at home. of residents speak Spanish at home (59% speak English very well , 20% speak English well , 15% speak English not well , 6% don't speak English at all ).of residents speak other Indo-European language at home (86% speak English very well , 13% speak English well , 1% speak English not well ).of residents speak Asian or Pacific Island language at home (88% speak English very well , 9% speak English well , 2% speak English not well ).of residents speak other language at home (82% speak English very well , 18% speak English well ).
Foreign born population: 2,440 (6.2%)of them are naturalized citizens )
Median number of rooms in houses and condos:
Median number of rooms in apartments
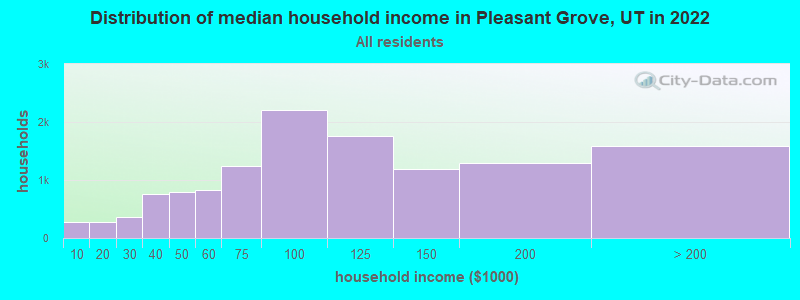
Pleasant Grove, UT household income distribution 270 Less than $10,000273 $10,000 to $19,999365 $20,000 to $29,999755 $30,000 to $39,999785 $40,000 to $49,999827 $50,000 to $59,9991,241 $60,000 to $74,9992,209 $75,000 to $99,9991,758 $100,000 to $124,9991,192 $125,000 to $149,9991,287 $150,000 to $199,9991,581 $200,000 or more
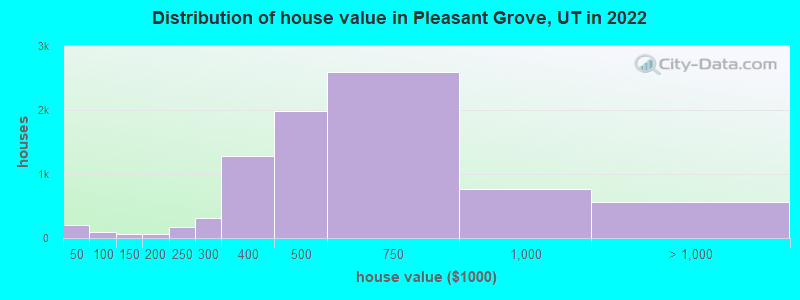
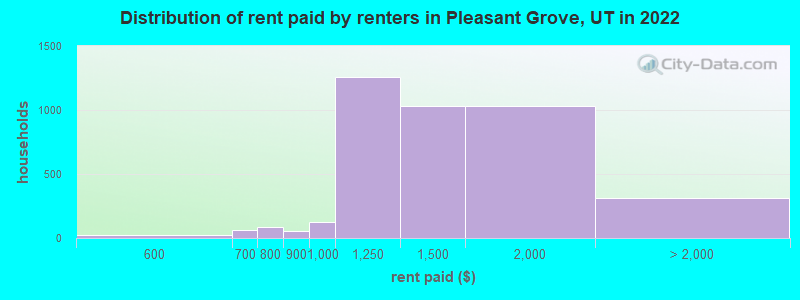
Home value of owner - occupied houses in 2022 in Pleasant Grove, UT 85 Less than $10,00013 $20,000 to $24,99913 $30,000 to $34,99934 $35,000 to $39,99952 $40,000 to $49,99929 $50,000 to $59,99913 $70,000 to $79,9994 $90,000 to $99,99957 $125,000 to $149,99935 $150,000 to $174,99922 $175,000 to $199,999177 $200,000 to $249,999318 $250,000 to $299,9991,274 $300,000 to $399,9991,986 $400,000 to $499,9992,592 $500,000 to $749,999771 $750,000 to $999,999489 $1,000,000 to $1,499,99915 $1,500,000 to $1,999,99955 $2,000,000 or moreRent paid by renters in 2022 in Pleasant Grove, UT 27 $500 to $5495 $600 to $64953 $650 to $69918 $700 to $74968 $750 to $79958 $800 to $899127 $900 to $9991,257 $1,000 to $1,2491,034 $1,250 to $1,4991,028 $1,500 to $1,999157 $2,000 to $2,49929 $2,500 to $2,999127 No cash rent
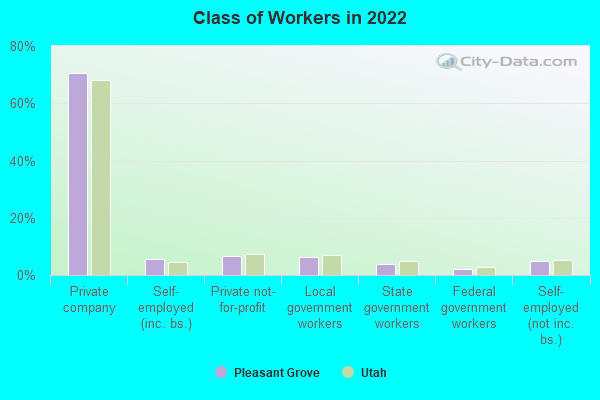
Percentage of workers working in this county: 85.2%Number of people working at home: 3,448 (17.6% of all workers )
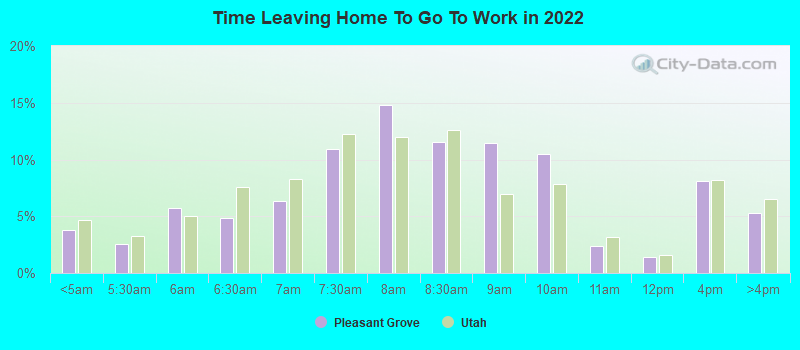
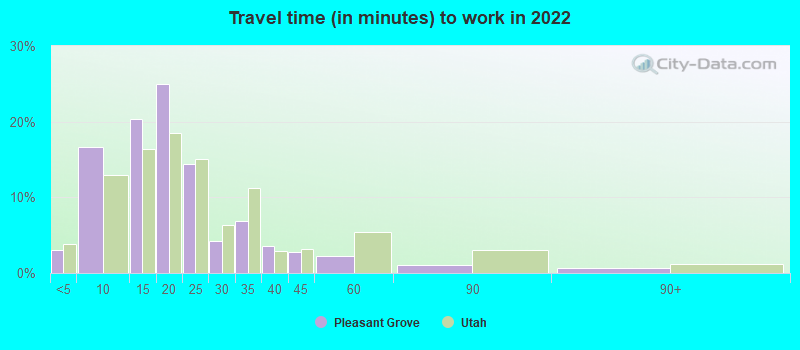
Travel time to work (commute)
Less than 5 minutes: 4875 to 9 minutes: 2,58810 to 14 minutes: 2,57215 to 19 minutes: 3,07020 to 24 minutes: 2,40125 to 29 minutes: 1,03530 to 34 minutes: 1,59035 to 39 minutes: 62840 to 44 minutes: 44745 to 59 minutes: 79960 to 89 minutes: 42990 or more minutes: 96
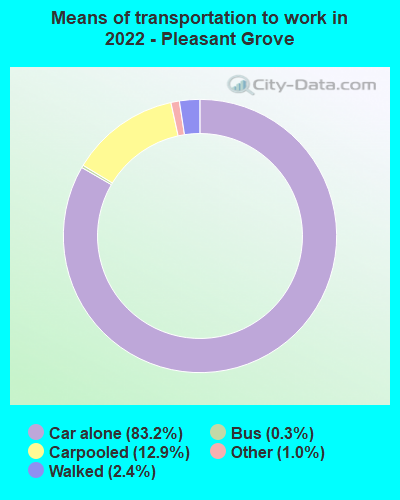
Means of transportation to work:
Drove a car alone: 11,381 (67.0%)Carpooled: 1,739 (10.2%)Bus : 48 (0.3%)Long-distance train or commuter rail : 6 (0.0%)Taxi: 147 (0.9%)Bicycle: 8 (0.0%)Walked: 244 (1.4%)Worked at home: 3,448 (20.3%)
Unemployment by race in 2022
Unemployment rate for White non-Hispanic residents 2.0% Males2.0% FemalesUnemployment rate for American Indian and Alaska Native residents 15.6% MalesUnemployment rate for other race residents 3.3% MalesUnemployment rate for two or more race residents 11.4% Males1.0% FemalesUnemployment rate for Hispanic or Latino residents 1.2% Males1.9% Females
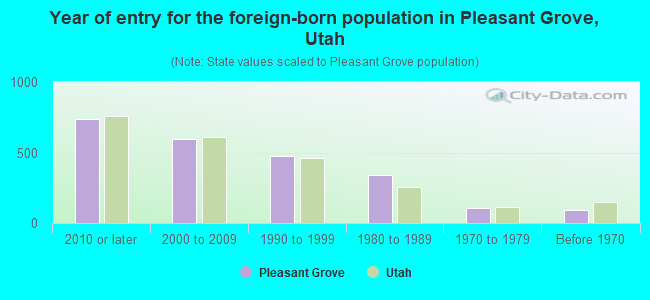
Year of entry for the foreign-born population in Pleasant Grove, Utah
740 2010 or later 596 2000 to 2009 472 1990 to 1999 340 1980 to 1989 103 1970 to 1979 93 Before 1970
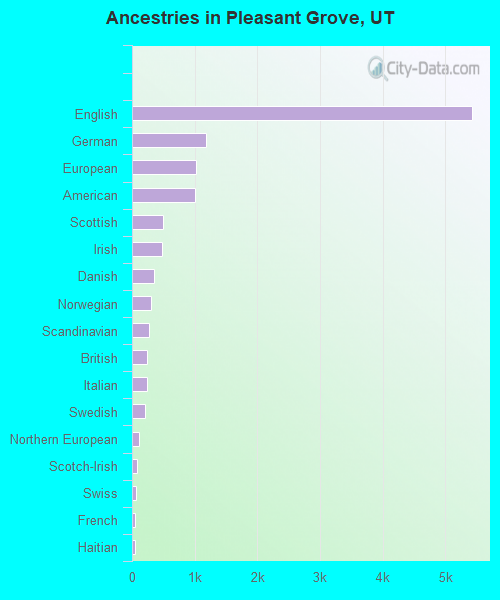
First ancestries reported:
English: 5,426 (32.0%)
German: 1,184 (7.0%)
European: 1,021 (6.0%)
American: 1,007 (5.9%)
Scottish: 492 (2.9%)
Irish: 472 (2.8%)
Danish: 348 (2.1%)
Norwegian: 299 (1.8%)
Scandinavian: 276 (1.6%)
British: 240 (1.4%)
Italian: 238 (1.4%)
Swedish: 210 (1.2%)
Northern European: 113 (0.7%)
Scotch-Irish: 80 (0.5%)
Swiss: 66 (0.4%)
French: 52 (0.3%)
Haitian: 51 (0.3%)
Dutch: 47 (0.3%)
Welsh: 43 (0.3%)
Russian: 36 (0.2%)
Estonian: 27 (0.2%)
Icelander: 23 (0.1%)
Polish: 22 (0.1%)
Slavic: 20 (0.1%)
Canadian: 19 (0.1%)
Brazilian: 19 (0.1%)
Armenian: 15 (0.09%)
Hungarian: 13 (0.08%)
Czech: 10 (0.06%)
Moroccan: 8 (0.05%)
Iranian: 7 (0.04%)
Basque: 6 (0.04%)
Romanian: 4 (0.02%)
French Canadian: 3 (0.02%)
African: 3 (0.02%) Most common places of birth for foreign-born residents (%): Mexico Pleasant Grove:
26.8% (607)Utah:
36.1% (99,740)
Philippines Pleasant Grove:
10.5% (238)Utah:
2.3% (6,468)
Chile Pleasant Grove:
8.1% (183)Utah:
1.3% (3,479)
Oceania, n.e.c. Pleasant Grove:
6.7% (151)Utah:
2.7% (7,472)
Venezuela Pleasant Grove:
5.8% (132)Utah:
3.2% (8,804)
El Salvador Pleasant Grove:
5.7% (129)Utah:
2.6% (7,062)
Canada Pleasant Grove:
3.8% (87)Utah:
3.0% (8,341)
Argentina Pleasant Grove:
3.4% (77)Utah:
1.3% (3,570)
Costa Rica Pleasant Grove:
2.8% (64)Utah:
0.2% (497)
Guatemala Pleasant Grove:
2.8% (63)Utah:
2.1% (5,902)
Colombia Pleasant Grove:
2.7% (62)Utah:
2.0% (5,555)
China, excluding Hong Kong and Taiwan Pleasant Grove:
2.2% (49)Utah:
2.9% (8,017)
Peru Pleasant Grove:
2.1% (48)Utah:
2.9% (7,901)
Russia Pleasant Grove:
1.9% (44)Utah:
0.6% (1,555)
Brazil Pleasant Grove:
1.8% (40)Utah:
2.8% (7,644)
Place of birth for U.S.-born residents:
This state: 25,668Other state: 11,063Northeast: 482Midwest: 1,479South: 2,031West: 7,069 85.1% of Pleasant Grove residents lived in the same house 1 years ago.
Out of people who lived in different houses, 39.9% lived in this county.
Out of people who lived in different counties, 63.8% lived in Utah.
Pleasant Grove:
85.1%State average:
85.7%
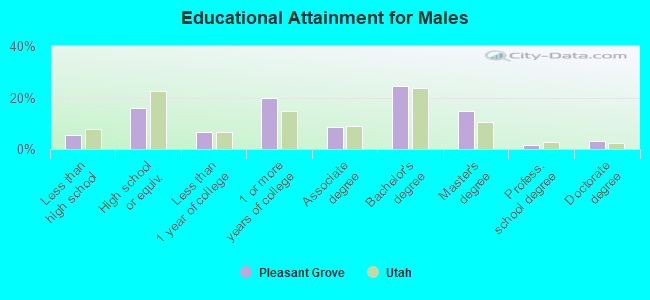
Education attainment for males 25 years and older:
No schooling: 114Nursery to 4th grade: 165th and 6th grade: 67th and 8th grade: 849th grade: 110th grade: 6411th grade: 7012th grade, no diploma: 265High school graduate (or equivalency): 1,797Less than 1 year of college: 773Some college more than 1 year, no degree: 2,245Associate degree: 993Bachelor's degree: 2,791Master's degree: 1,664Professional school degree: 156Doctorate degree: 349
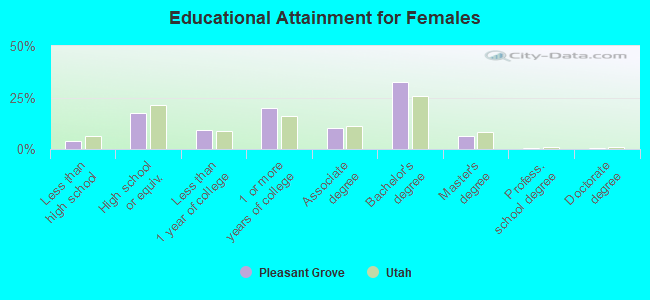
Education attainment for females 25 years and older:
No schooling: 146Nursery to 4th grade: 95th and 6th grade: 427th and 8th grade: 359th grade: 010th grade: 1411th grade: 6512th grade, no diploma: 110High school graduate (or equivalency): 1,868Less than 1 year of college: 999Some college more than 1 year, no degree: 2,133Associate degree: 1,089Bachelor's degree: 3,502Master's degree: 665Professional school degree: 67Doctorate degree: 33
Housing units in structures:
One, detached: 7,764One, attached: 1,199Two: 1523 or 4: 9715 to 9: 63610 to 19: 1,45920 to 49: 61750 or more: 250Mobile homes: 43Housing units lacking complete plumbing facilities in 2022: 0.1%Housing units lacking complete kitchen facilities in 2022: 0.4%House/condo owner moved in on average 11 years ago
Renter moved in on average 0 years ago
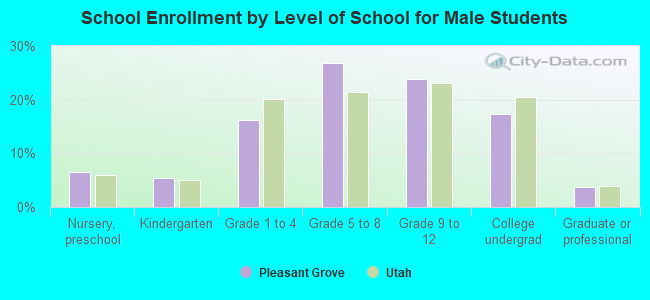
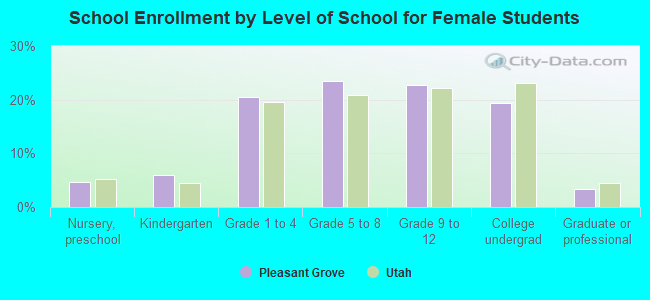
Private vs. public school enrollment:
Students in private schools in grades 1 to 8 (elementary and middle school): 360 Students in private schools in grades 9 to 12 (high school): 160 Students in private undergraduate colleges: 749