Plant City, FL (Florida) Houses and Residents
Estimated median house or condo value in 2022: $280,805 (it was $82,400 in 2000 )
Plant City:
$280,805Florida:
$354,100
Lower value quartile - upper value quartile: $187,356 - $378,842Mean price in 2022: Detached houses: $302,200 Here:
$302,200State:
$500,941
Townhouses or other attached units: $225,571 Here:
$225,571State:
$370,869
In 2-unit structures: $195,279 Here:
$195,279State:
$423,188
In 3-to-4-unit structures: $160,605 Here:
$160,605State:
$309,944
In 5-or-more-unit structures: $212,188 Here:
$212,188State:
$447,145
Mobile homes: $56,559 Here:
$56,559State:
$113,202
Total population: 36,627 (Urban population: 29,964, Rural population: 142 (all nonfarm) )
Houses: 15,877 (15,029 occupied: 9,445 owner occupied, 5,646 renter occupied )
% of renters here:
37%State:
33%
Housing density: 702 houses/condos per square mile
Median price asked for vacant for-sale houses and condos in 2022: $229,133.
Median contract rent in 2022: $1,170 (lower quartile is $922, upper quartile is $1,446)
Median rent asked for vacant for-rent units in 2022: $1,488
Median gross rent in Plant City, FL in 2022: $1,333
Housing units in Plant City with a mortgage: 5,920 (452 second mortgage, 0 home equity loan, 328 both second mortgage and home equity loan )Houses without a mortgage: 125
Median household income for houses/condos with a mortgage: $88,012
Median household income for apartments without a mortgage: $57,489
Median monthly housing costs: $1,242
Data:
Median house or condo value ($)
Median house or condo value ($ change since 2000)
Median house or condo value ($) - White
Median house or condo value ($) - Black or African American
Median house or condo value ($) - Asian
Median house or condo value ($) - Hispanic or Latino
Median house or condo value ($) - American Indian and Alaska Native
Median house or condo value ($) - Multirace
Median house or condo value ($) - Other Race
Median price asked for mobile homes ($)
Household density (households per square mile)
Mean house or condo value by units in structure - 1, detached ($)
Mean house or condo value by units in structure - 1, attached ($)
Mean house or condo value by units in structure - 2 ($)
Mean house or condo value by units in structure by units in structure - 3 or 4 ($)
Mean house or condo value by units in structure - 5 or more ($)
Mean house or condo value by units in structure - Boat, RV, van, etc. ($)
Mean house or condo value by units in structure - Mobile home ($)
Median contract rent ($)
Median contract rent - Lower quartile ($)
Median contract rent - Upper quartile ($)
Median gross rent ($)
Urban houses (%)
Rural houses (%)
Houses occupied (%)
Houses occupied (% change since 2000)
Houses owner occupied (%)
Houses owner occupied (% change since 2000)
Houses renter occupied (%)
Houses renter occupied (% change since 2000)
Vacant housing units - For rent (%)
Vacant housing units - For rent (% change since 2000)
Vacant housing units - For sale only (%)
Vacant housing units - For sale only (% change since 2000)
Vacant housing units - Rented or sold, not occupied (%)
Vacant housing units - Rented or sold, not occupied (% change since 2000)
Vacant housing units - For seasonal, recreational, or occasional use (%)
Vacant housing units - For seasonal, recreational, or occasional use (% change since 2000)
Vacant housing units - For migrant workers (%)
Vacant housing units - For migrant workers (% change since 2000)
Vacant housing units - Other vacant (%)
Vacant housing units - Other vacant (% change since 2000)
Median monthly housing costs ($)
Median household income for houses/condos with a mortgage ($)
Median household income for houses/condos without a mortgage ($)
Median household income ($)
Median household income ($) - White
Median household income ($) - Black or African American
Median household income ($) - Asian
Median household income ($) - Hispanic or Latino
Median household income ($) - American Indian and Alaska Native
Median household income ($) - Multirace
Median household income ($) - Other Race
Mortgage status - with mortgage (%)
Mortgage status - with second mortgage (%)
Mortgage status - with home equity loan (%)
Mortgage status - with both second mortgage and home equity loan (%)
Mortgage status - without a mortgage (%)
Median year house/condo built
Median year apartment built
Household type by relationship - Male householder living alone (%)
Household type by relationship - Male householder not living alone (%)
Household type by relationship - Female householder living alone (%)
Household type by relationship - Female householder not living alone (%)
Household type by relationship - Opposite-Sex spouse (%)
Household type by relationship - Same-Sex spouse (%)
Household type by relationship - Opposite-Sex unmarried partner (%)
Household type by relationship - Same-Sex unmarried partner (%)
Household type by relationship - In group quarters (%)
Size of family households - 2-person household (%)
Size of family households - 3-person household (%)
Size of family households - 4-person household (%)
Size of family households - 5-person household (%)
Size of family households - 6-person household (%)
Size of family households - 7-or-more-person household (%)
Size of nonfamily households - 1-person household (%)
Size of nonfamily households - 2-person household (%)
Size of nonfamily households - 3-person household (%)
Size of nonfamily households - 4-person household (%)
Size of nonfamily households - 5-person household (%)
Size of nonfamily households - 6-person household (%)
Size of nonfamily households - 7-or-moreperson household (%)
Year house built - Built 2010 or later (%)
Year house built - Built 2000 to 2009 (%)
Year house built - Built 1990 to 1999 (%)
Year house built - Built 1980 to 1989 (%)
Year house built - Built 1970 to 1979 (%)
Year house built - Built 1960 to 1969 (%)
Year house built - Built 1950 to 1959 (%)
Year house built - Built 1940 to 1949 (%)
Year house built - Built 1939 or earlier (%)
Median number of rooms in houses and condos
Median number of rooms in apartments
Median number of bedrooms in owner occupied houses
Mean number of bedrooms in owner occupied houses
Median number of bedrooms in renter occupied houses
Mean number of bedrooms in renter occupied houses
Median number of vehichles in owner occupied houses
Mean number of vehichles in owner occupied houses
Median number of vehichles in renter occupied houses
Mean number of vehichles in renter occupied houses
Rooms in owner-occupied houses - 1 room (%)
Rooms in owner-occupied houses - 2 rooms (%)
Rooms in owner-occupied houses - 3 rooms (%)
Rooms in owner-occupied houses - 4 rooms (%)
Rooms in owner-occupied houses - 5 rooms (%)
Rooms in owner-occupied houses - 6 rooms (%)
Rooms in owner-occupied houses - 7 rooms (%)
Rooms in owner-occupied houses - 8 rooms (%)
Rooms in owner-occupied houses - 9+ rooms (%)
Rooms in renter-occupied houses - 1 room (%)
Rooms in renter-occupied houses - 2 rooms (%)
Rooms in renter-occupied houses - 3 rooms (%)
Rooms in renter-occupied houses - 4 rooms (%)
Rooms in renter-occupied houses - 5 rooms (%)
Rooms in renter-occupied houses - 6 rooms (%)
Rooms in renter-occupied houses - 7 rooms (%)
Rooms in renter-occupied houses - 8 rooms (%)
Rooms in renter-occupied houses - 9+ rooms (%)
Bedrooms in owner-occupied houses - no bedrooms (%)
Bedrooms in owner-occupied houses - 1 bedroom (%)
Bedrooms in owner-occupied houses - 2 bedrooms (%)
Bedrooms in owner-occupied houses - 3 bedrooms (%)
Bedrooms in owner-occupied houses - 4 bedrooms (%)
Bedrooms in owner-occupied houses - 5+ bedrooms (%)
Bedrooms in renter-occupied houses - no bedrooms (%)
Bedrooms in renter-occupied houses - 1 bedroom (%)
Bedrooms in renter-occupied houses - 2 bedrooms (%)
Bedrooms in renter-occupied houses - 3 bedrooms (%)
Bedrooms in renter-occupied houses - 4 bedrooms (%)
Bedrooms in renter-occupied houses - 5+ bedrooms (%)
Vehicles available in owner-occupied houses - no vehicle available (%)
Vehicles available in owner-occupied houses - 1 vehicle available(%)
Vehicles available in owner-occupied houses - 2 Vehicles available (%)
Vehicles available in owner-occupied houses - 3 Vehicles available (%)
Vehicles available in owner-occupied houses - 4 Vehicles available (%)
Vehicles available in owner-occupied houses - 5+ Vehicles available (%)
Vehicles available in renter-occupied houses - no vehicle available (%)
Vehicles available in renter-occupied houses - 1 vehicle available (%)
Vehicles available in renter-occupied houses - 2 Vehicles available (%)
Vehicles available in renter-occupied houses - 3 Vehicles available (%)
Vehicles available in renter-occupied houses - 4 Vehicles available (%)
Vehicles available in renter-occupied houses - 5+ Vehicles available (%)
Housing units in structures - 1, detached (%)
Housing units in structures - 1, attached (%)
Housing units in structures - 2 (%)
Housing units in structures - 3 or 4 (%)
Housing units in structures - 5 to 9 (%)
Housing units in structures - 10 to 19 (%)
Housing units in structures - 20 to 49 (%)
Housing units in structures - 50 or more (%)
Housing units in structures - Mobile home (%)
Housing units in structures - Boat, RV, van, etc. (%)
Housing units in structures - Owners - 1, detached (%)
Housing units in structures - Owners - 1, attached (%)
Housing units in structures - Owners - 2 (%)
Housing units in structures - Owners - 3 or 4 (%)
Housing units in structures - Owners - 5 to 9 (%)
Housing units in structures - Owners - 10 to 19 (%)
Housing units in structures - Owners - 20 to 49 (%)
Housing units in structures - Owners - 50 or more (%)
Housing units in structures - Owners - Mobile home (%)
Housing units in structures - Owners - Boat, RV, van, etc. (%)
Housing units in structures - Renters - 1, detached (%)
Housing units in structures - Renters - 1, attached (%)
Housing units in structures - Renters - 2 (%)
Housing units in structures - Renters - 3 or 4 (%)
Housing units in structures - Renters - 5 to 9 (%)
Housing units in structures - Renters - 10 to 19 (%)
Housing units in structures - Renters - 20 to 49 (%)
Housing units in structures - Renters - 50 or more (%)
Housing units in structures - Renters - Mobile home (%)
Housing units in structures - Renters - Boat, RV, van, etc. (%)
House/condo owner moved in on average (years ago)
Renter moved in on average (years ago)
Year householder moved into unit - Moved in 1999 to March 2000 (%)
Year householder moved into unit - Moved in 1999 to March 2000 (%) - White
Year householder moved into unit - Moved in 1999 to March 2000 (%) - Black or African American
Year householder moved into unit - Moved in 1999 to March 2000 (%) - Asian
Year householder moved into unit - Moved in 1999 to March 2000 (%) - Hispanic or Latino
Year householder moved into unit - Moved in 1999 to March 2000 (%) - American Indian and Alaska Native
Year householder moved into unit - Moved in 1999 to March 2000 (%) - Multirace
Year householder moved into unit - Moved in 1999 to March 2000 (%) - Other Race
Year householder moved into unit - Moved in 1995 to 1998 (%)
Year householder moved into unit - Moved in 1995 to 1998 (%) - White
Year householder moved into unit - Moved in 1995 to 1998 (%) - Black or African American
Year householder moved into unit - Moved in 1995 to 1998 (%) - Asian
Year householder moved into unit - Moved in 1995 to 1998 (%) - Hispanic or Latino
Year householder moved into unit - Moved in 1995 to 1998 (%) - American Indian and Alaska Native
Year householder moved into unit - Moved in 1995 to 1998 (%) - Multirace
Year householder moved into unit - Moved in 1995 to 1998 (%) - Other Race
Year householder moved into unit - Moved in 1990 to 1994 (%)
Year householder moved into unit - Moved in 1990 to 1994 (%) - White
Year householder moved into unit - Moved in 1990 to 1994 (%) - Black or African American
Year householder moved into unit - Moved in 1990 to 1994 (%) - Asian
Year householder moved into unit - Moved in 1990 to 1994 (%) - Hispanic or Latino
Year householder moved into unit - Moved in 1990 to 1994 (%) - American Indian and Alaska Native
Year householder moved into unit - Moved in 1990 to 1994 (%) - Multirace
Year householder moved into unit - Moved in 1990 to 1994 (%) - Other Race
Year householder moved into unit - Moved in 1980 to 1989 (%)
Year householder moved into unit - Moved in 1980 to 1989 (%) - White
Year householder moved into unit - Moved in 1980 to 1989 (%) - Black or African American
Year householder moved into unit - Moved in 1980 to 1989 (%) - Asian
Year householder moved into unit - Moved in 1980 to 1989 (%) - Hispanic or Latino
Year householder moved into unit - Moved in 1980 to 1989 (%) - American Indian and Alaska Native
Year householder moved into unit - Moved in 1980 to 1989 (%) - Multirace
Year householder moved into unit - Moved in 1980 to 1989 (%) - Other Race
Year householder moved into unit - Moved in 1970 to 1979 (%)
Year householder moved into unit - Moved in 1970 to 1979 (%) - White
Year householder moved into unit - Moved in 1970 to 1979 (%) - Black or African American
Year householder moved into unit - Moved in 1970 to 1979 (%) - Asian
Year householder moved into unit - Moved in 1970 to 1979 (%) - Hispanic or Latino
Year householder moved into unit - Moved in 1970 to 1979 (%) - American Indian and Alaska Native
Year householder moved into unit - Moved in 1970 to 1979 (%) - Multirace
Year householder moved into unit - Moved in 1970 to 1979 (%) - Other Race
Year householder moved into unit - Moved in 1969 or earlier (%)
Year householder moved into unit - Moved in 1969 or earlier (%) - White
Year householder moved into unit - Moved in 1969 or earlier (%) - Black or African American
Year householder moved into unit - Moved in 1969 or earlier (%) - Asian
Year householder moved into unit - Moved in 1969 or earlier (%) - Hispanic or Latino
Year householder moved into unit - Moved in 1969 or earlier (%) - American Indian and Alaska Native
Year householder moved into unit - Moved in 1969 or earlier (%) - Multirace
Year householder moved into unit - Moved in 1969 or earlier (%) - Other Race
Housing units lacking complete plumbing facilities (%)
Housing units lacking complete kitchen facilities (%)
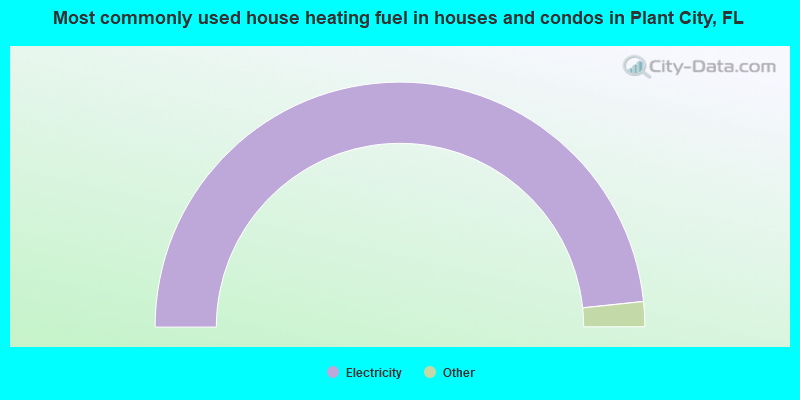
House heating fuel used in houses and condos - Utility gas (%)
House heating fuel used in houses and condos - Bottled, tank, or LP gas (%)
House heating fuel used in houses and condos - Electricity (%)
House heating fuel used in houses and condos - Fuel oil, kerosene, etc. (%)
House heating fuel used in houses and condos - Coal or coke (%)
House heating fuel used in houses and condos - Wood (%)
House heating fuel used in houses and condos - Solar energy (%)
House heating fuel used in houses and condos - Other fuel (%)
House heating fuel used in houses and condos - No fuel used (%)
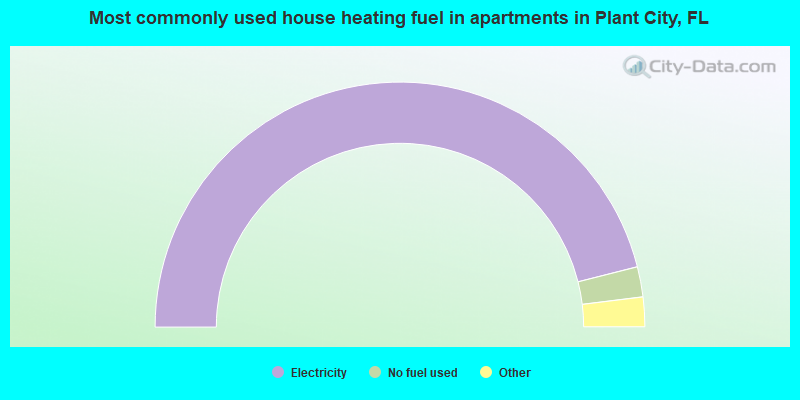
House heating fuel used in apartments - Utility gas (%)
House heating fuel used in apartments - Bottled, tank, or LP gas (%)
House heating fuel used in apartments - Electricity (%)
House heating fuel used in apartments - Fuel oil, kerosene, etc. (%)
House heating fuel used in apartments - Coal or coke (%)
House heating fuel used in apartments - Wood (%)
House heating fuel used in apartments - Solar energy (%)
House heating fuel used in apartments - Other fuel (%)
House heating fuel used in apartments - No fuel used (%)
Thoughts on mobile homes (24 replies)Downtown SRQ Blues Festival, Quilts on Parade, Gamble Plantation Open House, NHRA Pro Mods & more, all this weekend! (2 replies)Beertopia, Parrish Heritage Days, Art in the Park, Gamble Plantation Open House & more, all this weekend! (2 replies)Italian Feast & Carnival, Reggae, Antiques, Home & Craft shows, Jazz & more, all this weekend! (0 replies)Parrish Parade, Cornhole & Cocktails, Fine Arts Festival, Venice Home Show, Berry Fest & more, all this weekend! (1 reply)Lookin for inexpensive rent in the Tampa Bay area (126 replies)
Median year house/condo built: 1989Median year apartment built: 1987Household type by relationship:
Households: 40,863
Male householders: 6,769 (1,654 living alone ), Female householders: 8,172 (2,716 living alone )6,719 spouses (6,643 opposite-sex spouses ), 1,486 unmarried partners , (1,478 opposite-sex unmarried partners ), 12,794 children (11,977 natural , 206 adopted , 611 stepchildren ), 1,040 grandchildren , 510 brothers or sisters , 559 parents , 97 foster children , 757 other relatives , 1,583 non-relatives In group quarters: 370
Size of family households: 3,713 2-persons , 2,086 3-persons , 2,122 4-persons , 1,305 5-persons , 501 6-persons , 248 7-or-more-persons .
Size of nonfamily households: 4,204 1-person , 694 2-persons , 211 3-persons , 27 4-persons , 7 6-persons , 9 7-or-more-persons .
5,083 married couples with children. single-parent households (1,025 men , 1,917 women ).
70.4% of residents of Plant City speak English at home. of residents speak Spanish at home (57% speak English very well , 15% speak English well , 11% speak English not well , 17% don't speak English at all ).of residents speak other Indo-European language at home (70% speak English very well , 10% speak English well , 20% speak English not well ).of residents speak Asian or Pacific Island language at home (100% speak English very well ).of residents speak other language at home (86% speak English very well , 14% speak English not well ).
Foreign born population: 6,481 (15.9%)of them are naturalized citizens )
Median number of rooms in houses and condos:
Median number of rooms in apartments
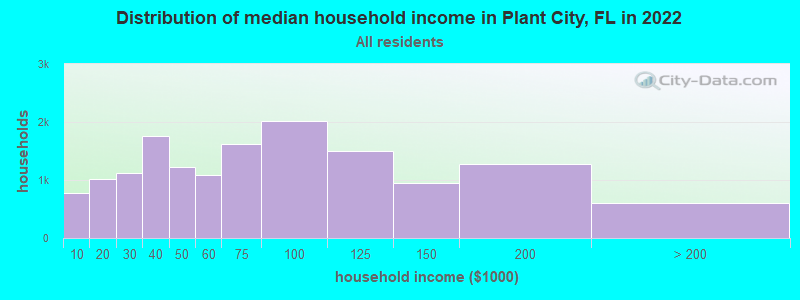
Plant City, FL household income distribution 779 Less than $10,0001,016 $10,000 to $19,9991,128 $20,000 to $29,9991,761 $30,000 to $39,9991,229 $40,000 to $49,9991,078 $50,000 to $59,9991,621 $60,000 to $74,9992,021 $75,000 to $99,9991,501 $100,000 to $124,999949 $125,000 to $149,9991,268 $150,000 to $199,999602 $200,000 or more
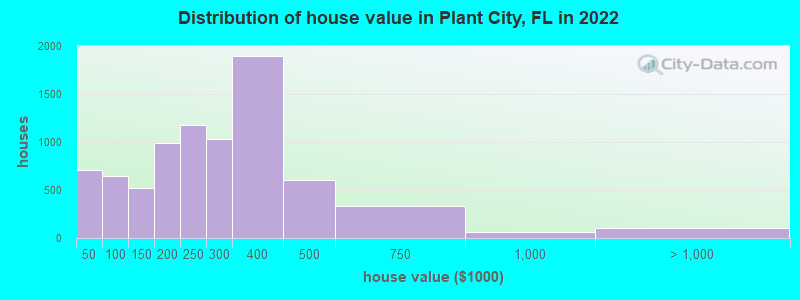
Home value of owner - occupied houses in 2022 in Plant City, FL 58 Less than $10,00069 $10,000 to $14,99928 $15,000 to $19,999138 $20,000 to $24,99962 $25,000 to $29,999203 $30,000 to $34,9999 $35,000 to $39,999135 $40,000 to $49,99947 $50,000 to $59,999150 $60,000 to $69,999118 $70,000 to $79,99978 $80,000 to $89,999113 $90,000 to $99,999193 $100,000 to $124,999324 $125,000 to $149,999510 $150,000 to $174,999475 $175,000 to $199,9991,172 $200,000 to $249,9991,030 $250,000 to $299,9991,896 $300,000 to $399,999608 $400,000 to $499,999334 $500,000 to $749,99966 $750,000 to $999,99928 $1,000,000 to $1,499,99979 $2,000,000 or moreRent paid by renters in 2022 in Plant City, FL 10 Less than $10026 $100 to $149176 $150 to $19943 $200 to $24918 $250 to $29924 $300 to $34930 $350 to $3995 $450 to $499119 $500 to $54941 $550 to $599170 $600 to $64984 $650 to $69962 $700 to $749226 $750 to $799368 $800 to $899496 $900 to $9991,362 $1,000 to $1,249690 $1,250 to $1,499696 $1,500 to $1,999225 $2,000 to $2,49927 $3,500 or more144 No cash rent
Percentage of workers working in this county: 78.6%Number of people working at home: 2,414 (11.3% of all workers )
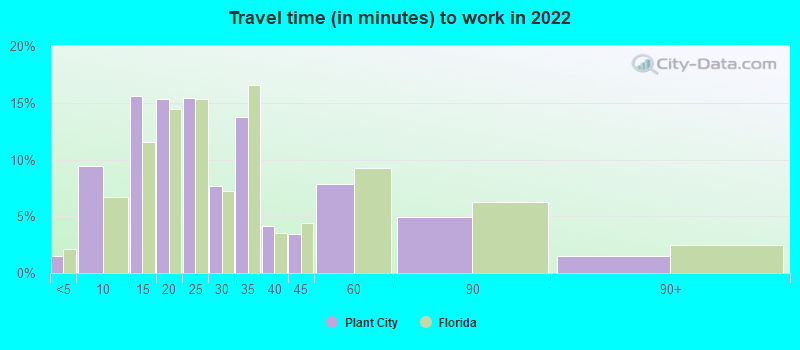
Travel time to work (commute)
Less than 5 minutes: 3655 to 9 minutes: 2,32510 to 14 minutes: 3,06115 to 19 minutes: 2,21420 to 24 minutes: 2,07225 to 29 minutes: 73830 to 34 minutes: 2,58935 to 39 minutes: 70640 to 44 minutes: 93145 to 59 minutes: 1,39560 to 89 minutes: 1,52690 or more minutes: 354
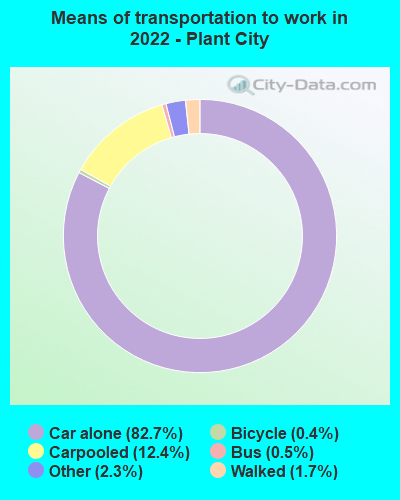
Means of transportation to work:
Drove a car alone: 16,547 (70.7%)Carpooled: 2,836 (12.1%)Bus : 77 (0.3%)Taxi: 527 (2.3%)Bicycle: 87 (0.4%)Walked: 314 (1.3%)Worked at home: 2,414 (10.3%)
Unemployment by race in 2022
Unemployment rate for White non-Hispanic residents 3.5% Males3.1% FemalesUnemployment rate for Black residents 4.1% Males1.0% FemalesUnemployment rate for American Indian and Alaska Native residents 100.0% FemalesUnemployment rate for other race residents 0.8% Males2.0% FemalesUnemployment rate for two or more race residents 2.6% Males2.5% FemalesUnemployment rate for Hispanic or Latino residents 0.3% Males3.0% Females
Year of entry for the foreign-born population in Plant City, Florida
2,231 2010 or later 1,699 2000 to 2009 1,070 1990 to 1999 1,028 1980 to 1989 313 1970 to 1979 186 Before 1970
First ancestries reported:
American: 2,141 (10.5%)
English: 1,528 (7.5%)
Irish: 1,129 (5.5%)
German: 803 (3.9%)
Italian: 575 (2.8%)
Trinidadian and Tobagonian: 470 (2.3%)
European: 463 (2.3%)
Polish: 204 (1.0%)
British West Indian: 150 (0.7%)
African: 127 (0.6%)
French: 102 (0.5%)
British: 80 (0.4%)
Scotch-Irish: 76 (0.4%)
Scottish: 75 (0.4%)
Greek: 64 (0.3%)
French Canadian: 55 (0.3%)
Jamaican: 40 (0.2%)
Canadian: 36 (0.2%)
Welsh: 36 (0.2%)
Turkish: 34 (0.2%)
Portuguese: 31 (0.2%)
Palestinian: 25 (0.1%)
Austrian: 25 (0.1%)
Norwegian: 25 (0.1%)
Haitian: 25 (0.1%)
Scandinavian: 24 (0.1%)
Cape Verdean: 15 (0.07%)
Ukrainian: 14 (0.07%)
Russian: 13 (0.06%)
Australian: 12 (0.06%)
Swiss: 12 (0.06%)
Bahamian: 12 (0.06%)
Czech: 12 (0.06%)
Israeli: 11 (0.05%)
Hungarian: 11 (0.05%)
West Indian: 11 (0.05%)
Eastern European: 10 (0.05%)
Romanian: 10 (0.05%)
Slovak: 9 (0.04%)
Lithuanian: 8 (0.04%)
Lebanese: 6 (0.03%)
Danish: 6 (0.03%) Most common places of birth for foreign-born residents (%): Mexico Plant City:
45.3% (2,820)Florida:
5.6% (257,152)
Cuba Plant City:
7.5% (464)Florida:
22.0% (1,006,576)
Trinidad and Tobago Plant City:
7.3% (455)Florida:
1.0% (43,642)
Colombia Plant City:
5.3% (331)Florida:
6.5% (298,669)
Guatemala Plant City:
3.3% (208)Florida:
2.1% (97,632)
Nicaragua Plant City:
3.0% (189)Florida:
2.3% (105,066)
Dominican Republic Plant City:
2.8% (175)Florida:
3.0% (137,727)
Honduras Plant City:
2.8% (173)Florida:
2.3% (107,160)
India Plant City:
2.4% (152)Florida:
2.1% (94,349)
Place of birth for U.S.-born residents:
This state: 21,020Other state: 11,313Northeast: 3,308Midwest: 3,343South: 3,746West: 795 88.0% of Plant City residents lived in the same house 1 years ago.
Out of people who lived in different houses, 41.2% lived in this county.
Out of people who lived in different counties, 58.0% lived in Florida.
Plant City:
88.0%State average:
86.3%
Education attainment for males 25 years and older:
No schooling: 476Nursery to 4th grade: 1155th and 6th grade: 4147th and 8th grade: 1659th grade: 34910th grade: 64411th grade: 16212th grade, no diploma: 346High school graduate (or equivalency): 4,499Less than 1 year of college: 883Some college more than 1 year, no degree: 1,594Associate degree: 981Bachelor's degree: 1,803Master's degree: 662Professional school degree: 196Doctorate degree: 136
Education attainment for females 25 years and older:
No schooling: 261Nursery to 4th grade: 735th and 6th grade: 2407th and 8th grade: 1559th grade: 55110th grade: 20511th grade: 20912th grade, no diploma: 270High school graduate (or equivalency): 4,102Less than 1 year of college: 860Some college more than 1 year, no degree: 1,834Associate degree: 1,533Bachelor's degree: 2,608Master's degree: 727Professional school degree: 111Doctorate degree: 86
Housing units in structures:
One, detached: 10,490One, attached: 748Two: 3913 or 4: 5955 to 9: 68810 to 19: 91720 to 49: 45050 or more: 628Mobile homes: 950Boats, RVs, vans, etc.: 15Median worth of mobile homes: $73,644
Housing units lacking complete plumbing facilities in 2022: 1.0%Housing units lacking complete kitchen facilities in 2022: 1.3%House/condo owner moved in on average 10 years ago
Renter moved in on average 3 years ago
Private vs. public school enrollment:
Students in private schools in grades 1 to 8 (elementary and middle school): 392 Students in private schools in grades 9 to 12 (high school): 100 Students in private undergraduate colleges: 283