Plainsboro Center, NJ (New Jersey) Houses and Residents
Estimated median house or condo value in 2022: $492,663 (it was $225,300 in 2000 )
Plainsboro Center:
$492,663New Jersey:
$428,900
Lower value quartile - upper value quartile: $417,191 - $703,554Mean price in 2022: Detached houses: $708,372 Here:
$708,372State:
$537,591
Townhouses or other attached units: $544,463 Here:
$544,463State:
$381,113
In 5-or-more-unit structures: $214,574 Here:
$214,574State:
$368,745
Total population: 2,712 (Urban population: 2,371, Rural population: 0)
Houses: 1,538 (1,467 occupied: 473 owner occupied, 1,006 renter occupied )
% of renters here:
68%State:
35%
Housing density: 2,287 houses/condos per square mile
Median price asked for vacant for-sale houses and condos in 2022 in this county: $458,901.
Median contract rent in 2022: $1,809 (lower quartile is $1,559, upper quartile is over $2,000)
Median rent asked for vacant for-rent units in 2022: $1,625
Median gross rent in Plainsboro Center, NJ in 2022: $1,764
Housing units in Plainsboro Center with a mortgage: 204 (39 second mortgage, 23 home equity loan, 17 both second mortgage and home equity loan )Houses without a mortgage: 0
Median household income for apartments without a mortgage: $104,517
Median monthly housing costs: $1,816
Data:
Median house or condo value ($)
Median house or condo value ($ change since 2000)
Median house or condo value ($) - White
Median house or condo value ($) - Black or African American
Median house or condo value ($) - Asian
Median house or condo value ($) - Hispanic or Latino
Median house or condo value ($) - American Indian and Alaska Native
Median house or condo value ($) - Multirace
Median house or condo value ($) - Other Race
Median price asked for mobile homes ($)
Household density (households per square mile)
Mean house or condo value by units in structure - 1, detached ($)
Mean house or condo value by units in structure - 1, attached ($)
Mean house or condo value by units in structure - 2 ($)
Mean house or condo value by units in structure by units in structure - 3 or 4 ($)
Mean house or condo value by units in structure - 5 or more ($)
Mean house or condo value by units in structure - Boat, RV, van, etc. ($)
Mean house or condo value by units in structure - Mobile home ($)
Median contract rent ($)
Median contract rent - Lower quartile ($)
Median contract rent - Upper quartile ($)
Median gross rent ($)
Urban houses (%)
Rural houses (%)
Houses occupied (%)
Houses occupied (% change since 2000)
Houses owner occupied (%)
Houses owner occupied (% change since 2000)
Houses renter occupied (%)
Houses renter occupied (% change since 2000)
Vacant housing units - For rent (%)
Vacant housing units - For rent (% change since 2000)
Vacant housing units - For sale only (%)
Vacant housing units - For sale only (% change since 2000)
Vacant housing units - Rented or sold, not occupied (%)
Vacant housing units - Rented or sold, not occupied (% change since 2000)
Vacant housing units - For seasonal, recreational, or occasional use (%)
Vacant housing units - For seasonal, recreational, or occasional use (% change since 2000)
Vacant housing units - For migrant workers (%)
Vacant housing units - For migrant workers (% change since 2000)
Vacant housing units - Other vacant (%)
Vacant housing units - Other vacant (% change since 2000)
Median monthly housing costs ($)
Median household income for houses/condos with a mortgage ($)
Median household income for houses/condos without a mortgage ($)
Median household income ($)
Median household income ($) - White
Median household income ($) - Black or African American
Median household income ($) - Asian
Median household income ($) - Hispanic or Latino
Median household income ($) - American Indian and Alaska Native
Median household income ($) - Multirace
Median household income ($) - Other Race
Mortgage status - with mortgage (%)
Mortgage status - with second mortgage (%)
Mortgage status - with home equity loan (%)
Mortgage status - with both second mortgage and home equity loan (%)
Mortgage status - without a mortgage (%)
Median year house/condo built
Median year apartment built
Household type by relationship - Male householder living alone (%)
Household type by relationship - Male householder not living alone (%)
Household type by relationship - Female householder living alone (%)
Household type by relationship - Female householder not living alone (%)
Household type by relationship - Opposite-Sex spouse (%)
Household type by relationship - Same-Sex spouse (%)
Household type by relationship - Opposite-Sex unmarried partner (%)
Household type by relationship - Same-Sex unmarried partner (%)
Household type by relationship - In group quarters (%)
Size of family households - 2-person household (%)
Size of family households - 3-person household (%)
Size of family households - 4-person household (%)
Size of family households - 5-person household (%)
Size of family households - 6-person household (%)
Size of family households - 7-or-more-person household (%)
Size of nonfamily households - 1-person household (%)
Size of nonfamily households - 2-person household (%)
Size of nonfamily households - 3-person household (%)
Size of nonfamily households - 4-person household (%)
Size of nonfamily households - 5-person household (%)
Size of nonfamily households - 6-person household (%)
Size of nonfamily households - 7-or-moreperson household (%)
Year house built - Built 2010 or later (%)
Year house built - Built 2000 to 2009 (%)
Year house built - Built 1990 to 1999 (%)
Year house built - Built 1980 to 1989 (%)
Year house built - Built 1970 to 1979 (%)
Year house built - Built 1960 to 1969 (%)
Year house built - Built 1950 to 1959 (%)
Year house built - Built 1940 to 1949 (%)
Year house built - Built 1939 or earlier (%)
Median number of rooms in houses and condos
Median number of rooms in apartments
Median number of bedrooms in owner occupied houses
Mean number of bedrooms in owner occupied houses
Median number of bedrooms in renter occupied houses
Mean number of bedrooms in renter occupied houses
Median number of vehichles in owner occupied houses
Mean number of vehichles in owner occupied houses
Median number of vehichles in renter occupied houses
Mean number of vehichles in renter occupied houses
Rooms in owner-occupied houses - 1 room (%)
Rooms in owner-occupied houses - 2 rooms (%)
Rooms in owner-occupied houses - 3 rooms (%)
Rooms in owner-occupied houses - 4 rooms (%)
Rooms in owner-occupied houses - 5 rooms (%)
Rooms in owner-occupied houses - 6 rooms (%)
Rooms in owner-occupied houses - 7 rooms (%)
Rooms in owner-occupied houses - 8 rooms (%)
Rooms in owner-occupied houses - 9+ rooms (%)
Rooms in renter-occupied houses - 1 room (%)
Rooms in renter-occupied houses - 2 rooms (%)
Rooms in renter-occupied houses - 3 rooms (%)
Rooms in renter-occupied houses - 4 rooms (%)
Rooms in renter-occupied houses - 5 rooms (%)
Rooms in renter-occupied houses - 6 rooms (%)
Rooms in renter-occupied houses - 7 rooms (%)
Rooms in renter-occupied houses - 8 rooms (%)
Rooms in renter-occupied houses - 9+ rooms (%)
Bedrooms in owner-occupied houses - no bedrooms (%)
Bedrooms in owner-occupied houses - 1 bedroom (%)
Bedrooms in owner-occupied houses - 2 bedrooms (%)
Bedrooms in owner-occupied houses - 3 bedrooms (%)
Bedrooms in owner-occupied houses - 4 bedrooms (%)
Bedrooms in owner-occupied houses - 5+ bedrooms (%)
Bedrooms in renter-occupied houses - no bedrooms (%)
Bedrooms in renter-occupied houses - 1 bedroom (%)
Bedrooms in renter-occupied houses - 2 bedrooms (%)
Bedrooms in renter-occupied houses - 3 bedrooms (%)
Bedrooms in renter-occupied houses - 4 bedrooms (%)
Bedrooms in renter-occupied houses - 5+ bedrooms (%)
Vehicles available in owner-occupied houses - no vehicle available (%)
Vehicles available in owner-occupied houses - 1 vehicle available(%)
Vehicles available in owner-occupied houses - 2 Vehicles available (%)
Vehicles available in owner-occupied houses - 3 Vehicles available (%)
Vehicles available in owner-occupied houses - 4 Vehicles available (%)
Vehicles available in owner-occupied houses - 5+ Vehicles available (%)
Vehicles available in renter-occupied houses - no vehicle available (%)
Vehicles available in renter-occupied houses - 1 vehicle available (%)
Vehicles available in renter-occupied houses - 2 Vehicles available (%)
Vehicles available in renter-occupied houses - 3 Vehicles available (%)
Vehicles available in renter-occupied houses - 4 Vehicles available (%)
Vehicles available in renter-occupied houses - 5+ Vehicles available (%)
Housing units in structures - 1, detached (%)
Housing units in structures - 1, attached (%)
Housing units in structures - 2 (%)
Housing units in structures - 3 or 4 (%)
Housing units in structures - 5 to 9 (%)
Housing units in structures - 10 to 19 (%)
Housing units in structures - 20 to 49 (%)
Housing units in structures - 50 or more (%)
Housing units in structures - Mobile home (%)
Housing units in structures - Boat, RV, van, etc. (%)
Housing units in structures - Owners - 1, detached (%)
Housing units in structures - Owners - 1, attached (%)
Housing units in structures - Owners - 2 (%)
Housing units in structures - Owners - 3 or 4 (%)
Housing units in structures - Owners - 5 to 9 (%)
Housing units in structures - Owners - 10 to 19 (%)
Housing units in structures - Owners - 20 to 49 (%)
Housing units in structures - Owners - 50 or more (%)
Housing units in structures - Owners - Mobile home (%)
Housing units in structures - Owners - Boat, RV, van, etc. (%)
Housing units in structures - Renters - 1, detached (%)
Housing units in structures - Renters - 1, attached (%)
Housing units in structures - Renters - 2 (%)
Housing units in structures - Renters - 3 or 4 (%)
Housing units in structures - Renters - 5 to 9 (%)
Housing units in structures - Renters - 10 to 19 (%)
Housing units in structures - Renters - 20 to 49 (%)
Housing units in structures - Renters - 50 or more (%)
Housing units in structures - Renters - Mobile home (%)
Housing units in structures - Renters - Boat, RV, van, etc. (%)
House/condo owner moved in on average (years ago)
Renter moved in on average (years ago)
Year householder moved into unit - Moved in 1999 to March 2000 (%)
Year householder moved into unit - Moved in 1999 to March 2000 (%) - White
Year householder moved into unit - Moved in 1999 to March 2000 (%) - Black or African American
Year householder moved into unit - Moved in 1999 to March 2000 (%) - Asian
Year householder moved into unit - Moved in 1999 to March 2000 (%) - Hispanic or Latino
Year householder moved into unit - Moved in 1999 to March 2000 (%) - American Indian and Alaska Native
Year householder moved into unit - Moved in 1999 to March 2000 (%) - Multirace
Year householder moved into unit - Moved in 1999 to March 2000 (%) - Other Race
Year householder moved into unit - Moved in 1995 to 1998 (%)
Year householder moved into unit - Moved in 1995 to 1998 (%) - White
Year householder moved into unit - Moved in 1995 to 1998 (%) - Black or African American
Year householder moved into unit - Moved in 1995 to 1998 (%) - Asian
Year householder moved into unit - Moved in 1995 to 1998 (%) - Hispanic or Latino
Year householder moved into unit - Moved in 1995 to 1998 (%) - American Indian and Alaska Native
Year householder moved into unit - Moved in 1995 to 1998 (%) - Multirace
Year householder moved into unit - Moved in 1995 to 1998 (%) - Other Race
Year householder moved into unit - Moved in 1990 to 1994 (%)
Year householder moved into unit - Moved in 1990 to 1994 (%) - White
Year householder moved into unit - Moved in 1990 to 1994 (%) - Black or African American
Year householder moved into unit - Moved in 1990 to 1994 (%) - Asian
Year householder moved into unit - Moved in 1990 to 1994 (%) - Hispanic or Latino
Year householder moved into unit - Moved in 1990 to 1994 (%) - American Indian and Alaska Native
Year householder moved into unit - Moved in 1990 to 1994 (%) - Multirace
Year householder moved into unit - Moved in 1990 to 1994 (%) - Other Race
Year householder moved into unit - Moved in 1980 to 1989 (%)
Year householder moved into unit - Moved in 1980 to 1989 (%) - White
Year householder moved into unit - Moved in 1980 to 1989 (%) - Black or African American
Year householder moved into unit - Moved in 1980 to 1989 (%) - Asian
Year householder moved into unit - Moved in 1980 to 1989 (%) - Hispanic or Latino
Year householder moved into unit - Moved in 1980 to 1989 (%) - American Indian and Alaska Native
Year householder moved into unit - Moved in 1980 to 1989 (%) - Multirace
Year householder moved into unit - Moved in 1980 to 1989 (%) - Other Race
Year householder moved into unit - Moved in 1970 to 1979 (%)
Year householder moved into unit - Moved in 1970 to 1979 (%) - White
Year householder moved into unit - Moved in 1970 to 1979 (%) - Black or African American
Year householder moved into unit - Moved in 1970 to 1979 (%) - Asian
Year householder moved into unit - Moved in 1970 to 1979 (%) - Hispanic or Latino
Year householder moved into unit - Moved in 1970 to 1979 (%) - American Indian and Alaska Native
Year householder moved into unit - Moved in 1970 to 1979 (%) - Multirace
Year householder moved into unit - Moved in 1970 to 1979 (%) - Other Race
Year householder moved into unit - Moved in 1969 or earlier (%)
Year householder moved into unit - Moved in 1969 or earlier (%) - White
Year householder moved into unit - Moved in 1969 or earlier (%) - Black or African American
Year householder moved into unit - Moved in 1969 or earlier (%) - Asian
Year householder moved into unit - Moved in 1969 or earlier (%) - Hispanic or Latino
Year householder moved into unit - Moved in 1969 or earlier (%) - American Indian and Alaska Native
Year householder moved into unit - Moved in 1969 or earlier (%) - Multirace
Year householder moved into unit - Moved in 1969 or earlier (%) - Other Race
Housing units lacking complete plumbing facilities (%)
Housing units lacking complete kitchen facilities (%)
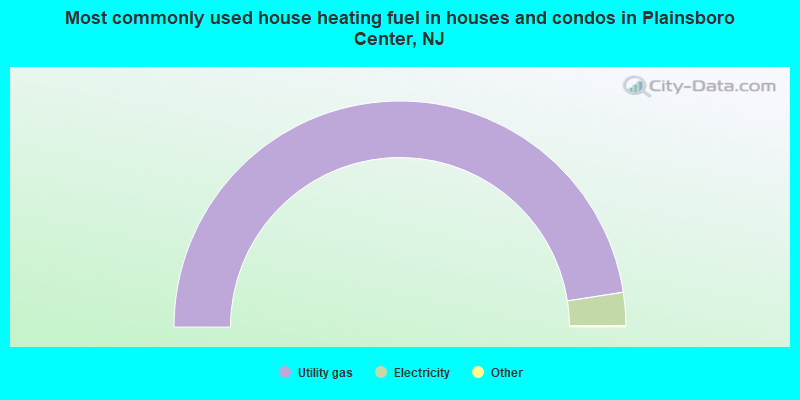
House heating fuel used in houses and condos - Utility gas (%)
House heating fuel used in houses and condos - Bottled, tank, or LP gas (%)
House heating fuel used in houses and condos - Electricity (%)
House heating fuel used in houses and condos - Fuel oil, kerosene, etc. (%)
House heating fuel used in houses and condos - Coal or coke (%)
House heating fuel used in houses and condos - Wood (%)
House heating fuel used in houses and condos - Solar energy (%)
House heating fuel used in houses and condos - Other fuel (%)
House heating fuel used in houses and condos - No fuel used (%)
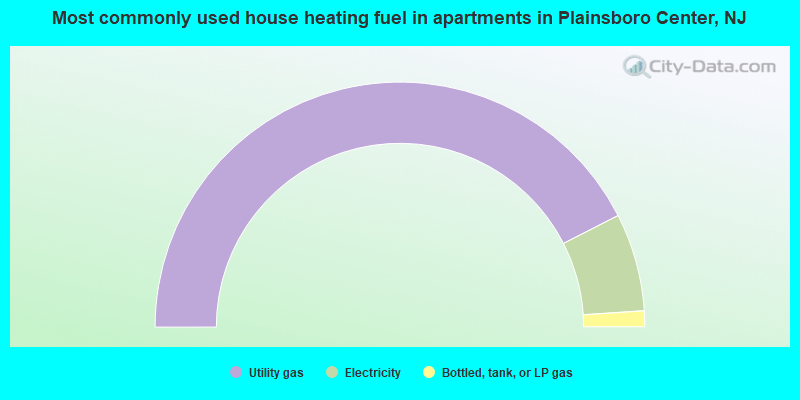
House heating fuel used in apartments - Utility gas (%)
House heating fuel used in apartments - Bottled, tank, or LP gas (%)
House heating fuel used in apartments - Electricity (%)
House heating fuel used in apartments - Fuel oil, kerosene, etc. (%)
House heating fuel used in apartments - Coal or coke (%)
House heating fuel used in apartments - Wood (%)
House heating fuel used in apartments - Solar energy (%)
House heating fuel used in apartments - Other fuel (%)
House heating fuel used in apartments - No fuel used (%)
Median year house/condo built: 1996Median year apartment built: 1977Household type by relationship:
Households: 2,770
Male householders: 967 (601 living alone ), Female householders: 490 (198 living alone )537 spouses (537 opposite-sex spouses ), 17 unmarried partners , (17 opposite-sex unmarried partners ), 598 children (574 natural , 24 adopted , 0 stepchildren ), 18 grandchildren , 17 brothers or sisters , 46 parents , 0 foster children , 16 other relatives , 61 non-relatives
Size of family households: 227 2-persons , 205 3-persons , 105 4-persons , 23 5-persons , 20 7-or-more-persons .
Size of nonfamily households: 813 1-person , 92 2-persons .
469 married couples with children. single-parent households (0 men , 35 women ).
51.4% of residents of Plainsboro Center speak English at home. of residents speak other Indo-European language at home (77% speak English very well , 23% speak English well ).of residents speak Asian or Pacific Island language at home (69% speak English very well , 31% speak English well ).
Foreign born population: 1,287 (46.5%)of them are naturalized citizens )
Median number of rooms in houses and condos:
Median number of rooms in apartments
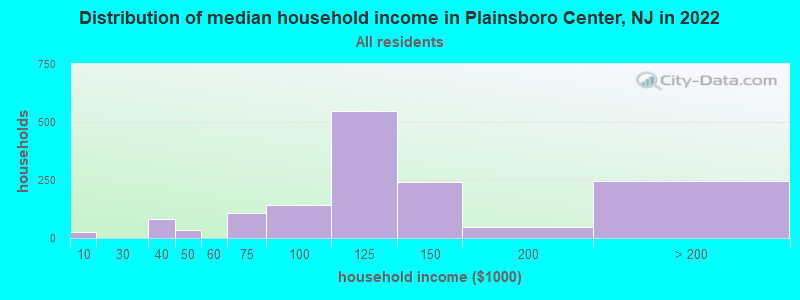
Plainsboro Center, NJ household income distribution 24 Less than $10,00080 $30,000 to $39,99936 $40,000 to $49,999109 $60,000 to $74,999144 $75,000 to $99,999546 $100,000 to $124,999241 $125,000 to $149,99948 $150,000 to $199,999246 $200,000 or more
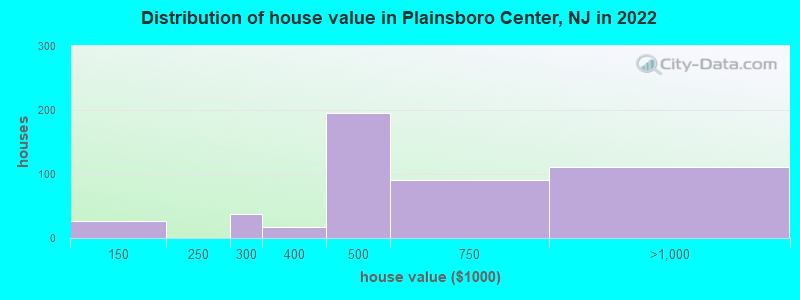
Home value of owner - occupied houses in 2022 in Plainsboro Center, NJ 27 $100,000 to $124,99938 $250,000 to $299,99917 $300,000 to $399,999195 $400,000 to $499,99990 $500,000 to $749,999111 $750,000 to $999,999Rent paid by renters in 2022 in Plainsboro Center, NJ 32 $1,000 to $1,249682 $1,500 to $1,999150 $2,000 to $2,49941 $2,500 to $2,99945 $3,500 or more27 No cash rent
Percentage of workers working in this county: 56.3%Number of people working at home: 674 (38.5% of all workers )
Travel time to work (commute)
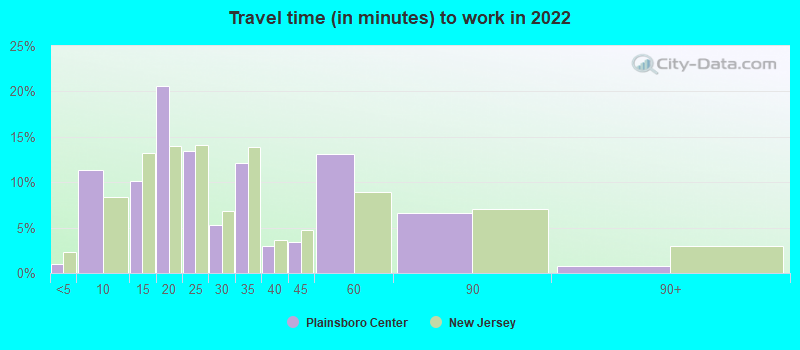
Less than 5 minutes: 195 to 9 minutes: 13510 to 14 minutes: 18715 to 19 minutes: 17320 to 24 minutes: 14925 to 29 minutes: 5930 to 34 minutes: 16435 to 39 minutes: 2640 to 44 minutes: 5845 to 59 minutes: 2460 to 89 minutes: 5490 or more minutes: 114
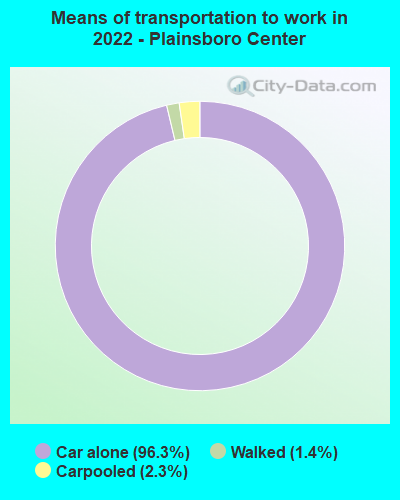
Means of transportation to work:
Drove a car alone: 1,113 (61.7%)Carpooled: 31 (1.7%)Walked: 23 (1.3%)Worked at home: 674 (37.3%)
Unemployment by race in 2022
Unemployment rate for Asian residents 12.2% Females
Year of entry for the foreign-born population in Plainsboro Center, New Jersey
676 2010 or later 408 2000 to 2009 132 1990 to 1999 254 1980 to 1989 63 1970 to 1979 60 Before 1970
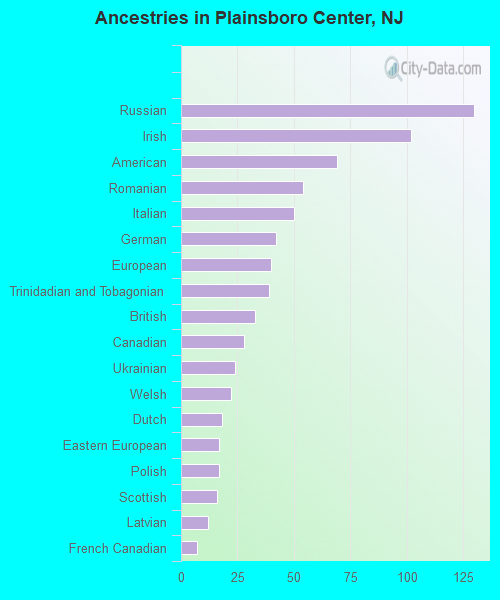
First ancestries reported:
Russian: 130 (6.3%)
Irish: 102 (5.0%)
American: 69 (3.4%)
Romanian: 54 (2.6%)
Italian: 50 (2.4%)
German: 42 (2.0%)
European: 40 (1.9%)
Trinidadian and Tobagonian: 39 (1.9%)
British: 33 (1.6%)
Canadian: 28 (1.4%)
Ukrainian: 24 (1.2%)
Welsh: 22 (1.1%)
Dutch: 18 (0.9%)
Eastern European: 17 (0.8%)
Polish: 17 (0.8%)
Scottish: 16 (0.8%)
Latvian: 12 (0.6%)
French Canadian: 7 (0.3%) Most common places of birth for foreign-born residents (%): India Plainsboro Center:
53.1% (665)New Jersey:
12.8% (274,609)
China, excluding Hong Kong and Taiwan Plainsboro Center:
9.3% (117)New Jersey:
3.7% (78,969)
Russia Plainsboro Center:
8.2% (103)New Jersey:
0.9% (20,371)
Korea Plainsboro Center:
5.7% (71)New Jersey:
3.3% (70,512)
Romania Plainsboro Center:
3.7% (46)New Jersey:
0.3% (6,033)
Trinidad and Tobago Plainsboro Center:
3.2% (40)New Jersey:
0.7% (15,533)
Taiwan Plainsboro Center:
2.3% (29)New Jersey:
0.7% (15,548)
England Plainsboro Center:
2.2% (27)New Jersey:
0.5% (10,886)
Belarus Plainsboro Center:
1.8% (23)New Jersey:
0.2% (4,579)
Netherlands Plainsboro Center:
1.5% (19)New Jersey:
0.1% (2,616)
Place of birth for U.S.-born residents:
This state: 628Other state: 883Northeast: 491Midwest: 325South: 91West: 0 84.7% of Plainsboro Center residents lived in the same house 1 years ago.
Out of people who lived in different houses, 19.8% lived in this county.
Out of people who lived in different counties, 38.7% lived in New Jersey.
Plainsboro Center:
84.7%State average:
90.4%
Education attainment for males 25 years and older:
No schooling: 0Nursery to 4th grade: 05th and 6th grade: 07th and 8th grade: 09th grade: 010th grade: 011th grade: 012th grade, no diploma: 17High school graduate (or equivalency): 48Less than 1 year of college: 14Some college more than 1 year, no degree: 7Associate degree: 38Bachelor's degree: 512Master's degree: 423Professional school degree: 0Doctorate degree: 228
Education attainment for females 25 years and older:
No schooling: 0Nursery to 4th grade: 05th and 6th grade: 07th and 8th grade: 09th grade: 010th grade: 011th grade: 012th grade, no diploma: 0High school graduate (or equivalency): 64Less than 1 year of college: 40Some college more than 1 year, no degree: 21Associate degree: 39Bachelor's degree: 276Master's degree: 277Professional school degree: 76Doctorate degree: 99
Housing units in structures:
One, detached: 334One, attached: 813 or 4: 2445 to 9: 42610 to 19: 28650 or more: 164House/condo owner moved in on average 11 years ago
Renter moved in on average 1 years ago
Private vs. public school enrollment:
Students in private schools in grades 1 to 8 (elementary and middle school): 0 Here:
0.0%New Jersey:
12.3%
Students in private schools in grades 9 to 12 (high school): 0 Here:
0.0%New Jersey:
13.1%
Students in private undergraduate colleges: 0 Here:
0.0%New Jersey:
33.2%