Pittsville, MD (Maryland) Houses and Residents
| Pittsville: | $223,161 |
| Maryland: | $398,100 |
Mean price in 2022:
Detached houses: $210,188
Here: $210,188 State: $526,819 Mobile homes: $58,818
Here: $58,818 State: $89,353
Total population: 1,421 (Urban population: 0, Rural population: 1,171 (8 farm, 1,163 nonfarm))
Houses: 965 (920 occupied: 745 owner occupied, 183 renter occupied)
| % of renters here: | 20% |
| State: | 32% |
Housing density: 553 houses/condos per square mile
Median price asked for vacant for-sale houses and condos in 2022 in this county: $234,338.
Median contract rent in 2022: $984 (lower quartile is $655, upper quartile is $1,240)
Median rent asked for vacant for-rent units in 2022: $455
Median gross rent in Pittsville, MD in 2022: $1,194
Housing units in Pittsville with a mortgage: 577 (29 second mortgage, 0 home equity loan, 19 both second mortgage and home equity loan)
Houses without a mortgage: 0
Median household income for houses/condos with a mortgage: $72,164
Median household income for apartments without a mortgage: $58,140
Median monthly housing costs: $1,261
Compare current foreclosures near Pittsville, MD:
| Photo | Address | Area | Beds / Baths | Price | Details |
|---|---|---|---|---|---|

|
#1
Gumboro Rd
Pittsville, MD 21850
|
912 sq. feet
|
1 baths - beds |
show details | |

|
#2
Railroad Ave
Pittsville, MD 21850
|
1,904 sq. feet
|
2 baths - beds |
show details | |

|
#3
Bracken Ct
Pittsville, MD 21850
|
- sq. feet
|
- baths - beds |
show details | |

|
#4
W Torquay Rd
Ocean City, MD 21842
|
1,456 sq. feet
|
2 baths 3 beds |
$459,900
|
show details |

|
#5
Forest Dr
Fruitland, MD 21826
|
1,638 sq. feet
|
2 baths 3 beds |
$340,000
|
show details |

|
#6
E Church St
Salisbury, MD 21804
|
1,615 sq. feet
|
3 baths 1 beds |
$219,900
|
show details |

|
#7
Seatick Rd
Eden, MD 21822
|
1,562 sq. feet
|
1 baths 4 beds |
show details | |

|
#8
West Rd
Salisbury, MD 21801
|
1,681 sq. feet
|
1 baths 3 beds |
show details | |

|
#9
Mount Hermon Rd
Parsonsburg, MD 21849
|
1,326 sq. feet
|
1 baths 3 beds |
show details | |

|
#10
Old Ocean City Rd
Parsonsburg, MD 21849
|
1,739 sq. feet
|
2 baths 3 beds |
show details |
| Photo | Address | Area | Beds / Baths | Price | Details |
|---|---|---|---|---|---|

|
#11
E East St
Delmar, MD 21875
|
1,838 sq. feet
|
1 baths - beds |
show details | |

|
#12
Chaplins Ct
Delmar, MD 21875
|
- sq. feet
|
2 baths 4 beds |
show details | |

|
#13
Tyler Ave
Salisbury, MD 21804
|
1,176 sq. feet
|
1 baths - beds |
show details | |

|
#14
Burnt Branch Dr
Salisbury, MD 21801
|
1,008 sq. feet
|
2 baths - beds |
show details | |

|
#15
Ebenezer Dr
Salisbury, MD 21801
|
940 sq. feet
|
1 baths - beds |
show details | |

|
#16
Hall Dr
Salisbury, MD 21804
|
1,146 sq. feet
|
1 baths - beds |
show details | |

|
#17
Windham Ct
Salisbury, MD 21804
|
1,500 sq. feet
|
1 baths - beds |
show details | |

|
#18
Kelvington Ave
Salisbury, MD 21801
|
1,232 sq. feet
|
1 baths - beds |
show details | |

|
#19
Center St
Laurel, DE 19956
|
1,200 sq. feet
|
- baths 4 beds |
show details | |

|
#20
Suffolk Ct
Salisbury, MD 21801
|
1,680 sq. feet
|
2 baths - beds |
show details |
| Photo | Address | Area | Beds / Baths | Price | Details |
|---|---|---|---|---|---|

|
#21
Liberty St
Berlin, MD 21811
|
1,832 sq. feet
|
2 baths - beds |
show details | |

|
#22
Jersey Rd
Salisbury, MD 21801
|
1,400 sq. feet
|
1 baths - beds |
show details | |

|
#23
Lake St
Salisbury, MD 21801
|
1,056 sq. feet
|
1 baths - beds |
show details | |

|
#24
Bueclar Dr
Salisbury, MD 21801
|
1,600 sq. feet
|
2 baths - beds |
show details | |

|
#25
Jersey Rd
Salisbury, MD 21801
|
1,893 sq. feet
|
2 baths - beds |
show details | |

|
#26
E Lincoln Ave
Salisbury, MD 21804
|
1,008 sq. feet
|
1 baths - beds |
show details | |

|
#27
Lakeside Dr
Salisbury, MD 21801
|
2,176 sq. feet
|
1 baths - beds |
show details | |

|
#28
Rockawalkin Rd
Hebron, MD 21830
|
1,421 sq. feet
|
2 baths - beds |
show details | |

|
#29
N Curlew Rd
Salisbury, MD 21801
|
1,872 sq. feet
|
2 baths - beds |
show details | |

|
#30
Naylor Mill Rd
Salisbury, MD 21801
|
1,344 sq. feet
|
1 baths - beds |
show details |
| Photo | Address | Area | Beds / Baths | Price | Details |
|---|---|---|---|---|---|

|
#31
Godwin School Rd
Millsboro, DE 19966
|
2,536 sq. feet
|
- baths 3 beds |
show details | |

|
#32
New York Ave
Salisbury, MD 21801
|
1,964 sq. feet
|
1 baths - beds |
show details | |

|
#33
Springfield Cir
Salisbury, MD 21804
|
1,120 sq. feet
|
1 baths - beds |
show details | |

|
#34
Shawnee Ave
Salisbury, MD 21801
|
992 sq. feet
|
1 baths - beds |
show details | |

|
#35
West Rd
Salisbury, MD 21801
|
1,218 sq. feet
|
1 baths - beds |
show details | |

|
#36
Pine Grove Rd
Laurel, DE 19956
|
1,863 sq. feet
|
- baths 3 beds |
show details | |

|
#37
Nentego Dr
Fruitland, MD 21826
|
1,752 sq. feet
|
2 baths - beds |
show details | |

|
#38
E Main St
Fruitland, MD 21826
|
1,830 sq. feet
|
1 baths - beds |
show details | |

|
#39
Oxbridge Dr
Salisbury, MD 21801
|
1,632 sq. feet
|
2 baths - beds |
show details | |

|
#40
Pemberton Dr
Salisbury, MD 21801
|
2,470 sq. feet
|
2 baths - beds |
show details |
| Photo | Address | Area | Beds / Baths | Price | Details |
|---|---|---|---|---|---|

|
#41
Gum Point Rd
Berlin, MD 21811
|
1,456 sq. feet
|
1 baths - beds |
show details | |

|
#42
Clyde Ave
Fruitland, MD 21826
|
840 sq. feet
|
1 baths - beds |
show details | |

|
#43
King Richard Rd
Berlin, MD 21811
|
1,804 sq. feet
|
2 baths - beds |
show details | |

|
#44
Rockawalkin Rd
Hebron, MD 21830
|
2,728 sq. feet
|
1 baths - beds |
show details | |

|
#45
Gordy Rd
Laurel, DE 19956
|
2,768 sq. feet
|
- baths 3 beds |
show details | |

|
#46
Algonquin Trl
Snow Hill, MD 21863
|
1,632 sq. feet
|
2 baths - beds |
show details | |

|
#47
Branch St
Berlin, MD 21811
|
1,392 sq. feet
|
2 baths - beds |
show details | |

|
#48
Johnson Dr
Salisbury, MD 21804
|
1,503 sq. feet
|
2 baths - beds |
show details | |

|
#49
Frederick Ave
Salisbury, MD 21801
|
1,704 sq. feet
|
1 baths - beds |
show details | |

|
Check over 1 million property listings on Foreclosure.com!
|
browse all offers | |||

Latest news about housing in Pittsville, MD collected exclusively by city-data.com from local newspapers, TV, and radio stations

 | ocean pines homes (13 replies) |
| Eastern Shore questions (40 replies) |
| Relocating From Louisiana to Salisbury Area (17 replies) |
| I am MISSING MY HOUSE AND TOWN !!!! Have to move to Harford County!!! UGH!!! (23 replies) |
| Eastern Shore-Cambridge, Easton, Salisbury (35 replies) |
| Pittsville Near OCEAN CITY,HAS ALOT TO OFFER (3 replies) |

Median year apartment built: 2002
Household type by relationship:
Households: 2,223- Male householders: 367 (215 living alone), Female householders: 552 (118 living alone)
332 spouses (328 opposite-sex spouses), 79 unmarried partners, (75 opposite-sex unmarried partners), 554 children (536 natural, 0 adopted, 18 stepchildren), 69 grandchildren, 29 brothers or sisters, 46 parents, 0 foster children, 54 other relatives, 136 non-relatives
Size of family households: 230 2-persons, 157 3-persons, 58 4-persons, 79 5-persons, 30 7-or-more-persons.
Size of nonfamily households: 306 1-person, 39 2-persons, 5 3-persons.
276 married couples with children.
154 single-parent households (48 men, 106 women).
89.3% of residents of Pittsville speak English at home.
9.7% of residents speak Spanish at home (98% speak English very well, 2% speak English well).
1.2% of residents speak Asian or Pacific Island language at home (32% speak English very well, 68% speak English well).
Foreign born population: 69 (3.1%)
(43.5% of them are naturalized citizens)
| Here: | 6.3 |
| State: | 7.3 |
| Here: | 4.2 |
| State: | 4.2 |

- Bedrooms in owner-occupied houses and condos in Pittsville, Maryland
- 2no bedroom
- 31 bedroom
- 652 bedrooms
- 5413 bedrooms
- 994 bedrooms
- 365+ bedrooms

- Bedrooms in renter-occupied apartments in Pittsville, Maryland
- 0no bedroom
- 371 bedroom
- 722 bedrooms
- 683 bedrooms
- 64 bedrooms
- 05+ bedrooms

- Cars and other vehicles available in Pittsville in owner-occupied houses/condos
- 4no vehicle
- 2741 vehicle
- 2132 vehicles
- 1673 vehicles
- 434 vehicles
- 465+ vehicles

- Cars and other vehicles available in Pittsville in renter-occupied apartments
- 36no vehicle
- 951 vehicle
- 462 vehicles
- 33 vehicles
- 44 vehicles
- 05+ vehicles

- Rooms in owner-occupied houses in Pittsville, Maryland
- 21 room
- 02 rooms
- 63 rooms
- 844 rooms
- 1575 rooms
- 2346 rooms
- 1117 rooms
- 508 rooms
- 1029+ rooms

- Rooms in renter-occupied apartments in Pittsville, Maryland
- 01 room
- 62 rooms
- 333 rooms
- 554 rooms
- 575 rooms
- 226 rooms
- 47 rooms
- 68 rooms
- 09+ rooms


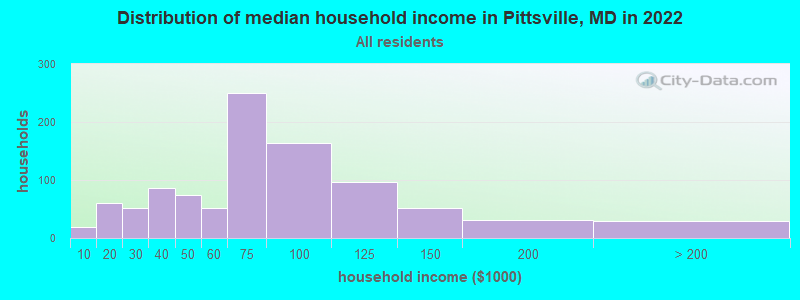
Pittsville, MD household income distribution

- 19Less than $10,000
- 60$10,000 to $19,999
- 51$20,000 to $29,999
- 86$30,000 to $39,999
- 75$40,000 to $49,999
- 52$50,000 to $59,999
- 250$60,000 to $74,999
- 164$75,000 to $99,999
- 96$100,000 to $124,999
- 52$125,000 to $149,999
- 31$150,000 to $199,999
- 29$200,000 or more
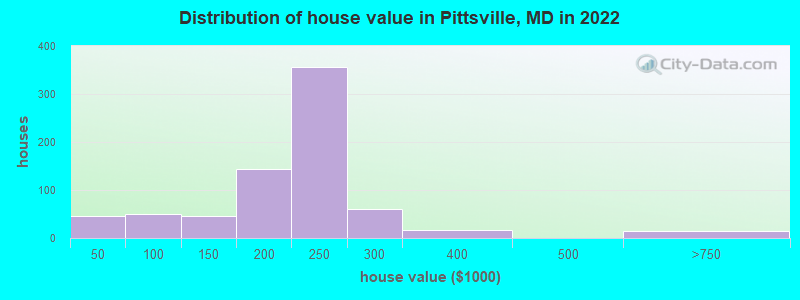
Home value of owner - occupied houses in 2022 in Pittsville, MD
-
- 2$10,000 to $14,999
- 20$20,000 to $24,999
- 4$30,000 to $34,999
- 14$35,000 to $39,999
- 2$40,000 to $49,999
- 5$50,000 to $59,999
- 19$60,000 to $69,999
- 2$70,000 to $79,999
- 12$80,000 to $89,999
- 7$90,000 to $99,999
- 20$100,000 to $124,999
- 25$125,000 to $149,999
- 123$150,000 to $174,999
- 20$175,000 to $199,999
- 356$200,000 to $249,999
- 60$250,000 to $299,999
- 15$300,000 to $399,999
- 14$500,000 to $749,999
Rent paid by renters in 2022 in Pittsville, MD
-
- 7Less than $100
- 11$150 to $199
- 1$250 to $299
- 2$450 to $499
- 40$600 to $649
- 8$650 to $699
- 16$700 to $749
- 4$800 to $899
- 14$900 to $999
- 42$1,000 to $1,249
- 29$1,250 to $1,499
- 18No cash rent


Percentage of workers working in this county: 54.1%
Number of people working at home: 40 (3.5% of all workers)
Travel time to work (commute)
- Less than 5 minutes: 24
- 5 to 9 minutes: 57
- 10 to 14 minutes: 35
- 15 to 19 minutes: 214
- 20 to 24 minutes: 286
- 25 to 29 minutes: 108
- 30 to 34 minutes: 218
- 35 to 39 minutes: 16
- 40 to 44 minutes: 40
- 45 to 59 minutes: 37
- 60 to 89 minutes: 18
- 90 or more minutes: 34
Means of transportation to work:
- Drove a car alone: 490 (82.8%)
- Carpooled: 75 (12.7%)
- Bus or trolley bus: 1 (0.2%)
- Walked: 9 (1.5%)
- Worked at home: 17 (2.9%)

- Unemployment by race in 2022
- Unemployment rate for White non-Hispanic residents
- 3.0%Males
- 1.8%Females

- Year of entry for the foreign-born population in Pittsville, Maryland
- 02010 or later
- 92000 to 2009
- 511990 to 1999
- 41980 to 1989
- 21970 to 1979
- 2Before 1970
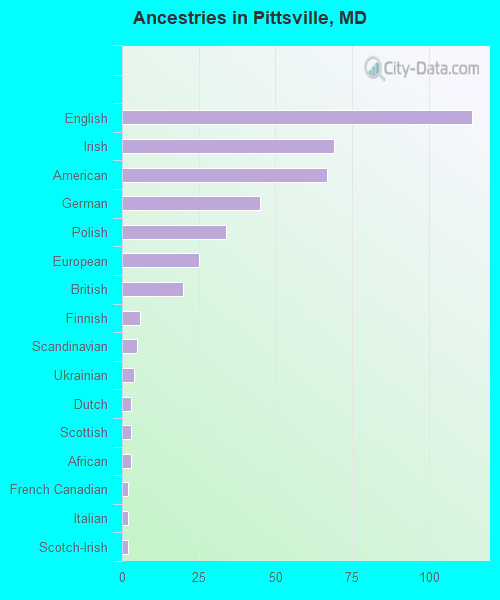
First ancestries reported:
- English: 114 (15.0%)
- Irish: 69 (9.1%)
- American: 67 (8.8%)
- German: 45 (5.9%)
- Polish: 34 (4.5%)
- European: 25 (3.3%)
- British: 20 (2.6%)
- Finnish: 6 (0.8%)
- Scandinavian: 5 (0.7%)
- Ukrainian: 4 (0.5%)
- Dutch: 3 (0.4%)
- Scottish: 3 (0.4%)
- African: 3 (0.4%)
- French Canadian: 2 (0.3%)
- Italian: 2 (0.3%)
- Scotch-Irish: 2 (0.3%)
Most common places of birth for foreign-born residents (%):
| Pittsville: | 34.2% (27) |
| Maryland: | 0.9% (8,603) |
| Pittsville: | 31.6% (25) |
| Maryland: | 3.4% (32,635) |
| Pittsville: | 8.9% (7) |
| Maryland: | 1.2% (11,265) |
| Pittsville: | 3.8% (3) |
| Maryland: | 1.3% (12,898) |
| Pittsville: | 2.5% (2) |
| Maryland: | 0.2% (1,714) |
| Pittsville: | 2.5% (2) |
| Maryland: | 12.0% (115,412) |
Place of birth for U.S.-born residents:
- This state: 1,553
- Other state: 584
- Northeast: 304
- Midwest: 20
- South: 229
- West: 40
88.0% of Pittsville residents lived in the same house 1 years ago.
Out of people who lived in different houses, 30.5% lived in this county.
Out of people who lived in different counties, 53.6% lived in Maryland.
| Pittsville: | 88.0% |
| State average: | 88.5% |
Education attainment for males 25 years and older:
- No schooling: 1
- Nursery to 4th grade: 0
- 5th and 6th grade: 0
- 7th and 8th grade: 24
- 9th grade: 50
- 10th grade: 20
- 11th grade: 1
- 12th grade, no diploma: 18
- High school graduate (or equivalency): 372
- Less than 1 year of college: 66
- Some college more than 1 year, no degree: 62
- Associate degree: 21
- Bachelor's degree: 83
- Master's degree: 0
- Professional school degree: 1
- Doctorate degree: 0

Education attainment for females 25 years and older:
- No schooling: 6
- Nursery to 4th grade: 0
- 5th and 6th grade: 0
- 7th and 8th grade: 4
- 9th grade: 10
- 10th grade: 3
- 11th grade: 54
- 12th grade, no diploma: 4
- High school graduate (or equivalency): 384
- Less than 1 year of college: 102
- Some college more than 1 year, no degree: 57
- Associate degree: 84
- Bachelor's degree: 47
- Master's degree: 7
- Professional school degree: 0
- Doctorate degree: 24


Housing units in structures:
- One, detached: 739
- One, attached: 11
- Two: 6
- 3 or 4: 7
- 5 to 9: 29
- 10 to 19: 20
- 20 to 49: 17
- Mobile homes: 136
Median worth of mobile homes: $51,914
Housing units lacking complete kitchen facilities in 2022: 0.7%
House/condo owner moved in on average 16 years ago
Renter moved in on average 2 years ago

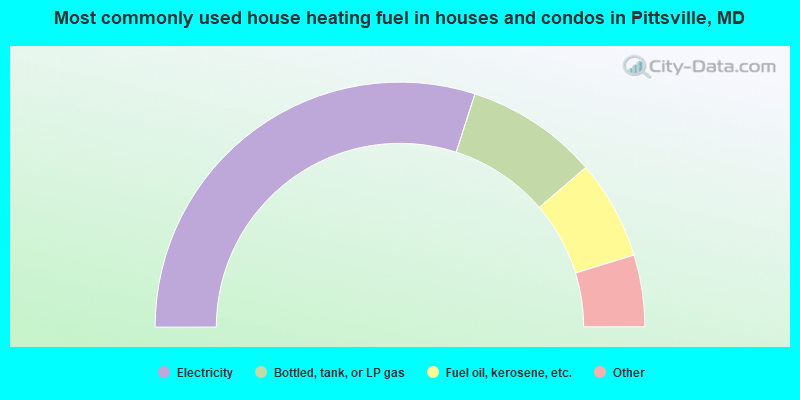
- 60.0%Electricity
- 17.5%Bottled, tank, or LP gas
- 13.1%Fuel oil, kerosene, etc.
- 3.5%Solar energy
- 2.3%Utility gas
- 2.0%Wood
- 1.2%Other fuel
- 0.3%No fuel used
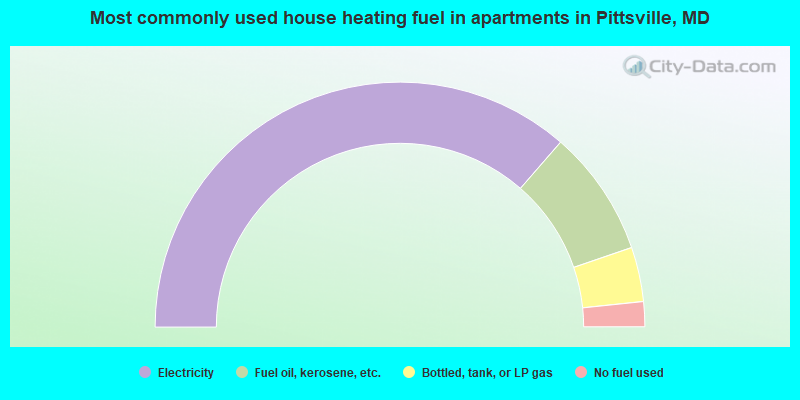
- 72.8%Electricity
- 16.7%Fuel oil, kerosene, etc.
- 7.2%Bottled, tank, or LP gas
- 3.3%No fuel used
Private vs. public school enrollment:
| Here: | 19.7% |
| Maryland: | 15.2% |
| Here: | 18.8% |
| Maryland: | 14.4% |
| Here: | 26.9% |
| Maryland: | 20.2% |


