Pittsfield, MA (Massachusetts) Houses and Residents
| Pittsfield: | $253,727 |
| Massachusetts: | $534,700 |
Mean price in 2022:
Detached houses: $279,301
Here: $279,301 State: $651,570 Townhouses or other attached units: $523,409
Here: $523,409 State: $617,749 In 2-unit structures: $236,124
Here: $236,124 State: $594,808 In 3-to-4-unit structures: $281,771
Here: $281,771 State: $601,912 In 5-or-more-unit structures: $126,475
Here: $126,475 State: $555,768 Mobile homes: $53,699
Here: $53,699 State: $170,209
Total population: 43,697 (All urban)
Houses: 21,401 (19,343 occupied: 12,331 owner occupied, 7,692 renter occupied)
| % of renters here: | 38% |
| State: | 38% |
Housing density: 525 houses/condos per square mile
Median price asked for vacant for-sale houses and condos in 2022: $703,661.
Median contract rent in 2022: $838 (lower quartile is $602, upper quartile is $1,099)
Median rent asked for vacant for-rent units in 2022: $2,263
Median gross rent in Pittsfield, MA in 2022: $991
Housing units in Pittsfield with a mortgage: 7,801 (1,598 second mortgage, 31 home equity loan, 1,420 both second mortgage and home equity loan)
Houses without a mortgage: 610
Median household income for houses/condos with a mortgage: $101,452
Median household income for apartments without a mortgage: $81,119
Median monthly housing costs: $1,188
Compare current foreclosures in Pittsfield, MA:
| Photo | Address | Area | Beds / Baths | Price | Details |
|---|---|---|---|---|---|

|
#1
Robbins Ave
Pittsfield, MA 01201
|
1,872 sq. feet
|
2 baths 4 beds |
show details | |

|
#2
Circular Ave
Pittsfield, MA 01201
|
2,808 sq. feet
|
4 baths 8 beds |
show details | |

|
#3
Weller Ave
Pittsfield, MA 01201
|
3,376 sq. feet
|
3 baths 6 beds |
show details | |

|
#4
Madison Ave
Pittsfield, MA 01201
|
2,192 sq. feet
|
2 baths 6 beds |
show details | |

|
#5
Daniels Ave
Pittsfield, MA 01201
|
3,040 sq. feet
|
3 baths 6 beds |
show details | |

|
#6
North St
Pittsfield, MA 01201
|
1,661 sq. feet
|
2 baths 4 beds |
show details | |

|
#7
Tierney Pl
Pittsfield, MA 01201
|
1,103 sq. feet
|
1 baths 3 beds |
show details | |

|
#8
Imperial Ave
Pittsfield, MA 01201
|
1,326 sq. feet
|
1 baths 3 beds |
show details | |

|
#9
Williams St
Pittsfield, MA 01201
|
1,245 sq. feet
|
1 baths 3 beds |
show details | |

|
#10
Marshall Ave
Pittsfield, MA 01201
|
1,517 sq. feet
|
1 baths 3 beds |
show details |
| Photo | Address | Area | Beds / Baths | Price | Details |
|---|---|---|---|---|---|

|
#11
Elberon Ave
Pittsfield, MA 01201
|
1,794 sq. feet
|
1 baths 4 beds |
show details | |

|
#12
Anita Dr
Pittsfield, MA 01201
|
1,504 sq. feet
|
2 baths 3 beds |
show details | |

|
#13
Davis St
Pittsfield, MA 01201
|
1,456 sq. feet
|
2 baths 3 beds |
show details | |

|
#14
Joseph Dr
Pittsfield, MA 01201
|
1,248 sq. feet
|
1 baths 3 beds |
show details | |

|
#15
Briggs Ave
Pittsfield, MA 01201
|
2,116 sq. feet
|
2 baths 4 beds |
show details | |

|
#16
Lenox Ave
Pittsfield, MA 01201
|
1,376 sq. feet
|
1 baths 3 beds |
show details | |

|
#17
West St
Pittsfield, MA 01201
|
2,018 sq. feet
|
1 baths 3 beds |
show details | |

|
#18
West St
Pittsfield, MA 01201
|
1,714 sq. feet
|
1 baths 4 beds |
show details | |

|
#19
Mcarthur St
Pittsfield, MA 01201
|
1,155 sq. feet
|
1 baths 2 beds |
show details | |

|
#20
Lenox Ave
Pittsfield, MA 01201
|
2,290 sq. feet
|
2 baths 6 beds |
show details |
| Photo | Address | Area | Beds / Baths | Price | Details |
|---|---|---|---|---|---|

|
#21
Summit Ave
Pittsfield, MA 01201
|
1,664 sq. feet
|
2 baths 4 beds |
show details | |

|
#22
Daniels Ave
Pittsfield, MA 01201
|
1,172 sq. feet
|
1 baths 3 beds |
show details | |

|
#23
Kathy Way
Pittsfield, MA 01201
|
2,136 sq. feet
|
2 baths 3 beds |
show details | |

|
#24
Hancock Rd
Pittsfield, MA 01201
|
1,344 sq. feet
|
2 baths 3 beds |
show details | |

|
#25
Crystal St
Pittsfield, MA 01201
|
1,282 sq. feet
|
1 baths 3 beds |
show details | |

|
#26
Longfellow Ave
Pittsfield, MA 01201
|
1,356 sq. feet
|
1 baths 4 beds |
show details | |

|
#27
Donovan St
Pittsfield, MA 01201
|
1,652 sq. feet
|
2 baths 3 beds |
show details | |

|
#28
Garfield Ave
Pittsfield, MA 01201
|
2,432 sq. feet
|
2 baths 4 beds |
show details | |

|
#29
Hull Ave
Pittsfield, MA 01201
|
- sq. feet
|
- baths - beds |
show details | |

|
#30
Fenn St
Pittsfield, MA 01201
|
- sq. feet
|
- baths - beds |
show details |
| Photo | Address | Area | Beds / Baths | Price | Details |
|---|---|---|---|---|---|

|
#31
Tyler St
Pittsfield, MA 01201
|
- sq. feet
|
- baths - beds |
show details | |

|
#32
Highview Dr Apt C
Pittsfield, MA 01201
|
- sq. feet
|
- baths - beds |
show details | |

|
Check over 1 million property listings on Foreclosure.com!
|
browse all offers | |||

Latest news about housing in Pittsfield, MA collected exclusively by city-data.com from local newspapers, TV, and radio stations

 | How Much Massachusetts Households Make Per Year: Census Data (37 replies) |
| 2022 Real Estate Observations (1122 replies) |
| What Pittsfield area like ? (44 replies) |
| 2021 Real Estate Observations (1729 replies) |
| Under $250k any Massachusetts single family house with yard (117 replies) |
| When is the insanity going to end? There has to be a real estate market crash, right? (99 replies) |

Median year apartment built: 1952
Household type by relationship:
Households: 43,422- Male householders: 8,604 (2,918 living alone), Female householders: 10,497 (3,681 living alone)
7,439 spouses (7,256 opposite-sex spouses), 1,963 unmarried partners, (1,919 opposite-sex unmarried partners), 11,066 children (10,345 natural, 272 adopted, 448 stepchildren), 747 grandchildren, 294 brothers or sisters, 274 parents, 22 foster children, 355 other relatives, 1,096 non-relatives
- In group quarters: 1,060
Size of family households: 6,294 2-persons, 2,933 3-persons, 1,553 4-persons, 568 5-persons, 196 6-persons, 54 7-or-more-persons.
Size of nonfamily households: 6,467 1-person, 1,886 2-persons, 133 3-persons, 49 4-persons, 12 6-persons.
3,715 married couples with children.
2,990 single-parent households (683 men, 2,307 women).
90.3% of residents of Pittsfield speak English at home.
5.1% of residents speak Spanish at home (71% speak English very well, 10% speak English well, 12% speak English not well, 6% don't speak English at all).
2.2% of residents speak other Indo-European language at home (77% speak English very well, 11% speak English well, 12% speak English not well).
0.7% of residents speak Asian or Pacific Island language at home (70% speak English very well, 26% speak English well, 4% speak English not well).
1.4% of residents speak other language at home (85% speak English very well, 15% speak English well).
Foreign born population: 3,278 (7.5%)
(50.9% of them are naturalized citizens)
| Here: | 6.5 |
| State: | 6.5 |
| Here: | 4.2 |
| State: | 4.0 |

- Bedrooms in owner-occupied houses and condos in Pittsfield, Massachusetts
- 21no bedroom
- 2941 bedroom
- 2,3702 bedrooms
- 7,0913 bedrooms
- 2,0524 bedrooms
- 5045+ bedrooms

- Bedrooms in renter-occupied apartments in Pittsfield, Massachusetts
- 338no bedroom
- 2,6111 bedroom
- 3,0732 bedrooms
- 1,3513 bedrooms
- 2474 bedrooms
- 735+ bedrooms

- Cars and other vehicles available in Pittsfield in owner-occupied houses/condos
- 521no vehicle
- 3,8481 vehicle
- 5,7862 vehicles
- 1,7183 vehicles
- 2564 vehicles
- 2015+ vehicles

- Cars and other vehicles available in Pittsfield in renter-occupied apartments
- 2,312no vehicle
- 4,0921 vehicle
- 1,0562 vehicles
- 1963 vehicles
- 244 vehicles
- 125+ vehicles

- Rooms in owner-occupied houses in Pittsfield, Massachusetts
- 211 room
- 192 rooms
- 1413 rooms
- 7034 rooms
- 2,4605 rooms
- 3,7536 rooms
- 2,1617 rooms
- 1,5428 rooms
- 1,5339+ rooms

- Rooms in renter-occupied apartments in Pittsfield, Massachusetts
- 3021 room
- 5532 rooms
- 1,6343 rooms
- 2,0604 rooms
- 1,7275 rooms
- 7966 rooms
- 3617 rooms
- 1218 rooms
- 1389+ rooms


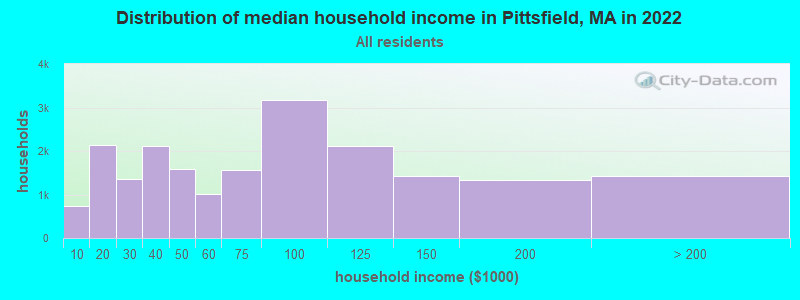
Pittsfield, MA household income distribution

- 738Less than $10,000
- 2,142$10,000 to $19,999
- 1,366$20,000 to $29,999
- 2,121$30,000 to $39,999
- 1,582$40,000 to $49,999
- 1,020$50,000 to $59,999
- 1,574$60,000 to $74,999
- 3,173$75,000 to $99,999
- 2,114$100,000 to $124,999
- 1,435$125,000 to $149,999
- 1,327$150,000 to $199,999
- 1,425$200,000 or more
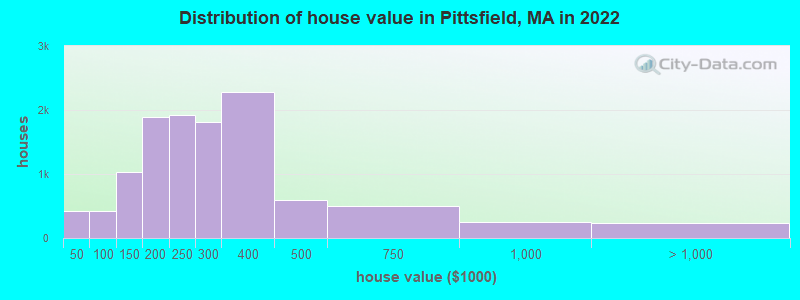
Home value of owner - occupied houses in 2022 in Pittsfield, MA
-
- 147Less than $10,000
- 30$10,000 to $14,999
- 53$15,000 to $19,999
- 64$20,000 to $24,999
- 15$25,000 to $29,999
- 41$30,000 to $34,999
- 64$40,000 to $49,999
- 94$50,000 to $59,999
- 57$70,000 to $79,999
- 119$80,000 to $89,999
- 81$90,000 to $99,999
- 423$100,000 to $124,999
- 607$125,000 to $149,999
- 945$150,000 to $174,999
- 937$175,000 to $199,999
- 1,914$200,000 to $249,999
- 1,813$250,000 to $299,999
- 2,288$300,000 to $399,999
- 587$400,000 to $499,999
- 495$500,000 to $749,999
- 252$750,000 to $999,999
- 101$1,000,000 to $1,499,999
- 72$1,500,000 to $1,999,999
- 58$2,000,000 or more
Rent paid by renters in 2022 in Pittsfield, MA
-
- 65Less than $100
- 108$100 to $149
- 105$150 to $199
- 106$200 to $249
- 191$250 to $299
- 117$300 to $349
- 185$350 to $399
- 249$400 to $449
- 68$450 to $499
- 252$500 to $549
- 122$550 to $599
- 102$600 to $649
- 158$650 to $699
- 350$700 to $749
- 414$750 to $799
- 1,766$800 to $899
- 451$900 to $999
- 1,085$1,000 to $1,249
- 376$1,250 to $1,499
- 359$1,500 to $1,999
- 238$2,000 to $2,499
- 68$2,500 to $2,999
- 17$3,000 to $3,499
- 17$3,500 or more
- 169No cash rent


Percentage of workers working in this county: 94.6%
Number of people working at home: 1,753 (8.2% of all workers)
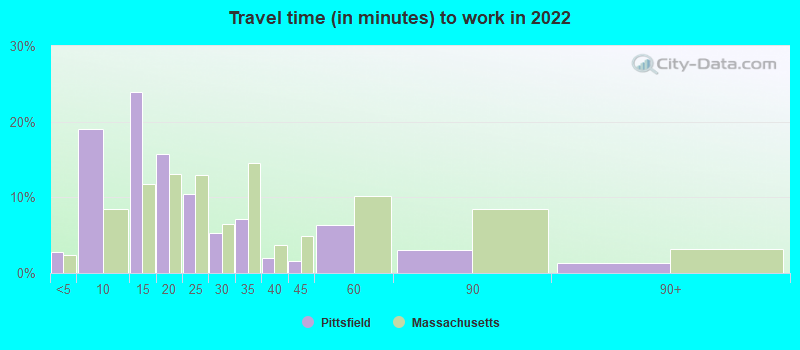
Travel time to work (commute)
- Less than 5 minutes: 586
- 5 to 9 minutes: 4,464
- 10 to 14 minutes: 5,625
- 15 to 19 minutes: 3,442
- 20 to 24 minutes: 1,871
- 25 to 29 minutes: 492
- 30 to 34 minutes: 605
- 35 to 39 minutes: 236
- 40 to 44 minutes: 122
- 45 to 59 minutes: 1,066
- 60 to 89 minutes: 558
- 90 or more minutes: 404
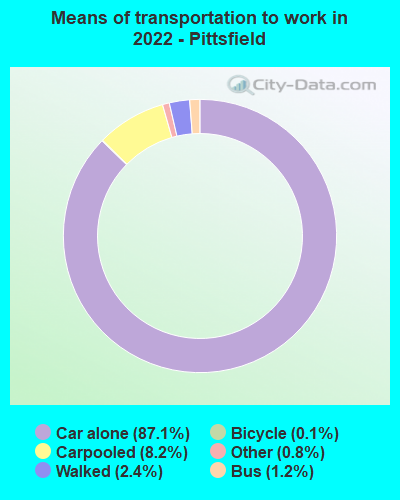
Means of transportation to work:
- Drove a car alone: 20,645 (79.3%)
- Carpooled: 2,046 (7.9%)
- Bus: 272 (1.0%)
- Subway or elevated rail: 11 (0.0%)
- Light rail, streetcar or trolley: 13 (0.0%)
- Taxi: 236 (0.9%)
- Bicycle: 26 (0.1%)
- Walked: 551 (2.1%)
- Worked at home: 1,753 (6.7%)

- Unemployment by race in 2022
- Unemployment rate for White non-Hispanic residents
- 10.1%Males
- 4.5%Females
- Unemployment rate for Black residents
- 8.0%Males
- 7.5%Females
- Unemployment rate for American Indian and Alaska Native residents
- 14.7%Males
- Unemployment rate for other race residents
- 6.6%Males
- Unemployment rate for two or more race residents
- 2.3%Females
- Unemployment rate for Hispanic or Latino residents
- 3.0%Males
- 6.1%Females

- Year of entry for the foreign-born population in Pittsfield, Massachusetts
- 1,1712010 or later
- 6512000 to 2009
- 4291990 to 1999
- 1951980 to 1989
- 2411970 to 1979
- 686Before 1970

First ancestries reported:
- Italian: 2,686 (14.6%)
- Irish: 2,340 (12.8%)
- American: 1,875 (10.2%)
- English: 1,366 (7.4%)
- German: 822 (4.5%)
- Polish: 659 (3.6%)
- French Canadian: 511 (2.8%)
- French: 381 (2.1%)
- African: 229 (1.2%)
- European: 198 (1.1%)
- Greek: 195 (1.1%)
- Scottish: 169 (0.9%)
- Eastern European: 150 (0.8%)
- Ghanaian: 140 (0.8%)
- Russian: 106 (0.6%)
- Scotch-Irish: 75 (0.4%)
- British: 59 (0.3%)
- Northern European: 51 (0.3%)
- Portuguese: 47 (0.3%)
- Slovak: 42 (0.2%)
- Canadian: 40 (0.2%)
- Czech: 37 (0.2%)
- Serbian: 35 (0.2%)
- South African: 32 (0.2%)
- Danish: 31 (0.2%)
- Welsh: 31 (0.2%)
- Swedish: 30 (0.2%)
- Trinidadian and Tobagonian: 29 (0.2%)
- Czechoslovakian: 28 (0.2%)
- Ukrainian: 26 (0.1%)
- Romanian: 25 (0.1%)
- Finnish: 22 (0.1%)
- Moroccan: 19 (0.1%)
- Austrian: 17 (0.09%)
- Cape Verdean: 16 (0.09%)
- Dutch: 15 (0.08%)
- Swiss: 13 (0.07%)
- Lebanese: 12 (0.07%)
- Turkish: 12 (0.07%)
- Cajun: 6 (0.03%)
- Scandinavian: 4 (0.02%)
- Armenian: 2 (0.01%)
Most common places of birth for foreign-born residents (%):
| Pittsfield: | 19.9% (609) |
| Massachusetts: | 1.0% (12,327) |
| Pittsfield: | 6.6% (201) |
| Massachusetts: | 0.6% (7,349) |
| Pittsfield: | 5.4% (164) |
| Massachusetts: | 3.7% (45,667) |
| Pittsfield: | 4.8% (147) |
| Massachusetts: | 6.8% (82,934) |
| Pittsfield: | 4.6% (140) |
| Massachusetts: | 2.3% (27,810) |
| Pittsfield: | 3.8% (117) |
| Massachusetts: | 2.3% (28,158) |
| Pittsfield: | 3.5% (107) |
| Massachusetts: | 1.0% (12,529) |
| Pittsfield: | 3.1% (96) |
| Massachusetts: | 8.3% (101,767) |
| Pittsfield: | 3.1% (96) |
| Massachusetts: | 1.0% (12,709) |
| Pittsfield: | 3.1% (95) |
| Massachusetts: | 0.1% (1,635) |
| Pittsfield: | 2.7% (83) |
| Massachusetts: | 1.1% (13,065) |
| Pittsfield: | 2.7% (82) |
| Massachusetts: | 1.5% (18,278) |
| Pittsfield: | 2.5% (77) |
| Massachusetts: | 1.0% (11,727) |
| Pittsfield: | 2.5% (76) |
| Massachusetts: | 0.8% (10,043) |
| Pittsfield: | 2.4% (74) |
| Massachusetts: | 0.5% (5,553) |
| Pittsfield: | 2.1% (64) |
| Massachusetts: | 0.7% (8,562) |
| Pittsfield: | 1.8% (55) |
| Massachusetts: | 1.4% (16,886) |
| Pittsfield: | 1.7% (51) |
| Massachusetts: | 0.1% (1,277) |
| Pittsfield: | 1.6% (49) |
| Massachusetts: | 0.9% (10,808) |
| Pittsfield: | 1.5% (46) |
| Massachusetts: | 0.3% (4,128) |
Place of birth for U.S.-born residents:
- This state: 27,995
- Other state: 10,985
- Northeast: 6,512
- Midwest: 1,367
- South: 2,312
- West: 837
91.2% of Pittsfield residents lived in the same house 1 years ago.
Out of people who lived in different houses, 37.5% lived in this county.
Out of people who lived in different counties, 26.9% lived in Massachusetts.
| Pittsfield: | 91.2% |
| State average: | 87.7% |
Education attainment for males 25 years and older:
- No schooling: 409
- Nursery to 4th grade: 14
- 5th and 6th grade: 31
- 7th and 8th grade: 89
- 9th grade: 44
- 10th grade: 157
- 11th grade: 566
- 12th grade, no diploma: 301
- High school graduate (or equivalency): 4,940
- Less than 1 year of college: 1,005
- Some college more than 1 year, no degree: 2,565
- Associate degree: 703
- Bachelor's degree: 3,326
- Master's degree: 1,432
- Professional school degree: 490
- Doctorate degree: 312

Education attainment for females 25 years and older:
- No schooling: 148
- Nursery to 4th grade: 9
- 5th and 6th grade: 108
- 7th and 8th grade: 70
- 9th grade: 45
- 10th grade: 256
- 11th grade: 161
- 12th grade, no diploma: 237
- High school graduate (or equivalency): 4,551
- Less than 1 year of college: 938
- Some college more than 1 year, no degree: 2,315
- Associate degree: 1,861
- Bachelor's degree: 3,546
- Master's degree: 2,086
- Professional school degree: 219
- Doctorate degree: 155


Housing units in structures:
- One, detached: 11,119
- One, attached: 866
- Two: 2,890
- 3 or 4: 2,581
- 5 to 9: 1,475
- 10 to 19: 1,141
- 20 to 49: 580
- 50 or more: 537
- Mobile homes: 208
Median worth of mobile homes: $36,969
Housing units lacking complete kitchen facilities in 2022: 1.4%
House/condo owner moved in on average 16 years ago
Renter moved in on average 3 years ago

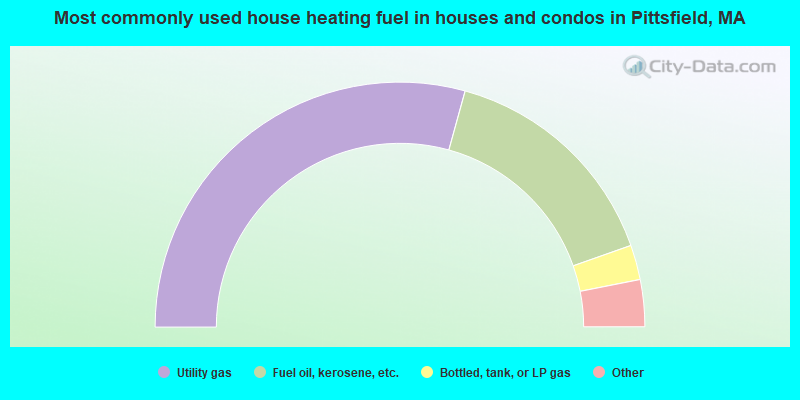
- 57.8%Utility gas
- 31.0%Fuel oil, kerosene, etc.
- 4.3%Bottled, tank, or LP gas
- 4.3%Electricity
- 1.6%Wood
- 0.7%Other fuel
- 0.3%Solar energy
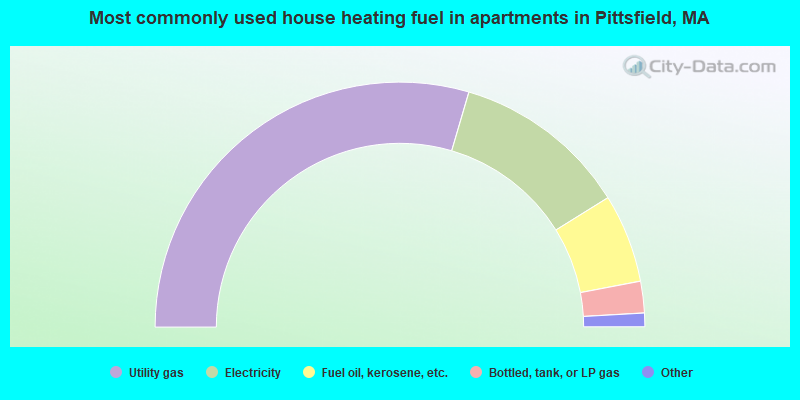
- 61.7%Utility gas
- 21.8%Electricity
- 9.7%Fuel oil, kerosene, etc.
- 4.1%Bottled, tank, or LP gas
- 1.8%Other fuel
- 0.8%No fuel used
- 0.1%Wood
Private vs. public school enrollment:
| Here: | 15.2% |
| Massachusetts: | 10.3% |
| Here: | 4.8% |
| Massachusetts: | 12.3% |
| Here: | 20.6% |
| Massachusetts: | 51.2% |


