Pinson, TN (Tennessee) Houses and Residents
| Pinson: | $178,543 |
| Tennessee: | $284,800 |
Total population: 4,855 (Urban population: 38, Rural population: 4,586 (151 farm, 4,435 nonfarm))
Houses: 1,882 (1,769 occupied: 1,510 owner occupied, 259 renter occupied)
| % of renters here: | 15% |
| State: | 33% |
Housing density: 25 houses/condos per square mile
Median price asked for vacant for-sale houses and condos in 2022 in this county: $409,285.
Median contract rent in 2022: $582 (lower quartile is $450, upper quartile is $763)
Median rent asked for vacant for-rent units in 2022: $600
Median gross rent in Pinson, TN in 2022: $925
Housing units in Pinson with a mortgage: 630 (96 second mortgage, 54 home equity loan, 0 both second mortgage and home equity loan)
Houses without a mortgage: 319
Compare current foreclosures near Pinson, TN:
| Photo | Address | Area | Beds / Baths | Price | Details |
|---|---|---|---|---|---|

|
#1
Diggs Rd
Pinson, TN 38366
|
1,368 sq. feet
|
2 baths 3 beds |
$154,900
|
show details |

|
#2
Stone Rd
Pinson, TN 38366
|
1,538 sq. feet
|
2 baths - beds |
show details | |

|
#3
Cedarfield Rd
Pinson, TN 38366
|
1,642 sq. feet
|
2 baths - beds |
show details | |

|
#4
Stone Rd
Pinson, TN 38366
|
1,468 sq. feet
|
2 baths - beds |
show details | |

|
#5
Bear Creek Rd
Pinson, TN 38366
|
1,064 sq. feet
|
1 baths - beds |
show details | |

|
#6
Stone Rd
Pinson, TN 38366
|
3,212 sq. feet
|
3 baths - beds |
show details | |

|
#7
Bear Creek Rd
Pinson, TN 38366
|
2,402 sq. feet
|
1 baths - beds |
show details | |

|
#8
Stone Rd
Pinson, TN 38366
|
1,508 sq. feet
|
2 baths - beds |
show details | |

|
#9
Parkburg Rd
Pinson, TN 38366
|
1,448 sq. feet
|
1 baths - beds |
show details | |

|
#10
Bear Creek Rd
Pinson, TN 38366
|
912 sq. feet
|
1 baths - beds |
show details |
| Photo | Address | Area | Beds / Baths | Price | Details |
|---|---|---|---|---|---|

|
#11
Stone Rd
Pinson, TN 38366
|
1,216 sq. feet
|
- baths - beds |
show details | |

|
#12
Parkburg Rd
Pinson, TN 38366
|
- sq. feet
|
- baths - beds |
show details | |

|
#13
Bear Creek Rd
Pinson, TN 38366
|
1,216 sq. feet
|
- baths - beds |
show details | |

|
#14
Walnut St
Jackson, TN 38301
|
3,294 sq. feet
|
2 baths 4 beds |
show details | |

|
#15
Mason Rd
Humboldt, TN 38343
|
1,625 sq. feet
|
2 baths 3 beds |
show details | |

|
#16
Highway 200
Huron, TN 38345
|
2,597 sq. feet
|
2 baths 4 beds |
show details | |

|
#17
Preston St
Jackson, TN 38301
|
1,306 sq. feet
|
1 baths 3 beds |
show details | |

|
#18
Bowman Loop
Beech Bluff, TN 38313
|
1,425 sq. feet
|
2 baths 3 beds |
show details | |

|
#19
Beech Bluff Rd
Jackson, TN 38301
|
2,297 sq. feet
|
3 baths 4 beds |
show details | |

|
#20
Westmoreland Pl
Jackson, TN 38301
|
2,522 sq. feet
|
2 baths 3 beds |
show details |
| Photo | Address | Area | Beds / Baths | Price | Details |
|---|---|---|---|---|---|

|
#21
Village Way
Henderson, TN 38340
|
- sq. feet
|
2 baths - beds |
show details | |

|
#22
Harmony Ln
Henderson, TN 38340
|
1,730 sq. feet
|
2 baths - beds |
show details | |

|
#23
Betty Manley Rd
Denmark, TN 38391
|
792 sq. feet
|
1 baths - beds |
show details | |

|
#24
Wesley Dr
Jackson, TN 38305
|
1,755 sq. feet
|
2 baths - beds |
show details | |

|
#25
Twilight Cv
Jackson, TN 38305
|
2,065 sq. feet
|
2 baths - beds |
show details | |

|
#26
Plymouth Rock Dr
Jackson, TN 38305
|
2,073 sq. feet
|
3 baths - beds |
show details | |

|
#27
Cotton Ridge Dr
Jackson, TN 38305
|
1,607 sq. feet
|
2 baths - beds |
show details | |

|
#28
Blackberry Trl
Jackson, TN 38305
|
1,077 sq. feet
|
1 baths - beds |
show details | |

|
#29
Mcgee Loop
Jackson, TN 38305
|
1,431 sq. feet
|
2 baths - beds |
show details | |

|
#30
Old Naylor Rd
Finger, TN 38334
|
2,050 sq. feet
|
1 baths - beds |
show details |
| Photo | Address | Area | Beds / Baths | Price | Details |
|---|---|---|---|---|---|

|
#31
Rolling Meadows Dr
Jackson, TN 38305
|
962 sq. feet
|
1 baths - beds |
show details | |

|
#32
Dyer Creek Ln
Jackson, TN 38305
|
1,258 sq. feet
|
2 baths - beds |
show details | |

|
#33
Holland Ln
Jackson, TN 38305
|
1,264 sq. feet
|
1 baths - beds |
show details | |

|
#34
Pepper Rdg
Jackson, TN 38305
|
1,820 sq. feet
|
2 baths - beds |
show details | |

|
#35
Fair Oaks Pl
Jackson, TN 38305
|
1,714 sq. feet
|
2 baths - beds |
show details | |

|
#36
Twin Oaks Pl
Jackson, TN 38305
|
1,435 sq. feet
|
2 baths - beds |
show details | |

|
#37
Knollwood Dr
Jackson, TN 38305
|
1,411 sq. feet
|
1 baths - beds |
show details | |

|
#38
Knollwood Dr
Jackson, TN 38305
|
1,295 sq. feet
|
2 baths - beds |
show details | |

|
#39
Hurtland Dr
Jackson, TN 38305
|
2,843 sq. feet
|
3 baths - beds |
show details | |

|
#40
Ridgecrest Rd
Jackson, TN 38305
|
1,606 sq. feet
|
2 baths - beds |
show details |
| Photo | Address | Area | Beds / Baths | Price | Details |
|---|---|---|---|---|---|

|
#41
Henderson Rd
Jackson, TN 38305
|
1,397 sq. feet
|
2 baths - beds |
show details | |

|
#42
Farmington Dr
Jackson, TN 38305
|
3,276 sq. feet
|
2 baths - beds |
show details | |

|
#43
Pinewood Dr
Jackson, TN 38305
|
2,903 sq. feet
|
3 baths - beds |
show details | |

|
#44
Moss Dr
Jackson, TN 38305
|
1,668 sq. feet
|
2 baths - beds |
show details | |

|
#45
Wesley Dr
Jackson, TN 38305
|
1,714 sq. feet
|
2 baths - beds |
show details | |

|
#46
Arlington Ave
Jackson, TN 38301
|
1,400 sq. feet
|
1 baths - beds |
show details | |

|
#47
Hickory Hills Dr
Jackson, TN 38305
|
1,537 sq. feet
|
2 baths - beds |
show details | |

|
#48
Sedgefield Dr
Jackson, TN 38305
|
1,441 sq. feet
|
2 baths - beds |
show details | |

|
#49
Sedgefield Dr
Jackson, TN 38305
|
1,434 sq. feet
|
2 baths - beds |
show details | |

|
Check over 1 million property listings on Foreclosure.com!
|
browse all offers | |||

Household type by relationship:
Households: 93,876- In family households: 79,005 (16,133 male householders, 9,495 female householders)
17,119 spouses, 27,649 children (25,341 natural, 759 adopted, 1,549 stepchildren), 2,931 grandchildren, 1,048 brothers or sisters, 812 parents, foster children, 1,387 other relatives, 2,026 non-relatives
- In nonfamily households: 14,871 (5,592 male householders (4,549 living alone)), 6,853 female householders (5,983 living alone)), 2,426 nonrelatives
- In group quarters: 4,418 (1,572 institutionalized population)
13,874 married couples with children.
7,106 single-parent households (921 men, 6,185 women).
98.6% of residents of Pinson speak English at home.
0.3% of residents speak Spanish at home (100% speak English very well).
0.4% of residents speak other Indo-European language at home (100% speak English very well).
0.6% of residents speak Asian or Pacific Island language at home (100% speak English well).
Foreign born population: 60 (1.2%)
(38.3% of them are naturalized citizens)
| Here: | 6.6 |
| State: | 6.5 |
| Here: | 4.7 |
| State: | 4.4 |

- Bedrooms in owner-occupied houses and condos in Pinson, Tennessee
- 13no bedroom
- 331 bedroom
- 2922 bedrooms
- 9633 bedrooms
- 1944 bedrooms
- 155+ bedrooms

- Bedrooms in renter-occupied apartments in Pinson, Tennessee
- 7no bedroom
- 381 bedroom
- 1242 bedrooms
- 753 bedrooms
- 74 bedrooms
- 85+ bedrooms

- Cars and other vehicles available in Pinson in owner-occupied houses/condos
- 73no vehicle
- 2391 vehicle
- 7402 vehicles
- 3033 vehicles
- 1154 vehicles
- 405+ vehicles

- Cars and other vehicles available in Pinson in renter-occupied apartments
- 27no vehicle
- 1121 vehicle
- 992 vehicles
- 213 vehicles
- 04 vehicles
- 05+ vehicles

- Rooms in owner-occupied houses in Pinson, Tennessee
- 131 room
- 122 rooms
- 363 rooms
- 1164 rooms
- 3925 rooms
- 3846 rooms
- 2687 rooms
- 1748 rooms
- 1159+ rooms

- Rooms in renter-occupied apartments in Pinson, Tennessee
- 71 room
- 02 rooms
- 233 rooms
- 984 rooms
- 595 rooms
- 486 rooms
- 167 rooms
- 08 rooms
- 89+ rooms


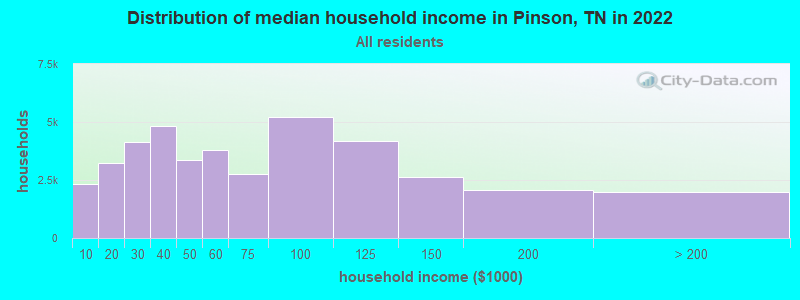
Pinson, TN household income distribution

- 2,326Less than $10,000
- 3,224$10,000 to $19,999
- 4,122$20,000 to $29,999
- 4,841$30,000 to $39,999
- 3,360$40,000 to $49,999
- 3,811$50,000 to $59,999
- 2,755$60,000 to $74,999
- 5,235$75,000 to $99,999
- 4,177$100,000 to $124,999
- 2,609$125,000 to $149,999
- 2,057$150,000 to $199,999
- 1,991$200,000 or more
Percentage of workers working in this county: 85.0%
Number of people working at home: 265 (9.8% of all workers)
Travel time to work (commute)
- Less than 5 minutes: 79
- 5 to 9 minutes: 93
- 10 to 14 minutes: 200
- 15 to 19 minutes: 326
- 20 to 24 minutes: 533
- 25 to 29 minutes: 195
- 30 to 34 minutes: 575
- 35 to 39 minutes: 86
- 40 to 44 minutes: 65
- 45 to 59 minutes: 152
- 60 to 89 minutes: 28
- 90 or more minutes: 57
Means of transportation to work:
- Drove a car alone: 2,014 (83.9%)
- Carpooled: 333 (13.9%)
- Motorcycle: 8 (0.3%)
- Walked: 13 (0.5%)
- Other means: 21 (0.9%)
- Worked at home: 12 (0.5%)


- Year of entry for the foreign-born population in Pinson, Tennessee
- 01995 to March 2000
- 141990 to 1994
- 91985 to 1989
- 51980 to 1984
- 51975 to 1979
- 01970 to 1974
- 01965 to 1969
- 5Before 1965
Most common places of birth for foreign-born residents (%):
| Pinson: | 50.0% (19) |
| Tennessee: | 3.6% (5,726) |
| Pinson: | 23.7% (9) |
| Tennessee: | 1.0% (1,525) |
| Pinson: | 13.2% (5) |
| Tennessee: | 0.2% (391) |
| Pinson: | 13.2% (5) |
| Tennessee: | 2.6% (4,078) |
Place of birth for U.S.-born residents:
- This state: 3,508
- Other state: 1,063
- Northeast: 24
- Midwest: 483
- South: 441
- West: 115
70% of Pinson residents lived in the same house 5 years ago.
Out of people who lived in different houses, 61% lived in this county.
Out of people who lived in different counties, 54% lived in Tennessee.
Education attainment for males 25 years and older:
- No schooling: 20
- Nursery to 4th grade: 28
- 5th and 6th grade: 28
- 7th and 8th grade: 67
- 9th grade: 43
- 10th grade: 38
- 11th grade: 78
- 12th grade, no diploma: 54
- High school graduate (or equivalency): 735
- Less than 1 year of college: 60
- Some college more than 1 year, no degree: 160
- Associate degree: 68
- Bachelor's degree: 115
- Master's degree: 37
- Professional school degree: 0
- Doctorate degree: 0

Education attainment for females 25 years and older:
- No schooling: 11
- Nursery to 4th grade: 7
- 5th and 6th grade: 12
- 7th and 8th grade: 83
- 9th grade: 59
- 10th grade: 104
- 11th grade: 60
- 12th grade, no diploma: 55
- High school graduate (or equivalency): 625
- Less than 1 year of college: 157
- Some college more than 1 year, no degree: 177
- Associate degree: 87
- Bachelor's degree: 65
- Master's degree: 69
- Professional school degree: 0
- Doctorate degree: 0


Housing units in structures:
- One, detached: 1,494
- 3 or 4: 7
- 5 to 9: 6
- Mobile homes: 375
Median worth of mobile homes: $116,534
Housing units lacking complete kitchen facilities: 0.6%

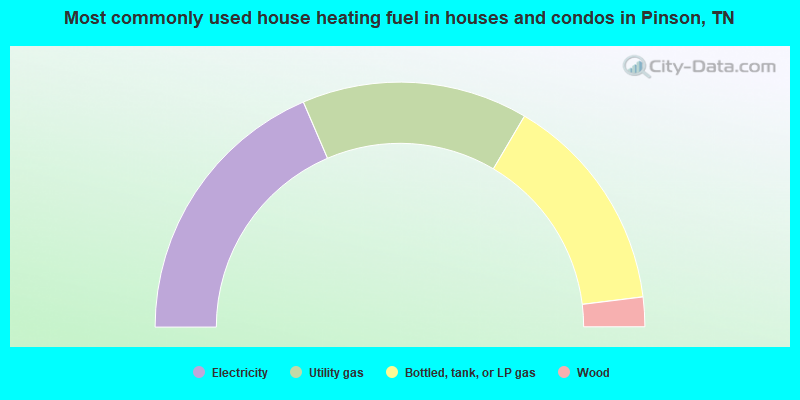
- 37.1%Electricity
- 29.9%Utility gas
- 29.1%Bottled, tank, or LP gas
- 3.9%Wood
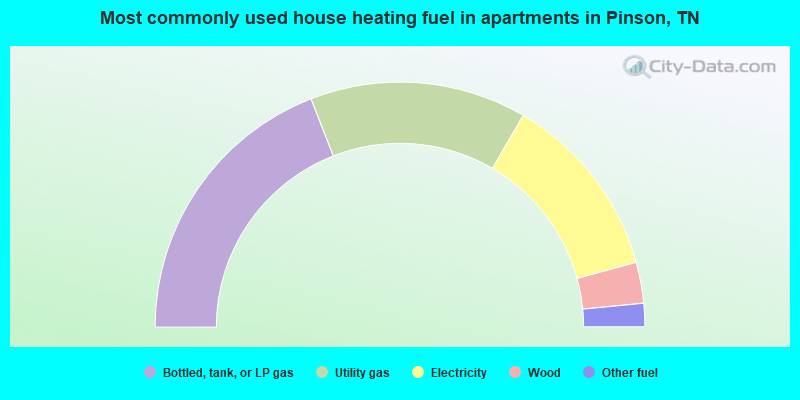
- 38.2%Bottled, tank, or LP gas
- 28.6%Utility gas
- 24.7%Electricity
- 5.4%Wood
- 3.1%Other fuel
Private vs. public school enrollment:
| Here: | 6.7% |
| Tennessee: | 9.5% |
| Here: | 12.4% |
| Tennessee: | 10.4% |
| Here: | 34.6% |
| Tennessee: | 22.8% |


