Pinole, CA (California) Houses and Residents
| Pinole: | $733,175 |
| California: | $715,900 |
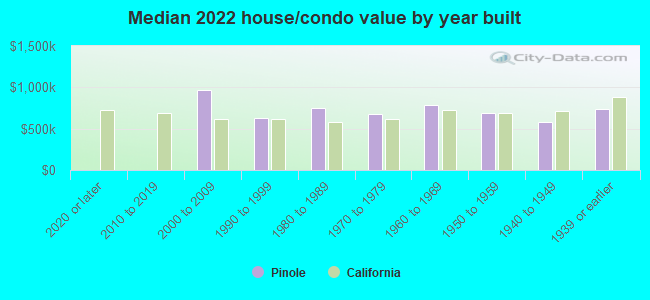
Mean price in 2022:
Detached houses: $880,611
Here: $880,611 State: $988,808 Townhouses or other attached units: $612,658
Here: $612,658 State: $838,546 In 3-to-4-unit structures: $366,426
Here: $366,426 State: $824,253 In 5-or-more-unit structures: $534,688
Here: $534,688 State: $730,996
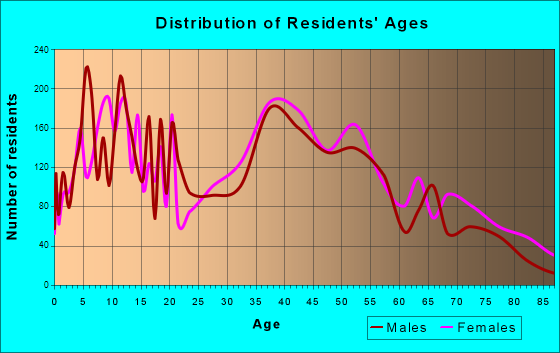
Total population: 19,100 (All urban)
Houses: 7,298 (6,879 occupied: 4,965 owner occupied, 1,928 renter occupied)
| % of renters here: | 28% |
| State: | 44% |
Housing density: 1,404 houses/condos per square mile
Median price asked for vacant for-sale houses and condos in 2022: $260,196.
Median contract rent in 2022: over $2,000 (lower quartile is $1,455, upper quartile is over $2,000)
Median rent asked for vacant for-rent units in 2022: $2,052
Median gross rent in Pinole, CA in 2022: over $2,000
Housing units in Pinole with a mortgage: 3,334 (316 second mortgage, 41 home equity loan, 278 both second mortgage and home equity loan)
Houses without a mortgage: 87
Median household income for houses/condos with a mortgage: $142,115
Median household income for apartments without a mortgage: $91,829
Median monthly housing costs: $2,187
Compare current foreclosures near Pinole, CA:
| Photo | Address | Area | Beds / Baths | Price | Details |
|---|---|---|---|---|---|

|
#1
Remuda Way
Pinole, CA 94564
|
1,622 sq. feet
|
2 baths 3 beds |
show details | |

|
#2
Sarita Ct
Pinole, CA 94564
|
1,359 sq. feet
|
2 baths 3 beds |
show details | |

|
#3
Wright Ave
Pinole, CA 94564
|
1,288 sq. feet
|
2 baths 3 beds |
show details | |

|
#4
Simas Ave
Pinole, CA 94564
|
1,504 sq. feet
|
2 baths 4 beds |
show details | |

|
#5
Kildare Way
Pinole, CA 94564
|
1,247 sq. feet
|
2 baths 3 beds |
show details | |

|
#6
Sarah Dr
Pinole, CA 94564
|
1,524 sq. feet
|
2 baths 2 beds |
show details | |

|
#7
Carmelita Way
Pinole, CA 94564
|
1,598 sq. feet
|
2 baths 4 beds |
show details | |

|
#8
Tennent Ct
Pinole, CA 94564
|
1,045 sq. feet
|
2 baths 3 beds |
show details | |

|
#9
Alberdan Ct
Pinole, CA 94564
|
1,232 sq. feet
|
2 baths 3 beds |
show details | |

|
#10
E Meadow Ave
Pinole, CA 94564
|
1,955 sq. feet
|
2 baths 4 beds |
show details |
| Photo | Address | Area | Beds / Baths | Price | Details |
|---|---|---|---|---|---|

|
#11
Costa Ct
Pinole, CA 94564
|
1,788 sq. feet
|
2 baths 5 beds |
show details | |

|
#12
Dursey Dr
Pinole, CA 94564
|
996 sq. feet
|
2 baths 2 beds |
show details | |

|
#13
Carlotta Cir
Pinole, CA 94564
|
2,001 sq. feet
|
2 baths 4 beds |
show details | |

|
#14
Buckskin Rd
Pinole, CA 94564
|
1,422 sq. feet
|
2 baths 4 beds |
show details | |

|
#15
Tomar Ct
Pinole, CA 94564
|
1,833 sq. feet
|
3 baths 3 beds |
show details | |

|
#16
Ellerhorst St
Pinole, CA 94564
|
1,832 sq. feet
|
2 baths 4 beds |
show details | |

|
#17
Carlotta Cir
Pinole, CA 94564
|
2,001 sq. feet
|
2 baths 4 beds |
show details | |

|
#18
Meadow Ave
Pinole, CA 94564
|
1,209 sq. feet
|
2 baths 4 beds |
show details | |

|
#19
Alvarez Ave Apt C
Pinole, CA 94564
|
- sq. feet
|
- baths - beds |
show details | |

|
#20
2nd St
Richmond, CA 94801
|
887 sq. feet
|
1 baths 3 beds |
$364,000
|
show details |
| Photo | Address | Area | Beds / Baths | Price | Details |
|---|---|---|---|---|---|

|
#21
Limestone Dr
Vallejo, CA 94589
|
1,677 sq. feet
|
2 baths 4 beds |
$609,000
|
show details |

|
#22
Hastings Ave
Vallejo, CA 94589
|
1,104 sq. feet
|
2 baths 3 beds |
$529,000
|
show details |

|
#23
Thorndale Dr Apt 435
San Rafael, CA 94903
|
1,096 sq. feet
|
2 baths 2 beds |
$149,900
|
show details |

|
#24
Shea Dr
Pinole, CA 94564
|
- sq. feet
|
- baths - beds |
show details | |

|
#25
Thorndale Dr Apt 206
San Rafael, CA 94903
|
660 sq. feet
|
1 baths 1 beds |
$59,900
|
show details |

|
#26
Mohr Ln Apt C
Concord, CA 94518
|
870 sq. feet
|
1 baths 2 beds |
show details | |

|
#27
21st St
San Pablo, CA 94806
|
1,665 sq. feet
|
2 baths 3 beds |
show details | |

|
#28
Kelsey St
Richmond, CA 94801
|
1,080 sq. feet
|
3 baths 4 beds |
show details | |

|
#29
El Portal Dr Apt D
San Pablo, CA 94806
|
1,058 sq. feet
|
2 baths 2 beds |
show details | |

|
#30
Virginia St
Berkeley, CA 94702
|
1,690 sq. feet
|
2 baths 3 beds |
show details |
| Photo | Address | Area | Beds / Baths | Price | Details |
|---|---|---|---|---|---|

|
#31
Bernhard Ave
Richmond, CA 94805
|
4,315 sq. feet
|
3 baths 4 beds |
show details | |

|
#32
Oakstone Ct
American Canyon, CA 94503
|
3,164 sq. feet
|
3 baths 6 beds |
show details | |

|
#33
Vale Rd Apt 35
San Pablo, CA 94806
|
1,858 sq. feet
|
3 baths 3 beds |
show details | |

|
#34
Adeline St
Emeryville, CA 94608
|
986 sq. feet
|
1 baths 3 beds |
show details | |

|
#35
Grant St
Vallejo, CA 94590
|
929 sq. feet
|
2 baths 3 beds |
show details | |

|
#36
Heide Ct
El Sobrante, CA 94803
|
4,151 sq. feet
|
3 baths 5 beds |
show details | |

|
#37
Sandstone Dr
Vallejo, CA 94589
|
1,872 sq. feet
|
2 baths 2 beds |
show details | |

|
#38
3rd St
San Rafael, CA 94901
|
1,304 sq. feet
|
1 baths 2 beds |
show details | |

|
#39
Patrick Ct
Vallejo, CA 94591
|
1,056 sq. feet
|
1 baths 3 beds |
show details | |

|
#40
Bryant St
San Francisco, CA 94105
|
1,101 sq. feet
|
2 baths 2 beds |
show details |
| Photo | Address | Area | Beds / Baths | Price | Details |
|---|---|---|---|---|---|

|
#41
Lincoln Ave
Alameda, CA 94501
|
869 sq. feet
|
1 baths 2 beds |
show details | |

|
#42
Daniels Ave
Vallejo, CA 94590
|
1,782 sq. feet
|
2 baths 4 beds |
show details | |

|
#43
Vaqueros Ave
Rodeo, CA 94572
|
935 sq. feet
|
2 baths 3 beds |
show details | |

|
#44
Crucero Ave
San Pablo, CA 94806
|
1,264 sq. feet
|
2 baths 3 beds |
show details | |

|
#45
Jane Ct
Martinez, CA 94553
|
1,121 sq. feet
|
2 baths 3 beds |
show details | |

|
#46
Summer Ln
San Pablo, CA 94806
|
1,819 sq. feet
|
3 baths 3 beds |
show details | |

|
#47
3rd St Apt 808
San Francisco, CA 94107
|
807 sq. feet
|
1 baths 3 beds |
show details | |

|
#48
Sequoia Valley Rd
Mill Valley, CA 94941
|
2,177 sq. feet
|
2 baths 3 beds |
show details | |

|
#49
Claremont Ave
Oakland, CA 94618
|
- sq. feet
|
11 baths 12 beds |
show details | |

|
Check over 1 million property listings on Foreclosure.com!
|
browse all offers | |||

Latest news about housing in Pinole, CA collected exclusively by city-data.com from local newspapers, TV, and radio stations

 | Long term ramifications on Bay Area Real Estate and Economy (228 replies) |
| Relocating and Househunting (48 replies) |
| Sacramento homeless issues - what is the latest? (132 replies) |
| Housing for TOURO student-Vallejo (20 replies) |
| Commuting from East Bay/Pinole to Peninsula/San Bruno (6 replies) |
| Buy in Richmond vs. Rent in Berkeley (51 replies) |
Median year apartment built: 1968
Household type by relationship:
Households: 18,853- Male householders: 3,023 (571 living alone), Female householders: 3,727 (797 living alone)
3,418 spouses (3,395 opposite-sex spouses), 715 unmarried partners, (685 opposite-sex unmarried partners), 5,236 children (4,931 natural, 44 adopted, 259 stepchildren), 323 grandchildren, 299 brothers or sisters, 748 parents, 0 foster children, 567 other relatives, 661 non-relatives
- In group quarters: 132
Size of family households: 2,248 2-persons, 1,075 3-persons, 784 4-persons, 521 5-persons, 227 6-persons, 104 7-or-more-persons.
Size of nonfamily households: 1,384 1-person, 346 2-persons, 145 3-persons, 20 5-persons, 6 6-persons.
1,896 married couples with children.
940 single-parent households (458 men, 482 women).
63.1% of residents of Pinole speak English at home.
14.8% of residents speak Spanish at home (63% speak English very well, 26% speak English well, 10% speak English not well, 1% don't speak English at all).
3.9% of residents speak other Indo-European language at home (72% speak English very well, 20% speak English well, 7% speak English not well).
17.5% of residents speak Asian or Pacific Island language at home (50% speak English very well, 27% speak English well, 11% speak English not well, 12% don't speak English at all).
2.0% of residents speak other language at home (77% speak English very well, 19% speak English well, 1% speak English not well, 3% don't speak English at all).
Foreign born population: 5,828 (30.9%)
(73.3% of them are naturalized citizens)
| Here: | 6.1 |
| State: | 6.0 |
| Here: | 4.4 |
| State: | 3.9 |
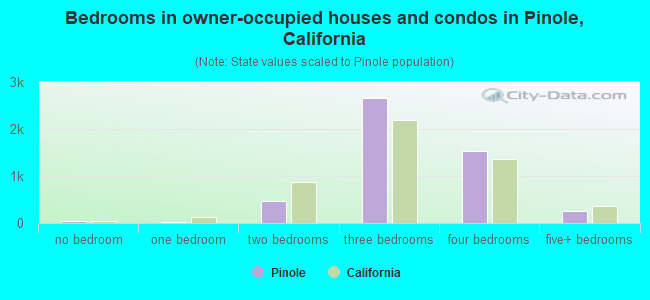
- Bedrooms in owner-occupied houses and condos in Pinole, California
- 50no bedroom
- 111 bedroom
- 4602 bedrooms
- 2,6523 bedrooms
- 1,5344 bedrooms
- 2595+ bedrooms
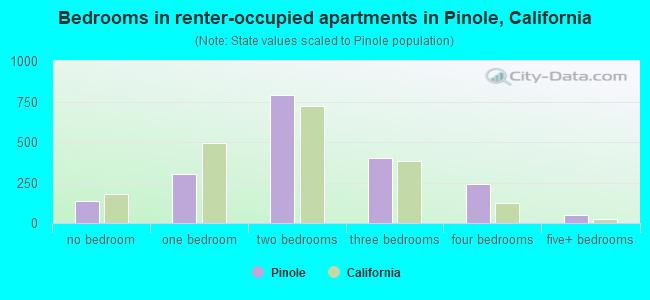
- Bedrooms in renter-occupied apartments in Pinole, California
- 138no bedroom
- 3041 bedroom
- 7932 bedrooms
- 4043 bedrooms
- 2434 bedrooms
- 475+ bedrooms
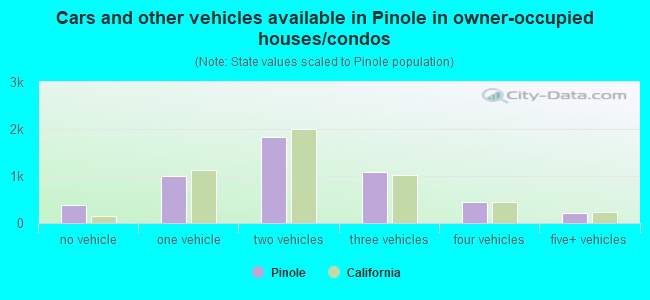
- Cars and other vehicles available in Pinole in owner-occupied houses/condos
- 393no vehicle
- 1,0101 vehicle
- 1,8212 vehicles
- 1,0923 vehicles
- 4434 vehicles
- 2065+ vehicles
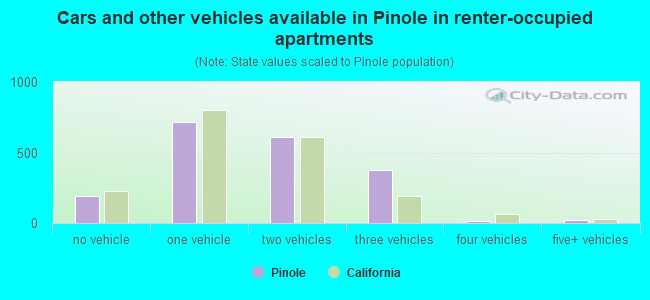
- Cars and other vehicles available in Pinole in renter-occupied apartments
- 190no vehicle
- 7191 vehicle
- 6132 vehicles
- 3763 vehicles
- 134 vehicles
- 185+ vehicles
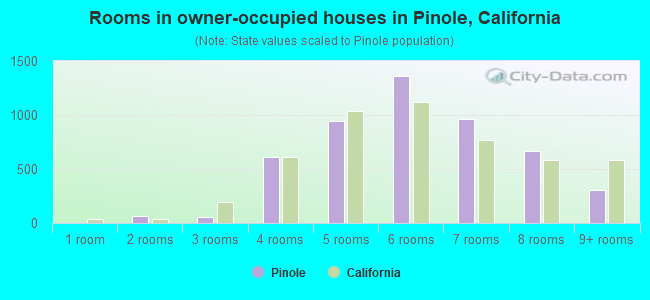
- Rooms in owner-occupied houses in Pinole, California
- 01 room
- 612 rooms
- 563 rooms
- 6114 rooms
- 9455 rooms
- 1,3576 rooms
- 9617 rooms
- 6658 rooms
- 3109+ rooms
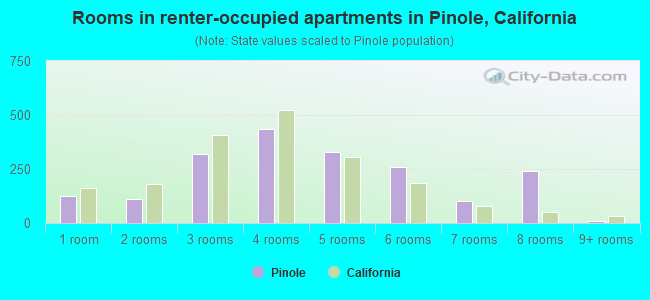
- Rooms in renter-occupied apartments in Pinole, California
- 1261 room
- 1092 rooms
- 3213 rooms
- 4334 rooms
- 3295 rooms
- 2576 rooms
- 1047 rooms
- 2418 rooms
- 99+ rooms
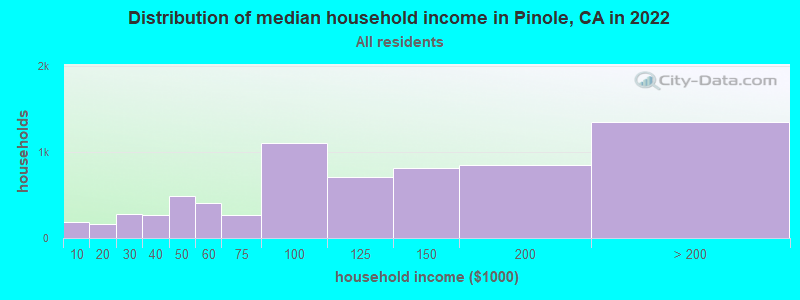
Pinole, CA household income distribution

- 191Less than $10,000
- 167$10,000 to $19,999
- 274$20,000 to $29,999
- 269$30,000 to $39,999
- 487$40,000 to $49,999
- 402$50,000 to $59,999
- 265$60,000 to $74,999
- 1,101$75,000 to $99,999
- 705$100,000 to $124,999
- 812$125,000 to $149,999
- 843$150,000 to $199,999
- 1,347$200,000 or more
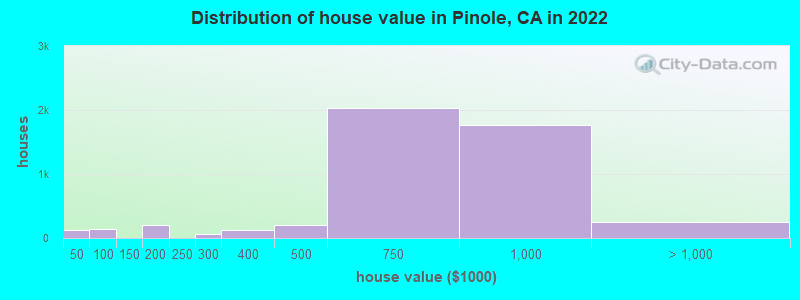
Home value of owner - occupied houses in 2022 in Pinole, CA
-
- 109Less than $10,000
- 16$40,000 to $49,999
- 37$50,000 to $59,999
- 6$60,000 to $69,999
- 46$70,000 to $79,999
- 13$80,000 to $89,999
- 13$90,000 to $99,999
- 68$150,000 to $174,999
- 138$175,000 to $199,999
- 59$250,000 to $299,999
- 117$300,000 to $399,999
- 202$400,000 to $499,999
- 2,038$500,000 to $749,999
- 1,760$750,000 to $999,999
- 152$1,000,000 to $1,499,999
- 17$1,500,000 to $1,999,999
- 81$2,000,000 or more
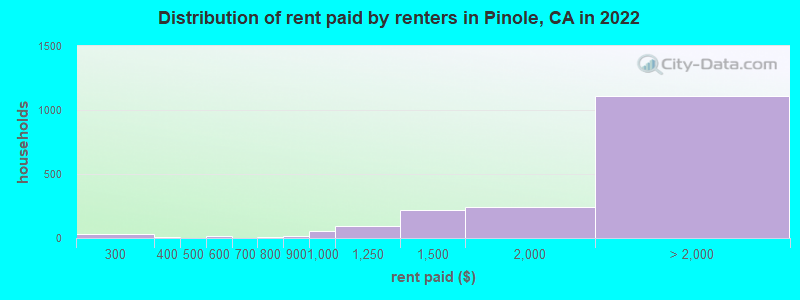
Rent paid by renters in 2022 in Pinole, CA
-
- 6$100 to $149
- 29$250 to $299
- 4$300 to $349
- 13$500 to $549
- 9$750 to $799
- 15$800 to $899
- 54$900 to $999
- 92$1,000 to $1,249
- 219$1,250 to $1,499
- 244$1,500 to $1,999
- 373$2,000 to $2,499
- 154$2,500 to $2,999
- 264$3,000 to $3,499
- 155$3,500 or more
- 160No cash rent
Percentage of workers working in this county: 53.2%
Number of people working at home: 1,318 (13.8% of all workers)
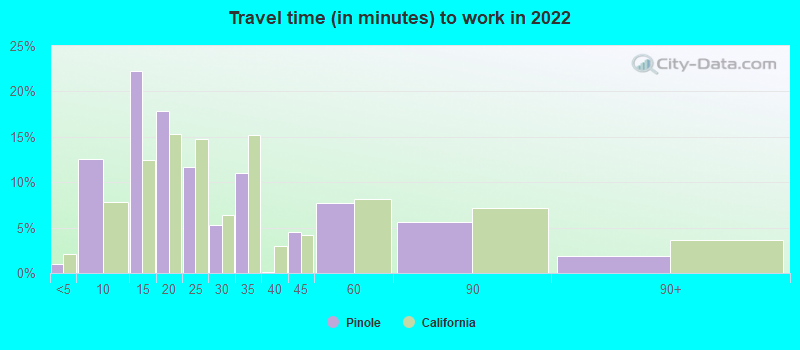
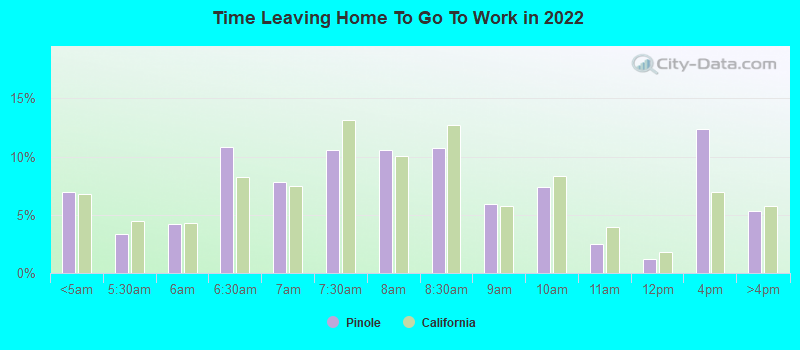
Travel time to work (commute)
- Less than 5 minutes: 46
- 5 to 9 minutes: 562
- 10 to 14 minutes: 594
- 15 to 19 minutes: 783
- 20 to 24 minutes: 959
- 25 to 29 minutes: 190
- 30 to 34 minutes: 1,175
- 35 to 39 minutes: 194
- 40 to 44 minutes: 735
- 45 to 59 minutes: 1,226
- 60 to 89 minutes: 985
- 90 or more minutes: 559
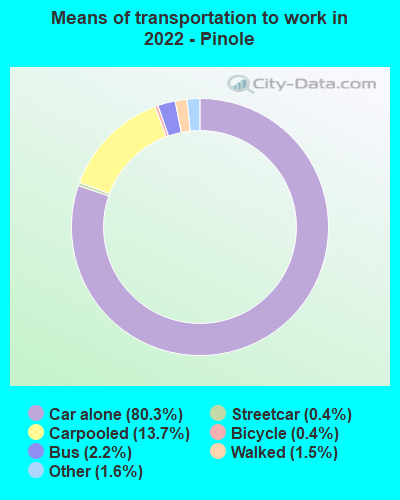
Means of transportation to work:
- Drove a car alone: 4,208 (62.5%)
- Carpooled: 801 (11.9%)
- Bus: 91 (1.4%)
- Subway or elevated rail: 12 (0.2%)
- Taxi: 90 (1.3%)
- Bicycle: 14 (0.2%)
- Walked: 111 (1.6%)
- Worked at home: 1,318 (19.6%)
- Unemployment by race in 2022
- Unemployment rate for White non-Hispanic residents
- 3.1%Males
- 1.8%Females
- Unemployment rate for Black residents
- 0.9%Males
- 0.8%Females
- Unemployment rate for American Indian and Alaska Native residents
- 45.3%Males
- Unemployment rate for Asian residents
- 1.5%Males
- 3.9%Females
- Unemployment rate for other race residents
- 5.9%Males
- Unemployment rate for two or more race residents
- 4.7%Males
- 5.7%Females
- Unemployment rate for Hispanic or Latino residents
- 5.5%Males
- 3.6%Females
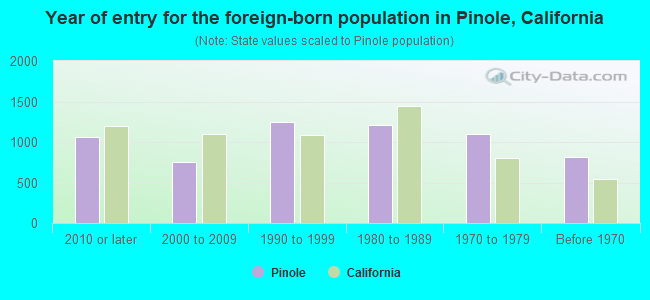
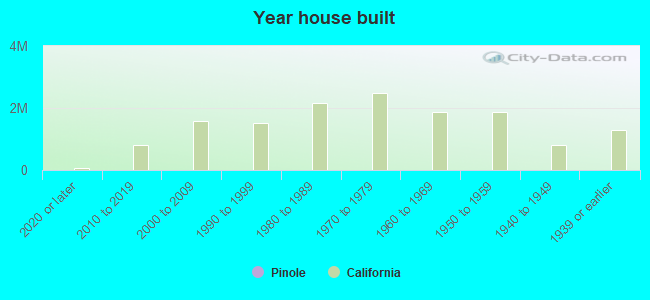
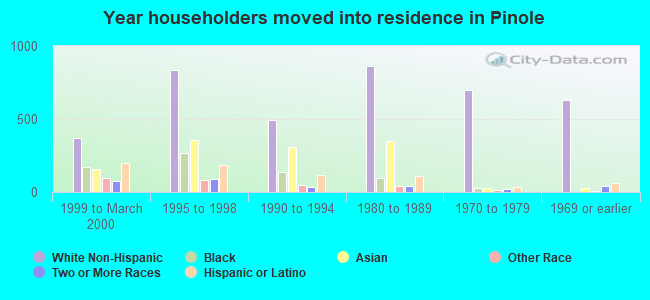
- Year of entry for the foreign-born population in Pinole, California
- 1,0612010 or later
- 7522000 to 2009
- 1,2471990 to 1999
- 1,2081980 to 1989
- 1,0991970 to 1979
- 819Before 1970
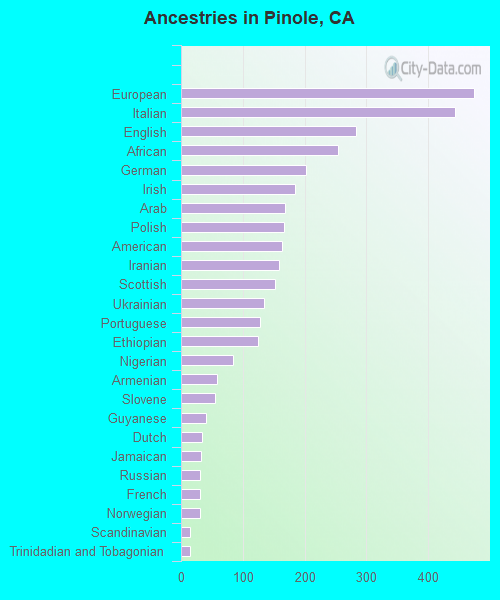
First ancestries reported:
- European: 475 (4.1%)
- Italian: 444 (3.8%)
- English: 284 (2.4%)
- African: 255 (2.2%)
- German: 203 (1.7%)
- Irish: 184 (1.6%)
- Arab: 169 (1.5%)
- Polish: 167 (1.4%)
- American: 163 (1.4%)
- Iranian: 158 (1.4%)
- Scottish: 152 (1.3%)
- Ukrainian: 134 (1.2%)
- Portuguese: 128 (1.1%)
- Ethiopian: 125 (1.1%)
- Nigerian: 84 (0.7%)
- Armenian: 58 (0.5%)
- Slovene: 55 (0.5%)
- Guyanese: 40 (0.3%)
- Dutch: 34 (0.3%)
- Jamaican: 32 (0.3%)
- Russian: 31 (0.3%)
- French: 30 (0.3%)
- Norwegian: 30 (0.3%)
- Scandinavian: 14 (0.1%)
- Trinidadian and Tobagonian: 14 (0.1%)
- British: 11 (0.09%)
- Hungarian: 9 (0.08%)
- Danish: 5 (0.04%)
Most common places of birth for foreign-born residents (%):
| Pinole: | 20.8% (1,145) |
| California: | 7.8% (818,297) |
| Pinole: | 12.1% (665) |
| California: | 37.2% (3,881,193) |
| Pinole: | 7.6% (418) |
| California: | 4.2% (440,287) |
| Pinole: | 6.6% (362) |
| California: | 6.6% (684,672) |
| Pinole: | 6.3% (348) |
| California: | 1.0% (105,215) |
| Pinole: | 5.7% (314) |
| California: | 4.9% (512,335) |
| Pinole: | 4.0% (220) |
| California: | 0.6% (58,161) |
| Pinole: | 3.8% (208) |
| California: | 2.8% (290,436) |
| Pinole: | 3.6% (200) |
| California: | 3.0% (315,248) |
| Pinole: | 3.3% (180) |
| California: | 0.5% (49,399) |
| Pinole: | 2.6% (146) |
| California: | 0.5% (48,911) |
| Pinole: | 2.6% (145) |
| California: | 2.0% (206,004) |
| Pinole: | 2.3% (125) |
| California: | 5.2% (539,184) |
| Pinole: | 1.6% (89) |
| California: | 0.2% (16,541) |
| Pinole: | 1.5% (84) |
| California: | 0.4% (39,097) |
Place of birth for U.S.-born residents:
- This state: 10,129
- Other state: 2,510
- Northeast: 562
- Midwest: 825
- South: 700
- West: 422
90.1% of Pinole residents lived in the same house 1 years ago.
Out of people who lived in different houses, 36.1% lived in this county.
Out of people who lived in different counties, 84.4% lived in California.
| Pinole: | 90.1% |
| State average: | 88.9% |
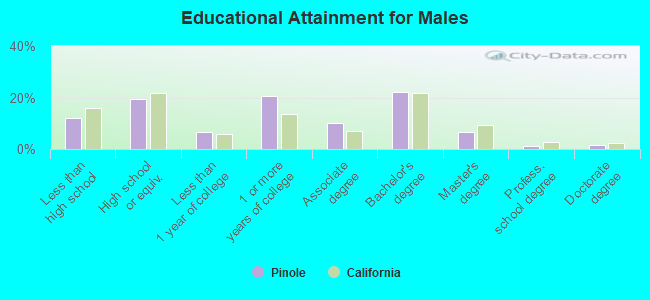
Education attainment for males 25 years and older:
- No schooling: 356
- Nursery to 4th grade: 35
- 5th and 6th grade: 89
- 7th and 8th grade: 17
- 9th grade: 39
- 10th grade: 61
- 11th grade: 138
- 12th grade, no diploma: 70
- High school graduate (or equivalency): 1,285
- Less than 1 year of college: 440
- Some college more than 1 year, no degree: 1,362
- Associate degree: 680
- Bachelor's degree: 1,475
- Master's degree: 450
- Professional school degree: 74
- Doctorate degree: 91
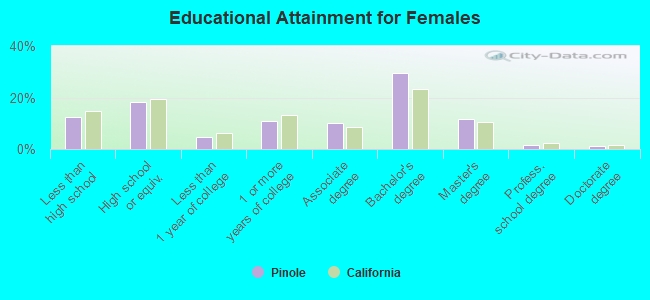
Education attainment for females 25 years and older:
- No schooling: 225
- Nursery to 4th grade: 15
- 5th and 6th grade: 34
- 7th and 8th grade: 58
- 9th grade: 5
- 10th grade: 90
- 11th grade: 172
- 12th grade, no diploma: 388
- High school graduate (or equivalency): 1,415
- Less than 1 year of college: 372
- Some college more than 1 year, no degree: 850
- Associate degree: 781
- Bachelor's degree: 2,314
- Master's degree: 899
- Professional school degree: 136
- Doctorate degree: 79
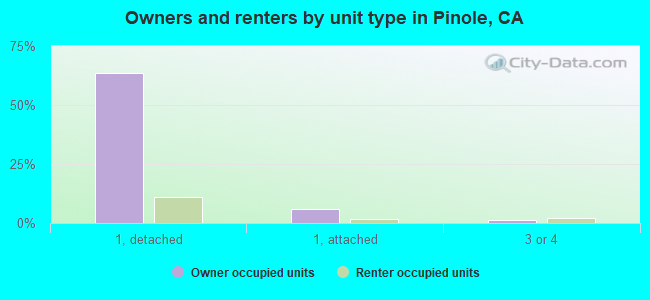
Housing units in structures:
- One, detached: 5,368
- One, attached: 836
- Two: 85
- 3 or 4: 148
- 5 to 9: 67
- 10 to 19: 380
- 20 to 49: 90
- 50 or more: 302
- Mobile homes: 19
Housing units lacking complete kitchen facilities in 2022: 3.7%
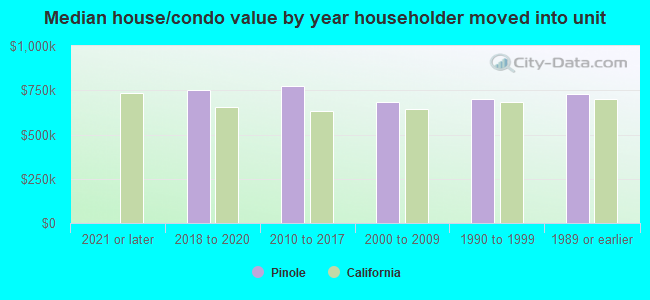
House/condo owner moved in on average 17 years ago
Renter moved in on average 4 years ago
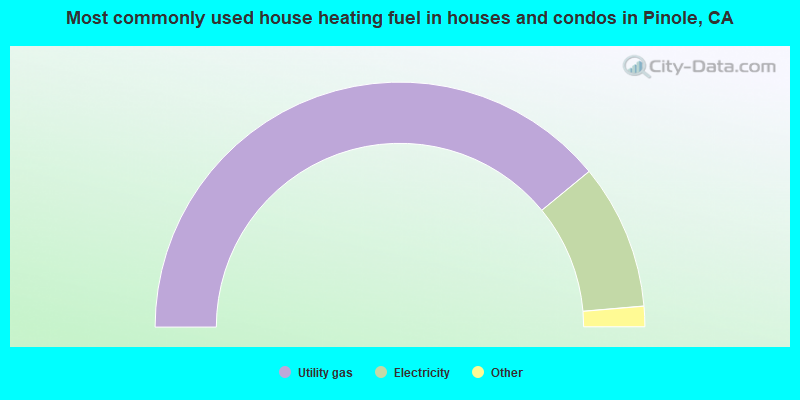
- 78.1%Utility gas
- 19.2%Electricity
- 1.3%Solar energy
- 0.9%Bottled, tank, or LP gas
- 0.5%Wood
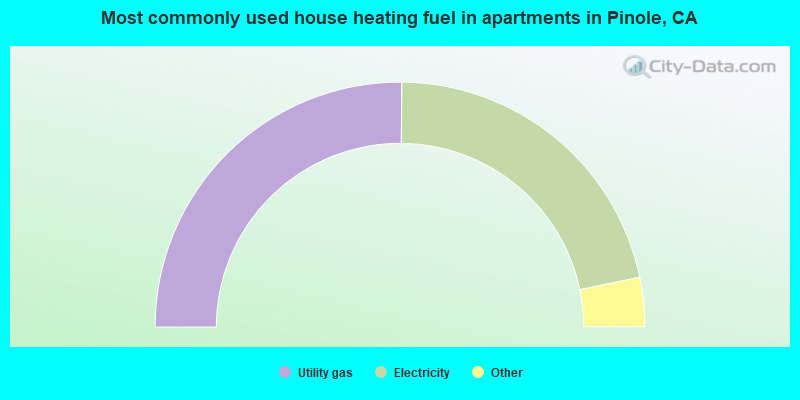
- 50.3%Utility gas
- 43.3%Electricity
- 3.4%Bottled, tank, or LP gas
- 2.1%No fuel used
- 0.9%Other fuel
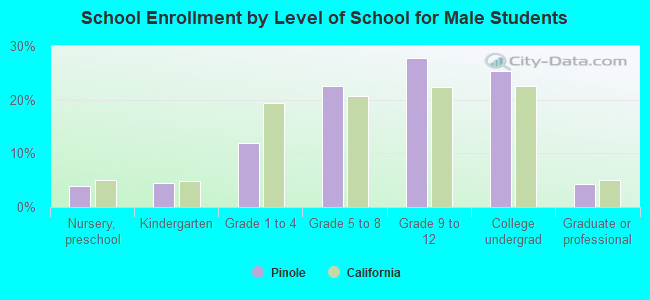
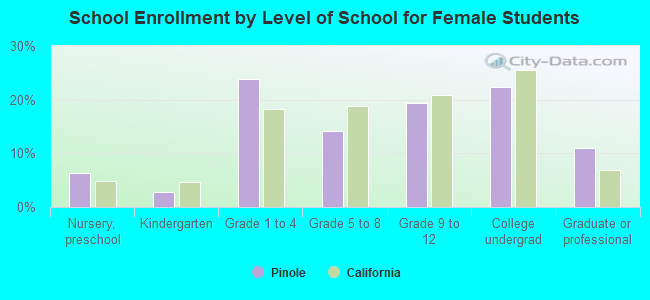
Private vs. public school enrollment:
| Here: | 15.3% |
| California: | 10.5% |
| Here: | 17.1% |
| California: | 8.5% |
| Here: | 13.4% |
| California: | 15.9% |