Pinewood, SC (South Carolina) Houses and Residents
| Pinewood: | |
| South Carolina: |
Mean price in 2022:
Detached houses: $102,221
Here: $102,221 State: $368,255 Mobile homes: $23,819
Here: $23,819 State: $102,531
Total population: 540 (Urban population: 0, Rural population: 422 (all nonfarm))
Houses: 309 (258 occupied: 170 owner occupied, 80 renter occupied)
| % of renters here: | 32% |
| State: | 28% |
Housing density: 289 houses/condos per square mile
Median price asked for vacant for-sale houses and condos in 2022 in this county: $138,322.
Median contract rent in 2022: $419
Median rent asked for vacant for-rent units in 2022: $591
Median gross rent in Pinewood, SC in 2022: $477
Housing units in Pinewood with a mortgage: 90 (0 second mortgage, 0 home equity loan, 0 both second mortgage and home equity loan)
Houses without a mortgage: 0
Median household income for houses/condos with a mortgage: $73,903
Median monthly housing costs: $715
Compare current foreclosures near Pinewood, SC:
| Photo | Address | Area | Beds / Baths | Price | Details |
|---|---|---|---|---|---|

|
#1
Hardwood Dr
Pinewood, SC 29125
|
- sq. feet
|
- baths - beds |
show details | |

|
#2
Rooster Cir
Pinewood, SC 29125
|
- sq. feet
|
- baths - beds |
show details | |

|
#3
Panola Rd
Pinewood, SC 29125
|
- sq. feet
|
- baths - beds |
show details | |

|
#4
Artesian Dr
Sumter, SC 29150
|
1,441 sq. feet
|
2 baths 3 beds |
$220,000
|
show details |

|
#5
Mooneyhan Rd
Sumter, SC 29150
|
2,126 sq. feet
|
2 baths 5 beds |
$180,000
|
show details |

|
#6
Bacon Hill Rd
Pinewood, SC 29125
|
- sq. feet
|
- baths - beds |
show details | |

|
#7
Mclaurin Rd
Wedgefield, SC 29168
|
- sq. feet
|
1 baths 3 beds |
$17,500
|
show details |

|
#8
Vernon Dr
Sumter, SC 29150
|
1,515 sq. feet
|
3 baths 3 beds |
show details | |

|
#9
Raccoon Rd
Manning, SC 29102
|
- sq. feet
|
2 baths 3 beds |
show details | |

|
#10
Legette St
Sumter, SC 29150
|
- sq. feet
|
2 baths 2 beds |
show details |
| Photo | Address | Area | Beds / Baths | Price | Details |
|---|---|---|---|---|---|

|
#11
Shuler Dr
Sumter, SC 29150
|
- sq. feet
|
1 baths 2 beds |
show details | |

|
#12
Wash Davis Rd
Summerton, SC 29148
|
- sq. feet
|
- baths - beds |
$9,900
|
show details |

|
#13
Adger Ln
Sumter, SC 29154
|
- sq. feet
|
3 baths 4 beds |
show details | |

|
#14
Middleton Rd
Wedgefield, SC 29168
|
1,606 sq. feet
|
2 baths 3 beds |
show details | |

|
#15
Bluff Rd
Eastover, SC 29044
|
576 sq. feet
|
1 baths 2 beds |
show details | |

|
#16
Senate Ln
Sumter, SC 29154
|
- sq. feet
|
2 baths 3 beds |
show details | |

|
#17
Cutleaf Dr
Sumter, SC 29150
|
- sq. feet
|
2 baths 3 beds |
show details | |

|
#18
Morris Way Dr
Sumter, SC 29154
|
- sq. feet
|
2 baths 3 beds |
show details | |

|
#19
Edmunds Dr
Sumter, SC 29154
|
- sq. feet
|
2 baths 3 beds |
show details | |

|
#20
Collingwood Ct
Sumter, SC 29154
|
- sq. feet
|
2 baths 3 beds |
show details |
| Photo | Address | Area | Beds / Baths | Price | Details |
|---|---|---|---|---|---|

|
#21
Crosswell Dr
Sumter, SC 29150
|
- sq. feet
|
2 baths 3 beds |
show details | |

|
#22
Bors St
Sumter, SC 29154
|
- sq. feet
|
2 baths 3 beds |
show details | |

|
#23
Habitat Dr
Sumter, SC 29153
|
- sq. feet
|
2 baths 3 beds |
show details | |

|
#24
Monterey Dr
Sumter, SC 29154
|
- sq. feet
|
2 baths 3 beds |
show details | |

|
#25
Tamarah Way
Sumter, SC 29154
|
- sq. feet
|
2 baths 3 beds |
show details | |

|
#26
Trillium Ln
Sumter, SC 29154
|
- sq. feet
|
2 baths 3 beds |
show details | |

|
#27
S Magnolia St
Sumter, SC 29150
|
- sq. feet
|
2 baths 3 beds |
show details | |

|
#28
Landmark Dr
Sumter, SC 29154
|
- sq. feet
|
2 baths 2 beds |
show details | |

|
#29
Cane Savannah Rd
Wedgefield, SC 29168
|
- sq. feet
|
2 baths 4 beds |
show details | |

|
#30
Continental Dr
Sumter, SC 29154
|
- sq. feet
|
2 baths 3 beds |
show details |
| Photo | Address | Area | Beds / Baths | Price | Details |
|---|---|---|---|---|---|

|
#31
Habitat Dr
Sumter, SC 29153
|
- sq. feet
|
2 baths 3 beds |
show details | |

|
#32
Oleander Dr
Sumter, SC 29154
|
- sq. feet
|
2 baths 3 beds |
show details | |

|
#33
Habitat Ct
Sumter, SC 29153
|
- sq. feet
|
2 baths 3 beds |
show details | |

|
#34
Forest Lake Dr
Sumter, SC 29154
|
- sq. feet
|
2 baths 3 beds |
show details | |

|
#35
Polaris Dr
Sumter, SC 29150
|
- sq. feet
|
2 baths 3 beds |
show details | |

|
#36
Old Spring Ct
Sumter, SC 29154
|
- sq. feet
|
2 baths 3 beds |
show details | |

|
#37
Ruger Dr
Sumter, SC 29150
|
- sq. feet
|
3 baths 4 beds |
show details | |

|
#38
Beulah Cuttino Rd
Sumter, SC 29154
|
1,161 sq. feet
|
- baths - beds |
show details | |

|
#39
Mossberg Dr
Sumter, SC 29150
|
- sq. feet
|
2 baths 4 beds |
show details | |

|
#40
Browning Ridge Dr
Sumter, SC 29154
|
- sq. feet
|
2 baths 3 beds |
show details |
| Photo | Address | Area | Beds / Baths | Price | Details |
|---|---|---|---|---|---|

|
#41
Haile St
Sumter, SC 29150
|
- sq. feet
|
- baths 3 beds |
show details | |

|
#42
Beacon Dr
Sumter, SC 29154
|
- sq. feet
|
- baths - beds |
show details | |

|
#43
N Salem Ave Apt 1
Sumter, SC 29150
|
- sq. feet
|
- baths - beds |
show details | |

|
#44
Sumter Ct
Manning, SC 29102
|
- sq. feet
|
- baths - beds |
show details | |

|
#45
Briarcliff St
Manning, SC 29102
|
- sq. feet
|
- baths - beds |
show details | |

|
#46
Manchester Dr
Manning, SC 29102
|
2,366 sq. feet
|
- baths - beds |
show details | |

|
#47
Radcliff Dr
Sumter, SC 29150
|
- sq. feet
|
- baths - beds |
show details | |

|
#48
Bay Blossom Ave # 7
Sumter, SC 29150
|
- sq. feet
|
- baths - beds |
show details | |

|
#49
Highland Ave
Sumter, SC 29150
|
- sq. feet
|
- baths - beds |
show details | |

|
Check over 1 million property listings on Foreclosure.com!
|
browse all offers | |||

Latest news about housing in Pinewood, SC collected exclusively by city-data.com from local newspapers, TV, and radio stations

 | What's New or Coming To Sumter (2753 replies) |
| Looking for a helper on house build (0 replies) |
| Summerville Neighborhoods/subdivisions (15 replies) |
| Volvo /Teacher (13 replies) |
| SC isn't the spotlight on social issues right now! (167 replies) |
| Moving to Summerville very soon (23 replies) |

Median year apartment built: 1977
Household type by relationship:
Households: 781- Male householders: 67 (23 living alone), Female householders: 184 (28 living alone)
54 spouses (54 opposite-sex spouses), 0 unmarried partners, (0 opposite-sex unmarried partners), 312 children (172 natural, 140 adopted, 0 stepchildren), 0 grandchildren, 21 brothers or sisters, 17 parents, 87 foster children, 15 other relatives, 18 non-relatives
Size of family households: 47 2-persons, 55 3-persons, 84 4-persons, 4 5-persons, 4 7-or-more-persons.
Size of nonfamily households: 54 1-person.
33 married couples with children.
243 single-parent households (4 men, 239 women).
99.2% of residents of Pinewood speak English at home.
0.7% of residents speak Spanish at home (100% speak English well).
Foreign born population: 3 (0.4%)
(0.0% of them are naturalized citizens)
| Here: | 7.6 |
| State: | 6.4 |
| Here: | 4.1 |
| State: | 4.5 |

- Bedrooms in owner-occupied houses and condos in Pinewood, South Carolina
- 0no bedroom
- 01 bedroom
- 392 bedrooms
- 1163 bedrooms
- 114 bedrooms
- 45+ bedrooms

- Bedrooms in renter-occupied apartments in Pinewood, South Carolina
- 3no bedroom
- 61 bedroom
- 462 bedrooms
- 203 bedrooms
- 64 bedrooms
- 05+ bedrooms

- Cars and other vehicles available in Pinewood in owner-occupied houses/condos
- 2no vehicle
- 681 vehicle
- 622 vehicles
- 293 vehicles
- 64 vehicles
- 45+ vehicles

- Cars and other vehicles available in Pinewood in renter-occupied apartments
- 33no vehicle
- 311 vehicle
- 152 vehicles
- 03 vehicles
- 04 vehicles
- 35+ vehicles

- Rooms in owner-occupied houses in Pinewood, South Carolina
- 01 room
- 02 rooms
- 03 rooms
- 44 rooms
- 135 rooms
- 146 rooms
- 677 rooms
- 658 rooms
- 89+ rooms

- Rooms in renter-occupied apartments in Pinewood, South Carolina
- 31 room
- 62 rooms
- 183 rooms
- 384 rooms
- 115 rooms
- 06 rooms
- 07 rooms
- 08 rooms
- 69+ rooms


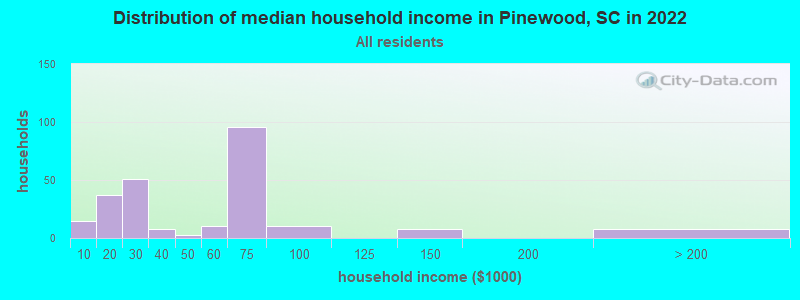
Pinewood, SC household income distribution

- 15Less than $10,000
- 37$10,000 to $19,999
- 51$20,000 to $29,999
- 8$30,000 to $39,999
- 3$40,000 to $49,999
- 10$50,000 to $59,999
- 96$60,000 to $74,999
- 10$75,000 to $99,999
- 8$125,000 to $149,999
- 8$200,000 or more
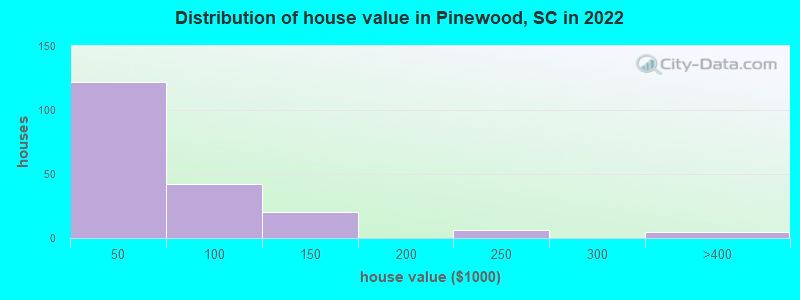
Home value of owner - occupied houses in 2022 in Pinewood, SC
-
- 4Less than $10,000
- 67$10,000 to $14,999
- 1$15,000 to $19,999
- 33$20,000 to $24,999
- 1$25,000 to $29,999
- 14$40,000 to $49,999
- 2$50,000 to $59,999
- 5$60,000 to $69,999
- 5$70,000 to $79,999
- 11$80,000 to $89,999
- 2$90,000 to $99,999
- 4$100,000 to $124,999
- 15$125,000 to $149,999
- 5$200,000 to $249,999
- 5$300,000 to $399,999
Rent paid by renters in 2022 in Pinewood, SC
-
- 23$100 to $149
- 14$300 to $349
- 2$450 to $499
- 5$650 to $699
- 21No cash rent


Percentage of workers working in this county: 60.8%
Number of people working at home: 16 (7.2% of all workers)
Travel time to work (commute)
- Less than 5 minutes: 5
- 5 to 9 minutes: 13
- 10 to 14 minutes: 14
- 15 to 19 minutes: 8
- 20 to 24 minutes: 24
- 25 to 29 minutes: 16
- 30 to 34 minutes: 32
- 35 to 39 minutes: 0
- 40 to 44 minutes: 12
- 45 to 59 minutes: 7
- 60 to 89 minutes: 48
- 90 or more minutes: 2
Means of transportation to work:
- Drove a car alone: 121 (84.0%)
- Carpooled: 15 (10.4%)
- Bus or trolley bus: 3 (2.1%)
- Walked: 5 (3.5%)

- Unemployment by race in 2022
- Unemployment rate for White non-Hispanic residents
- 3.3%Males
- 19.3%Females
- Unemployment rate for Black residents
- 4.1%Females

First ancestries reported:
- American: 53 (8.4%)
- French Canadian: 6 (1.0%)
- Swedish: 6 (1.0%)
- English: 2 (0.3%)
- Scottish: 2 (0.3%)
Most common places of birth for foreign-born residents (%):
| Pinewood: | 75.0% (3) |
| South Carolina: | 22.5% (60,774) |
Place of birth for U.S.-born residents:
- This state: 640
- Other state: 72
- Northeast: 29
- Midwest: 2
- South: 29
- West: 13
93.9% of Pinewood residents lived in the same house 1 years ago.
Out of people who lived in different houses, 32.4% lived in this county.
Out of people who lived in different counties, 0.0% lived in South Carolina.
| Pinewood: | 93.9% |
| State average: | 86.5% |
Education attainment for males 25 years and older:
- No schooling: 4
- Nursery to 4th grade: 0
- 5th and 6th grade: 0
- 7th and 8th grade: 2
- 9th grade: 0
- 10th grade: 0
- 11th grade: 8
- 12th grade, no diploma: 0
- High school graduate (or equivalency): 72
- Less than 1 year of college: 20
- Some college more than 1 year, no degree: 20
- Associate degree: 3
- Bachelor's degree: 10
- Master's degree: 4
- Professional school degree: 0
- Doctorate degree: 35

Education attainment for females 25 years and older:
- No schooling: 5
- Nursery to 4th grade: 2
- 5th and 6th grade: 0
- 7th and 8th grade: 4
- 9th grade: 1
- 10th grade: 44
- 11th grade: 0
- 12th grade, no diploma: 0
- High school graduate (or equivalency): 45
- Less than 1 year of college: 3
- Some college more than 1 year, no degree: 18
- Associate degree: 30
- Bachelor's degree: 71
- Master's degree: 1
- Professional school degree: 0
- Doctorate degree: 0


Housing units in structures:
- One, detached: 140
- One, attached: 6
- Two: 47
- Mobile homes: 115
Median worth of mobile homes: $11,826
Housing units lacking complete kitchen facilities in 2022: 2.0%
House/condo owner moved in on average 24 years ago
Renter moved in on average 3 years ago

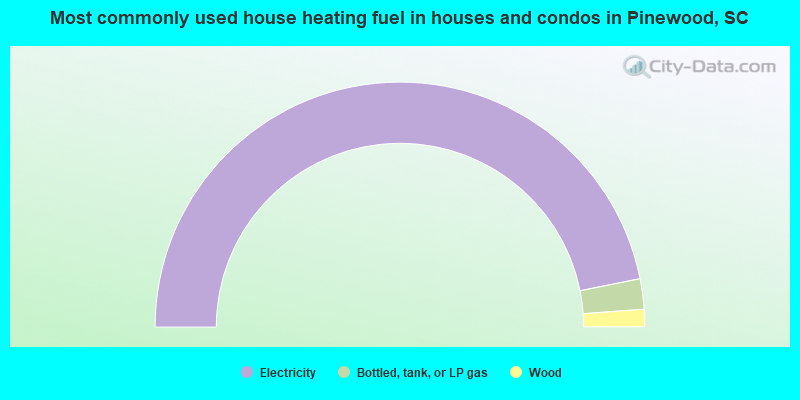
- 93.6%Electricity
- 4.0%Bottled, tank, or LP gas
- 2.3%Wood
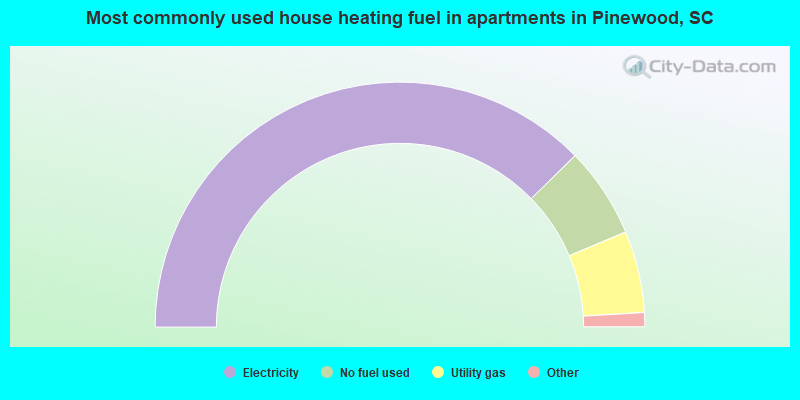
- 76.8%Electricity
- 12.2%No fuel used
- 11.0%Utility gas
Private vs. public school enrollment:
| Here: | 16.5% |
| South Carolina: | 14.4% |
| Here: | 70.6% |
| South Carolina: | 11.1% |
| Here: | 28.6% |
| South Carolina: | 21.9% |


