Pine Hills, CA (California) Houses and Residents
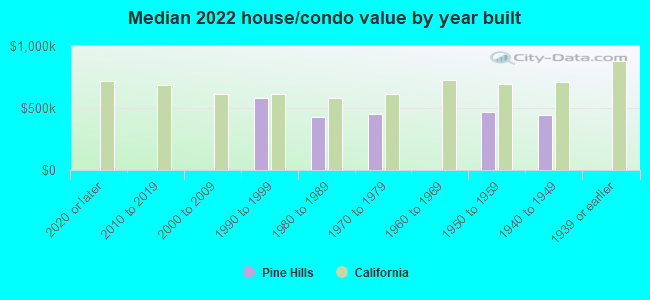
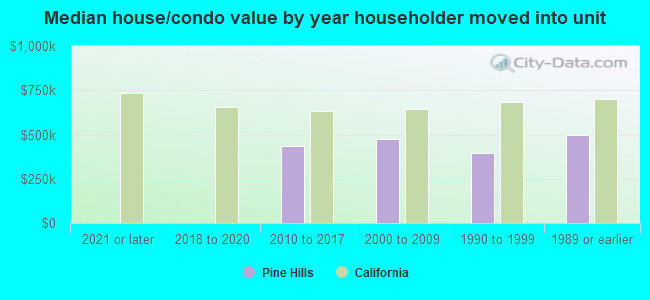
| Pine Hills: | $461,991 |
| California: | $715,900 |
Total population: 3,131 (Urban population: 1,635 (all inside urban clusters), Rural population: 1,461 (18 farm, 1,443 nonfarm))
Houses: 1,424 (1,237 occupied: 1,092 owner occupied, 187 renter occupied)
| % of renters here: | 15% |
| State: | 44% |
Housing density: 140 houses/condos per square mile
Median price asked for vacant for-sale houses and condos in 2022 in this county: $398,519.
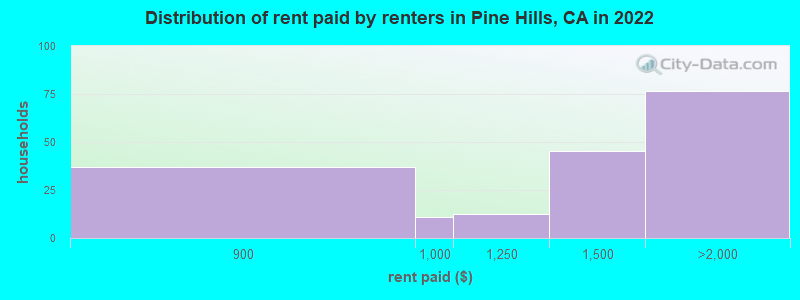
Median contract rent in 2022: $1,431 (lower quartile is $991, upper quartile is $1,663)
Median rent asked for vacant for-rent units in 2022: $1,485
Median gross rent in Pine Hills, CA in 2022: $1,464
Housing units in Pine Hills with a mortgage: 554 (153 second mortgage, 0 home equity loan, 43 both second mortgage and home equity loan)
Houses without a mortgage: 0
Median household income for houses/condos with a mortgage: $92,495
Median household income for apartments without a mortgage: $72,725
Median monthly housing costs: $1,406
Compare current foreclosures near Pine Hills, CA:
| Photo | Address | Area | Beds / Baths | Price | Details |
|---|---|---|---|---|---|

|
#1
Eeloa Ave
Rio Dell, CA 95562
|
1,151 sq. feet
|
1 baths 3 beds |
show details | |

|
#2
Myrtle Ave
Eureka, CA 95501
|
2,817 sq. feet
|
3 baths 4 beds |
show details | |

|
#3
Lincoln St
Eureka, CA 95501
|
875 sq. feet
|
1 baths 3 beds |
show details | |

|
#4
Rohnerville Rd
Fortuna, CA 95540
|
- sq. feet
|
1 baths 2 beds |
show details | |

|
#5
Tami Dr
Fortuna, CA 95540
|
1,254 sq. feet
|
2 baths 4 beds |
show details | |

|
#6
Prairie Ave
Eureka, CA 95501
|
1,488 sq. feet
|
2 baths 3 beds |
show details | |

|
#7
Union St
Eureka, CA 95503
|
- sq. feet
|
2 baths 3 beds |
show details | |

|
#8
Little Fairfield St
Eureka, CA 95503
|
- sq. feet
|
2 baths 3 beds |
show details | |

|
#9
Riverwalk Dr # 1
Fortuna, CA 95540
|
- sq. feet
|
- baths - beds |
show details | |

|
#10
N St
Fortuna, CA 95540
|
- sq. feet
|
- baths - beds |
show details |
| Photo | Address | Area | Beds / Baths | Price | Details |
|---|---|---|---|---|---|

|
#11
18th St # D
Arcata, CA 95521
|
- sq. feet
|
- baths - beds |
show details | |

|
#12
Beechwood Dr
Eureka, CA 95503
|
- sq. feet
|
- baths - beds |
show details | |

|
#13
Dean St Apt 11
Eureka, CA 95501
|
- sq. feet
|
- baths - beds |
show details | |

|
#14
8th St # 128
Eureka, CA 95501
|
- sq. feet
|
- baths - beds |
show details | |

|
#15
Spear Ave
Arcata, CA 95521
|
- sq. feet
|
- baths - beds |
show details | |

|
#16
California St
Eureka, CA 95501
|
- sq. feet
|
- baths - beds |
show details | |

|
#17
Golf Course Rd
Bayside, CA 95524
|
- sq. feet
|
- baths - beds |
show details | |

|
#18
W Del Norte St
Eureka, CA 95501
|
- sq. feet
|
- baths - beds |
show details | |

|
#19
Main St
Ferndale, CA 95536
|
- sq. feet
|
- baths - beds |
show details | |

|
#20
Windy Rd
Mckinleyville, CA 95519
|
- sq. feet
|
- baths - beds |
show details |
| Photo | Address | Area | Beds / Baths | Price | Details |
|---|---|---|---|---|---|

|
#21
Alpha St
Eureka, CA 95503
|
- sq. feet
|
- baths - beds |
show details | |

|
#22
Golden West Ct Apt C
Eureka, CA 95503
|
- sq. feet
|
- baths - beds |
show details | |

|
#23
Larissa Cir
Mckinleyville, CA 95519
|
- sq. feet
|
- baths - beds |
show details | |

|
#24
Ronald Ave
Fortuna, CA 95540
|
- sq. feet
|
- baths - beds |
show details | |

|
#25
Rebecca Ln
Arcata, CA 95521
|
- sq. feet
|
- baths - beds |
show details | |

|
#26
Escarda Ct
Arcata, CA 95521
|
- sq. feet
|
- baths - beds |
show details | |

|
#27
Mckinleyville Ave
Mckinleyville, CA 95519
|
- sq. feet
|
- baths - beds |
show details | |

|
#28
Catherine Ct
Mckinleyville, CA 95519
|
- sq. feet
|
- baths - beds |
show details | |

|
#29
Lawndale Dr
Fortuna, CA 95540
|
- sq. feet
|
- baths - beds |
show details | |

|
#30
Fieldbrook Rd
Mckinleyville, CA 95519
|
- sq. feet
|
- baths - beds |
show details |
| Photo | Address | Area | Beds / Baths | Price | Details |
|---|---|---|---|---|---|

|
#31
6th St
Fortuna, CA 95540
|
- sq. feet
|
- baths - beds |
show details | |

|
#32
10th St
Fortuna, CA 95540
|
- sq. feet
|
- baths - beds |
show details | |

|
#33
Northridge Rd
Eureka, CA 95503
|
- sq. feet
|
- baths - beds |
show details | |

|
#34
Myrtle Ave
Eureka, CA 95503
|
- sq. feet
|
- baths - beds |
show details | |

|
#35
Wrigley Rd
Eureka, CA 95503
|
- sq. feet
|
- baths - beds |
show details | |

|
#36
Paradise Ln
Eureka, CA 95503
|
- sq. feet
|
- baths - beds |
show details | |

|
#37
Cedar St
Eureka, CA 95503
|
- sq. feet
|
- baths - beds |
show details | |

|
#38
D St
Eureka, CA 95503
|
- sq. feet
|
- baths - beds |
show details | |

|
#39
Silva Ave
Eureka, CA 95503
|
- sq. feet
|
- baths - beds |
show details | |

|
#40
Kipling Dr
Eureka, CA 95503
|
- sq. feet
|
- baths - beds |
show details |
| Photo | Address | Area | Beds / Baths | Price | Details |
|---|---|---|---|---|---|

|
#41
Highland Ave
Eureka, CA 95503
|
- sq. feet
|
- baths - beds |
show details | |

|
#42
Hodgson St
Eureka, CA 95503
|
- sq. feet
|
- baths - beds |
show details | |

|
#43
H St
Eureka, CA 95501
|
- sq. feet
|
- baths - beds |
show details | |

|
#44
Myrtle Ave
Eureka, CA 95503
|
- sq. feet
|
- baths - beds |
show details | |

|
#45
Mcfarlan St
Eureka, CA 95501
|
- sq. feet
|
- baths - beds |
show details | |

|
#46
16th St
Eureka, CA 95501
|
- sq. feet
|
- baths - beds |
show details | |

|
#47
C St
Eureka, CA 95501
|
- sq. feet
|
- baths - beds |
show details | |

|
#48
15th St
Eureka, CA 95501
|
- sq. feet
|
- baths - beds |
show details | |

|
#49
Lincoln St
Eureka, CA 95501
|
- sq. feet
|
- baths - beds |
show details | |

|
Check over 1 million property listings on Foreclosure.com!
|
browse all offers | |||


 | GET REAL About San Diego Rental and Real Estate Prices (751 replies) |
| thoughts on julian ca? (81 replies) |
| What are the people like in Walnut Creek, CA? (156 replies) |
| water problems and wildfire risk? (13 replies) |

Median year apartment built: 1954
Household type by relationship:
Households: 3,479- Male householders: 561 (77 living alone), Female householders: 656 (166 living alone)
569 spouses (549 opposite-sex spouses), 95 unmarried partners, (84 opposite-sex unmarried partners), 760 children (621 natural, 67 adopted, 71 stepchildren), 210 grandchildren, 39 brothers or sisters, 77 parents, 0 foster children, 107 other relatives, 365 non-relatives
- In group quarters: 35
Size of family households: 444 2-persons, 111 3-persons, 141 4-persons, 116 5-persons, 4 6-persons, 18 7-or-more-persons.
Size of nonfamily households: 253 1-person, 151 2-persons, 21 7-or-more-persons.
390 married couples with children.
145 single-parent households (13 men, 132 women).
88.7% of residents of Pine Hills speak English at home.
9.5% of residents speak Spanish at home (72% speak English very well, 28% speak English well).
0.1% of residents speak other Indo-European language at home (100% speak English very well).
1.7% of residents speak Asian or Pacific Island language at home (39% speak English well, 61% speak English not well).
Foreign born population: 327 (9.4%)
(55.0% of them are naturalized citizens)
| Here: | 6.0 |
| State: | 6.0 |
| Here: | 3.3 |
| State: | 3.9 |
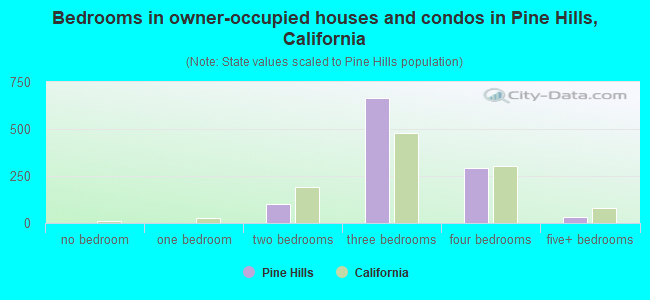
- Bedrooms in owner-occupied houses and condos in Pine Hills, California
- 0no bedroom
- 01 bedroom
- 1032 bedrooms
- 6643 bedrooms
- 2934 bedrooms
- 325+ bedrooms
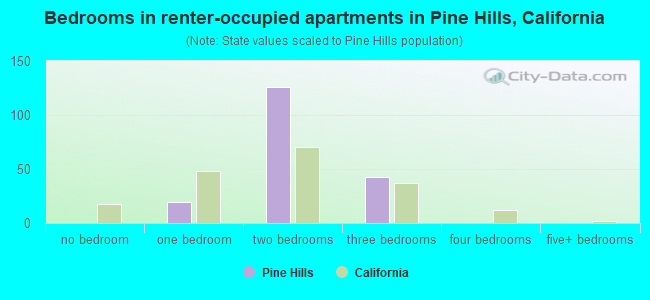
- Bedrooms in renter-occupied apartments in Pine Hills, California
- 0no bedroom
- 191 bedroom
- 1262 bedrooms
- 433 bedrooms
- 04 bedrooms
- 05+ bedrooms
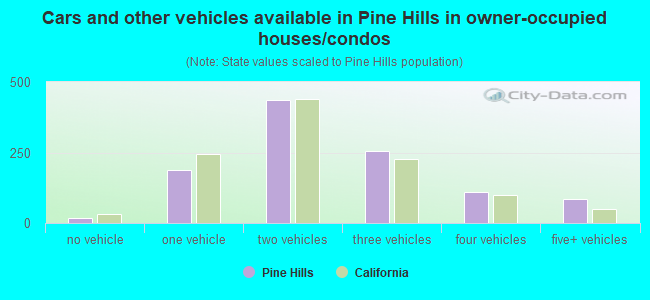
- Cars and other vehicles available in Pine Hills in owner-occupied houses/condos
- 16no vehicle
- 1871 vehicle
- 4372 vehicles
- 2553 vehicles
- 1114 vehicles
- 865+ vehicles
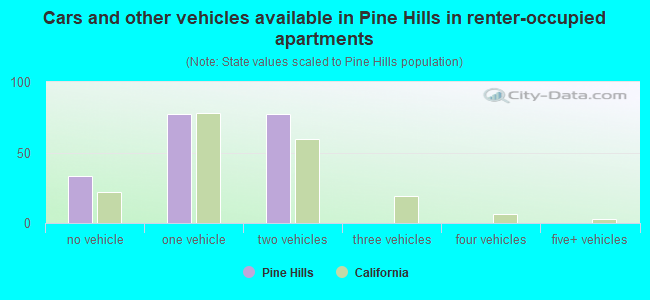
- Cars and other vehicles available in Pine Hills in renter-occupied apartments
- 33no vehicle
- 771 vehicle
- 772 vehicles
- 03 vehicles
- 04 vehicles
- 05+ vehicles
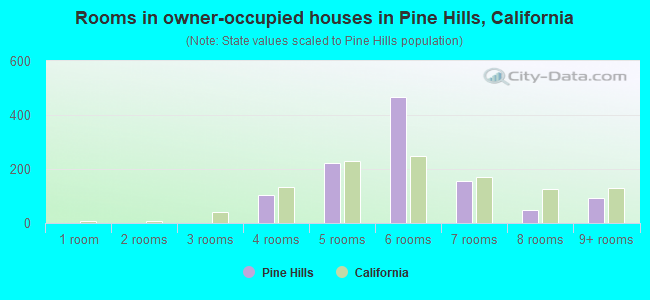
- Rooms in owner-occupied houses in Pine Hills, California
- 01 room
- 02 rooms
- 03 rooms
- 1034 rooms
- 2225 rooms
- 4686 rooms
- 1577 rooms
- 498 rooms
- 939+ rooms
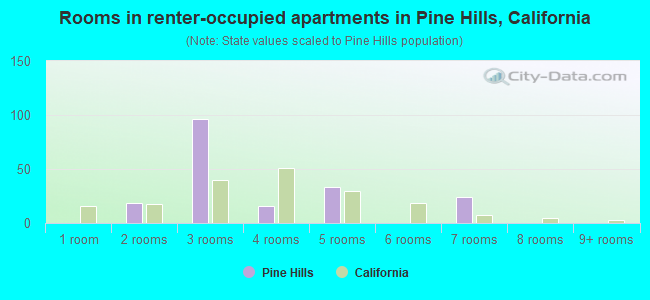
- Rooms in renter-occupied apartments in Pine Hills, California
- 01 room
- 192 rooms
- 963 rooms
- 164 rooms
- 335 rooms
- 06 rooms
- 247 rooms
- 08 rooms
- 09+ rooms
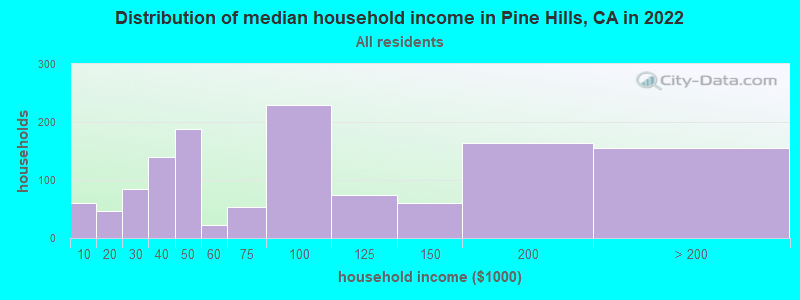
Pine Hills, CA household income distribution

- 60Less than $10,000
- 46$10,000 to $19,999
- 84$20,000 to $29,999
- 139$30,000 to $39,999
- 188$40,000 to $49,999
- 22$50,000 to $59,999
- 53$60,000 to $74,999
- 230$75,000 to $99,999
- 74$100,000 to $124,999
- 61$125,000 to $149,999
- 164$150,000 to $199,999
- 156$200,000 or more
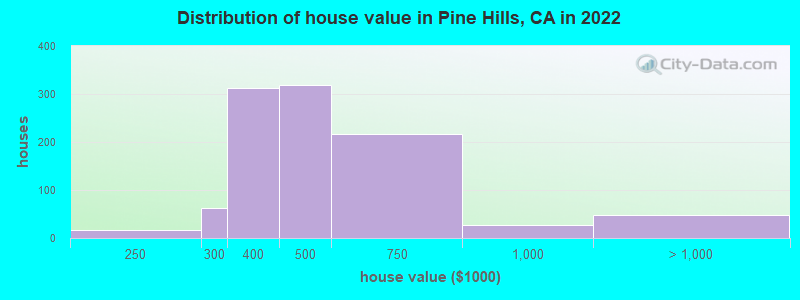
Home value of owner - occupied houses in 2022 in Pine Hills, CA
-
- 17$200,000 to $249,999
- 62$250,000 to $299,999
- 311$300,000 to $399,999
- 318$400,000 to $499,999
- 216$500,000 to $749,999
- 26$750,000 to $999,999
- 32$1,000,000 to $1,499,999
- 14$2,000,000 or more
Rent paid by renters in 2022 in Pine Hills, CA
-
- 36$800 to $899
- 10$900 to $999
- 12$1,000 to $1,249
- 45$1,250 to $1,499
- 76$1,500 to $1,999
Percentage of workers working in this county: 91.9%
Number of people working at home: 183 (14.4% of all workers)
Travel time to work (commute)
- Less than 5 minutes: 0
- 5 to 9 minutes: 122
- 10 to 14 minutes: 402
- 15 to 19 minutes: 416
- 20 to 24 minutes: 49
- 25 to 29 minutes: 18
- 30 to 34 minutes: 15
- 35 to 39 minutes: 0
- 40 to 44 minutes: 22
- 45 to 59 minutes: 19
- 60 to 89 minutes: 62
- 90 or more minutes: 9
Means of transportation to work:
- Drove a car alone: 1,164 (81.3%)
- Carpooled: 191 (13.3%)
- Bus or trolley bus: 25 (1.7%)
- Bicycle: 6 (0.4%)
- Walked: 14 (1.0%)
- Worked at home: 32 (2.2%)
- Unemployment by race in 2022
- Unemployment rate for White non-Hispanic residents
- 4.1%Males
- Unemployment rate for Black residents
- 100.0%Males
- Unemployment rate for Hispanic or Latino residents
- 14.6%Males
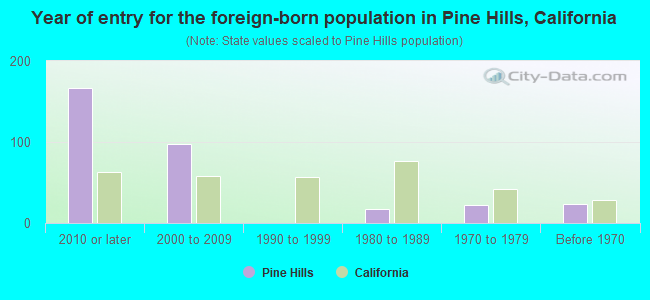
- Year of entry for the foreign-born population in Pine Hills, California
- 1672010 or later
- 972000 to 2009
- 01990 to 1999
- 171980 to 1989
- 221970 to 1979
- 23Before 1970
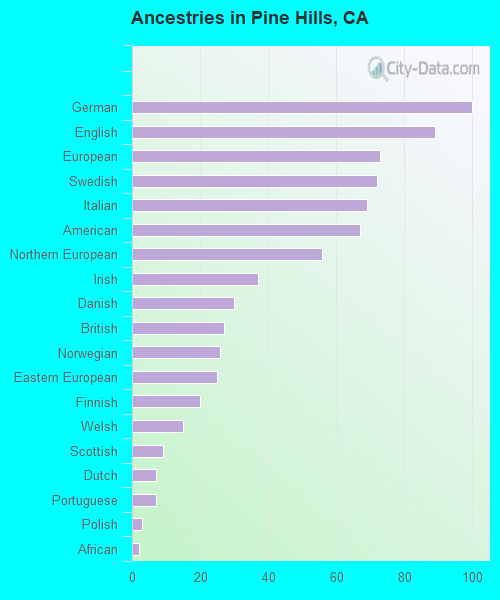
First ancestries reported:
- German: 100 (6.4%)
- English: 89 (5.7%)
- European: 73 (4.7%)
- Swedish: 72 (4.6%)
- Italian: 69 (4.4%)
- American: 67 (4.3%)
- Northern European: 56 (3.6%)
- Irish: 37 (2.4%)
- Danish: 30 (1.9%)
- British: 27 (1.7%)
- Norwegian: 26 (1.7%)
- Eastern European: 25 (1.6%)
- Finnish: 20 (1.3%)
- Welsh: 15 (1.0%)
- Scottish: 9 (0.6%)
- Dutch: 7 (0.5%)
- Portuguese: 7 (0.5%)
- Polish: 3 (0.2%)
- African: 2 (0.1%)
Most common places of birth for foreign-born residents (%):
| Pine Hills: | 27.7% (86) |
| California: | 1.2% (127,477) |
| Pine Hills: | 23.2% (72) |
| California: | 0.7% (74,025) |
| Pine Hills: | 22.6% (70) |
| California: | 0.5% (53,222) |
| Pine Hills: | 11.6% (36) |
| California: | 7.8% (818,297) |
| Pine Hills: | 7.1% (22) |
| California: | 0.3% (28,176) |
| Pine Hills: | 3.5% (11) |
| California: | 1.7% (176,274) |
| Pine Hills: | 2.3% (7) |
| California: | 0.7% (73,304) |
Place of birth for U.S.-born residents:
- This state: 2,317
- Other state: 851
- Northeast: 107
- Midwest: 350
- South: 181
- West: 204
82.6% of Pine Hills residents lived in the same house 1 years ago.
Out of people who lived in different houses, 39.3% lived in this county.
Out of people who lived in different counties, 89.1% lived in California.
| Pine Hills: | 82.6% |
| State average: | 88.9% |
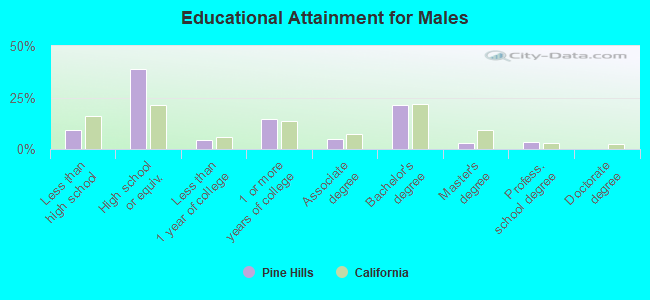
Education attainment for males 25 years and older:
- No schooling: 0
- Nursery to 4th grade: 0
- 5th and 6th grade: 0
- 7th and 8th grade: 16
- 9th grade: 6
- 10th grade: 0
- 11th grade: 67
- 12th grade, no diploma: 22
- High school graduate (or equivalency): 474
- Less than 1 year of college: 56
- Some college more than 1 year, no degree: 181
- Associate degree: 61
- Bachelor's degree: 264
- Master's degree: 38
- Professional school degree: 42
- Doctorate degree: 0
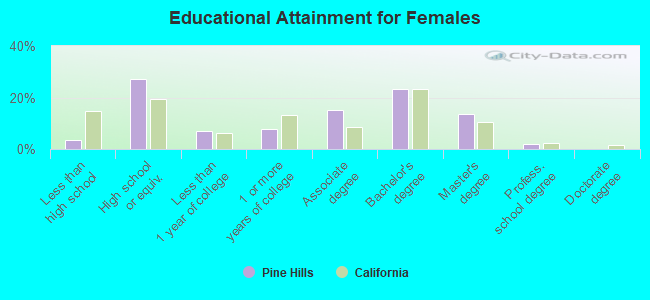
Education attainment for females 25 years and older:
- No schooling: 48
- Nursery to 4th grade: 0
- 5th and 6th grade: 0
- 7th and 8th grade: 0
- 9th grade: 0
- 10th grade: 0
- 11th grade: 0
- 12th grade, no diploma: 0
- High school graduate (or equivalency): 360
- Less than 1 year of college: 94
- Some college more than 1 year, no degree: 105
- Associate degree: 198
- Bachelor's degree: 306
- Master's degree: 181
- Professional school degree: 27
- Doctorate degree: 0


Housing units in structures:
- One, detached: 1,288
- One, attached: 74
- Two: 14
- 10 to 19: 47
Housing units lacking complete kitchen facilities in 2022: 5.4%
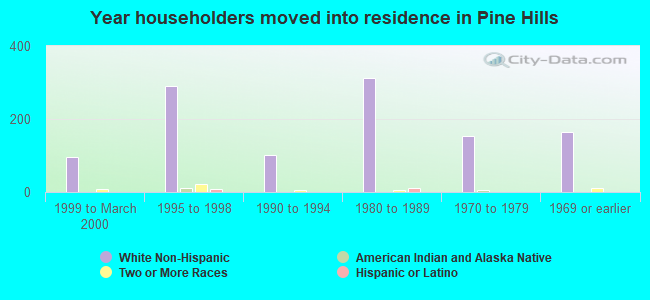
House/condo owner moved in on average 19 years ago
Renter moved in on average 3 years ago
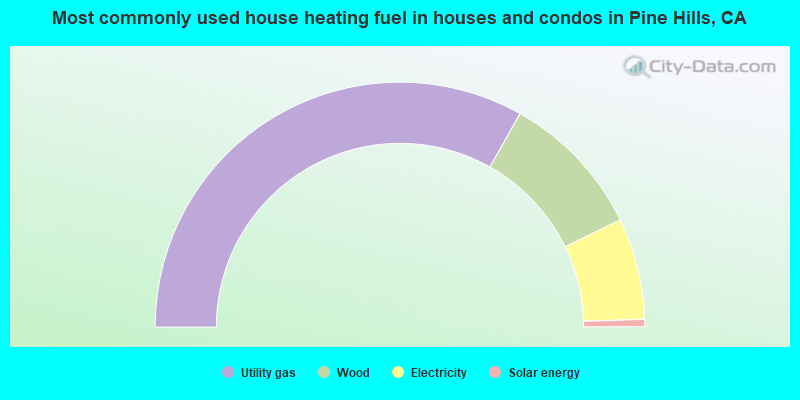
- 66.4%Utility gas
- 19.3%Wood
- 13.4%Electricity
- 1.0%Solar energy
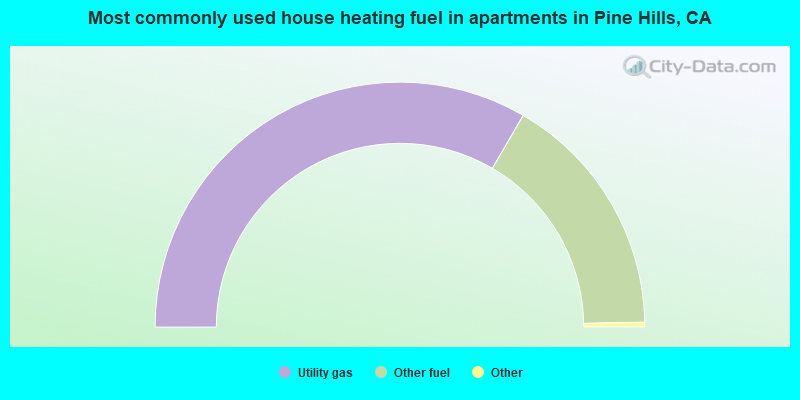
- 67.2%Utility gas
- 32.8%Other fuel
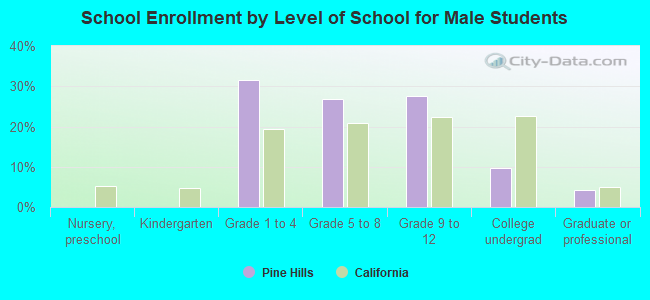
Private vs. public school enrollment:
| Here: | 0.0% |
| California: | 10.5% |
| Here: | 66.1% |
| California: | 8.5% |
| Here: | 0.0% |
| California: | 15.9% |