Pinardville, NH (New Hampshire) Houses and Residents
| Pinardville: | $277,196 |
| New Hampshire: | $384,700 |
Mean price in 2022:
Detached houses: $310,025
Here: $310,025 State: $491,479 Townhouses or other attached units: $207,727
Here: $207,727 State: $361,001 In 2-unit structures: $348,483
Here: $348,483 State: $368,847 In 5-or-more-unit structures: $186,065
Here: $186,065 State: $274,068
Total population: 4,780 (All urban)
Houses: 2,187 (2,118 occupied: 1,356 owner occupied, 752 renter occupied)
| % of renters here: | 36% |
| State: | 28% |
Housing density: 1,324 houses/condos per square mile
Median price asked for vacant for-sale houses and condos in 2022 in this county: $219,786.
Median contract rent in 2022: $1,083
Median gross rent in Pinardville, NH in 2022: $1,239
Housing units in Pinardville with a mortgage: 1,035 (52 second mortgage, 0 home equity loan, 54 both second mortgage and home equity loan)
Houses without a mortgage: 67
Median household income for houses/condos with a mortgage: $81,973
Median household income for apartments without a mortgage: $42,039
Median monthly housing costs: $1,457
Compare current foreclosures near Pinardville, NH:
| Photo | Address | Area | Beds / Baths | Price | Details |
|---|---|---|---|---|---|

|
#1
-8 Pleasant Street
Suncook, NH 03275
|
2,116 sq. feet
|
2 baths 5 beds |
show details | |

|
#2
Everett St
Derry, NH 03038
|
1,525 sq. feet
|
1 baths 3 beds |
show details | |

|
#3
Juniper Dr
Amherst, NH 03031
|
3,364 sq. feet
|
4 baths 4 beds |
show details | |

|
#4
Redfield Cir
Derry, NH 03038
|
2,124 sq. feet
|
3 baths 4 beds |
show details | |

|
#5
Mont Vernon Rd
New Boston, NH 03070
|
3,854 sq. feet
|
2 baths 3 beds |
show details | |

|
#6
Hampshire Dr
Concord, NH 03301
|
858 sq. feet
|
1 baths 2 beds |
show details | |

|
#7
Michael Ave
Derry, NH 03038
|
1,536 sq. feet
|
1 baths 4 beds |
show details | |

|
#8
Willow Creek Dr # 42
Hudson, NH 03051
|
1,120 sq. feet
|
1 baths 2 beds |
show details | |

|
#9
Amherst St
Amherst, NH 03031
|
- sq. feet
|
4 baths 3 beds |
show details | |

|
#10
Elm St
Manchester, NH 03104
|
4,352 sq. feet
|
3 baths 3 beds |
show details |
| Photo | Address | Area | Beds / Baths | Price | Details |
|---|---|---|---|---|---|

|
#11
Blucher St
Manchester, NH 03102
|
2,448 sq. feet
|
2 baths 3 beds |
show details | |

|
#12
High St
Derry, NH 03038
|
2,149 sq. feet
|
3 baths 4 beds |
show details | |

|
#13
Donati Dr
Hooksett, NH 03106
|
2,269 sq. feet
|
3 baths 5 beds |
show details | |

|
#14
Brook St
Derry, NH 03038
|
1,476 sq. feet
|
1 baths 4 beds |
show details | |

|
#15
Wells St
Manchester, NH 03104
|
2,800 sq. feet
|
1 baths 3 beds |
show details | |

|
#16
Brown Ave
Manchester, NH 03103
|
1,296 sq. feet
|
1 baths 4 beds |
show details | |

|
#17
Wedgewood Cir Unit 9
Hooksett, NH 03106
|
1,942 sq. feet
|
2 baths 2 beds |
show details | |

|
#18
Cypress Rd
Milford, NH 03055
|
1,929 sq. feet
|
1 baths 3 beds |
show details | |

|
#19
S Fruit St
Concord, NH 03301
|
1,768 sq. feet
|
2 baths 4 beds |
show details | |

|
#20
Whitehall Rd
Hooksett, NH 03106
|
2,740 sq. feet
|
2 baths 5 beds |
show details |
| Photo | Address | Area | Beds / Baths | Price | Details |
|---|---|---|---|---|---|

|
#21
Auburn Rd
Hooksett, NH 03106
|
1,800 sq. feet
|
2 baths 3 beds |
show details | |

|
#22
Courthouse Rd
Amherst, NH 03031
|
1,391 sq. feet
|
1 baths 3 beds |
show details | |

|
#23
Hidden Ranch Dr
Hooksett, NH 03106
|
903 sq. feet
|
1 baths 1 beds |
show details | |

|
#24
Pinnacle St
Hooksett, NH 03106
|
2,238 sq. feet
|
2 baths 3 beds |
show details | |

|
#25
Portage Rd
Goffstown, NH 03045
|
1,886 sq. feet
|
1 baths 3 beds |
show details | |

|
#26
Westwood Dr
Manchester, NH 03103
|
2,086 sq. feet
|
1 baths 3 beds |
show details | |

|
#27
Embassy Ave
Hooksett, NH 03106
|
816 sq. feet
|
1 baths 2 beds |
show details | |

|
#28
Pine Blf # 3
Derry, NH 03038
|
1,872 sq. feet
|
2 baths 3 beds |
show details | |

|
#29
Pine Blf
Derry, NH 03038
|
1,872 sq. feet
|
2 baths 3 beds |
show details | |

|
#30
Normand St
Manchester, NH 03109
|
1,502 sq. feet
|
2 baths 3 beds |
show details |
| Photo | Address | Area | Beds / Baths | Price | Details |
|---|---|---|---|---|---|

|
#31
Skyline Ave
Hooksett, NH 03106
|
928 sq. feet
|
2 baths 2 beds |
show details | |

|
#32
Delaware Ave # 1
Manchester, NH 03104
|
2,946 sq. feet
|
3 baths 8 beds |
show details | |

|
#33
Ridgefield Dr
Milford, NH 03055
|
1,040 sq. feet
|
1 baths 3 beds |
show details | |

|
#34
Megan Dr
Manchester, NH 03109
|
2,244 sq. feet
|
1 baths 3 beds |
show details | |

|
#35
Fairview St
Manchester, NH 03102
|
1,320 sq. feet
|
2 baths 3 beds |
show details | |

|
#36
Van Ger Dr
Bow, NH 03304
|
2,498 sq. feet
|
2 baths 3 beds |
show details | |

|
#37
Brook St
Derry, NH 03038
|
1,666 sq. feet
|
1 baths 4 beds |
show details | |

|
#38
Fiddlehead Ln
Chester, NH 03036
|
2,682 sq. feet
|
2 baths 4 beds |
show details | |

|
#39
Etta Ln
Weare, NH 03281
|
1,425 sq. feet
|
1 baths 3 beds |
show details | |

|
#40
Pierce Ave
Derry, NH 03038
|
1,356 sq. feet
|
1 baths 3 beds |
show details |
| Photo | Address | Area | Beds / Baths | Price | Details |
|---|---|---|---|---|---|

|
#41
Northfield Rd
Amherst, NH 03031
|
1,688 sq. feet
|
1 baths 3 beds |
show details | |

|
#42
Fairview Ave
Derry, NH 03038
|
1,510 sq. feet
|
1 baths 3 beds |
show details | |

|
#43
Bypass 28
Derry, NH 03038
|
2,300 sq. feet
|
2 baths 4 beds |
show details | |

|
#44
Gayle Dr
Derry, NH 03038
|
1,246 sq. feet
|
1 baths 3 beds |
show details | |

|
#45
Silvestri Cir Unit 22
Derry, NH 03038
|
685 sq. feet
|
1 baths 1 beds |
show details | |

|
#46
1/2 Floyd Rd
Derry, NH 03038
|
2,312 sq. feet
|
2 baths 4 beds |
show details | |

|
#47
Town Farm Rd
Chester, NH 03036
|
3,580 sq. feet
|
3 baths 4 beds |
show details | |

|
#48
Brookview Dr
Derry, NH 03038
|
2,236 sq. feet
|
2 baths 4 beds |
show details | |

|
#49
Lawrence St
Derry, NH 03038
|
2,124 sq. feet
|
2 baths 3 beds |
show details | |

|
Check over 1 million property listings on Foreclosure.com!
|
browse all offers | |||

Latest news about housing in Pinardville, NH collected exclusively by city-data.com from local newspapers, TV, and radio stations

 | Questions about Goffstown area (5 replies) |
| What town in New Hampshire most closely represents or reminds you of small town America? (857 replies) |
| Goffstown, NH (13 replies) |

Median year apartment built: 1986
Household type by relationship:
Households: 4,895- Male householders: 771 (146 living alone), Female householders: 1,338 (641 living alone)
908 spouses (908 opposite-sex spouses), 125 unmarried partners, (125 opposite-sex unmarried partners), 1,349 children (1,247 natural, 0 adopted, 101 stepchildren), 78 grandchildren, 72 brothers or sisters, 36 parents, 0 foster children, 43 other relatives, 89 non-relatives
- In group quarters: 81
Size of family households: 637 2-persons, 281 3-persons, 177 4-persons, 94 5-persons, 28 6-persons, 19 7-or-more-persons.
Size of nonfamily households: 760 1-person, 91 2-persons.
531 married couples with children.
258 single-parent households (37 men, 221 women).
89.9% of residents of Pinardville speak English at home.
1.3% of residents speak Spanish at home (24% speak English very well, 76% speak English well).
7.4% of residents speak other Indo-European language at home (59% speak English very well, 41% speak English well).
1.1% of residents speak Asian or Pacific Island language at home (100% speak English very well).
Foreign born population: 426 (8.7%)
(102.8% of them are naturalized citizens)
| Here: | 5.5 |
| State: | 6.4 |
| Here: | 3.8 |
| State: | 4.0 |

- Bedrooms in owner-occupied houses and condos in Pinardville, New Hampshire
- 15no bedroom
- 01 bedroom
- 6382 bedrooms
- 4683 bedrooms
- 2104 bedrooms
- 265+ bedrooms

- Bedrooms in renter-occupied apartments in Pinardville, New Hampshire
- 0no bedroom
- 3151 bedroom
- 2702 bedrooms
- 1443 bedrooms
- 04 bedrooms
- 235+ bedrooms

- Cars and other vehicles available in Pinardville in owner-occupied houses/condos
- 48no vehicle
- 5101 vehicle
- 5442 vehicles
- 1373 vehicles
- 1174 vehicles
- 05+ vehicles

- Cars and other vehicles available in Pinardville in renter-occupied apartments
- 40no vehicle
- 5201 vehicle
- 1862 vehicles
- 73 vehicles
- 04 vehicles
- 05+ vehicles

- Rooms in owner-occupied houses in Pinardville, New Hampshire
- 151 room
- 02 rooms
- 03 rooms
- 2424 rooms
- 4705 rooms
- 3466 rooms
- 1747 rooms
- 168 rooms
- 949+ rooms

- Rooms in renter-occupied apartments in Pinardville, New Hampshire
- 01 room
- 1492 rooms
- 1583 rooms
- 2124 rooms
- 865 rooms
- 436 rooms
- 77 rooms
- 748 rooms
- 239+ rooms


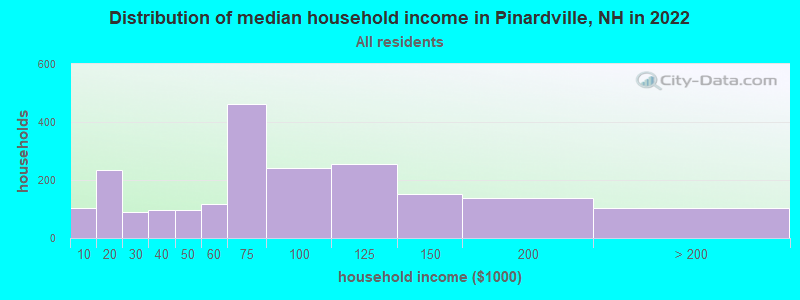
Pinardville, NH household income distribution

- 103Less than $10,000
- 234$10,000 to $19,999
- 89$20,000 to $29,999
- 97$30,000 to $39,999
- 96$40,000 to $49,999
- 116$50,000 to $59,999
- 463$60,000 to $74,999
- 240$75,000 to $99,999
- 255$100,000 to $124,999
- 151$125,000 to $149,999
- 139$150,000 to $199,999
- 104$200,000 or more
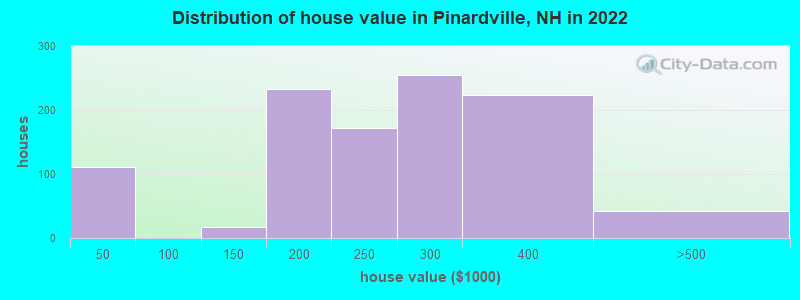
Home value of owner - occupied houses in 2022 in Pinardville, NH
-
- 27$25,000 to $29,999
- 83$35,000 to $39,999
- 17$125,000 to $149,999
- 123$150,000 to $174,999
- 109$175,000 to $199,999
- 171$200,000 to $249,999
- 253$250,000 to $299,999
- 223$300,000 to $399,999
- 39$400,000 to $499,999
- 3$500,000 to $749,999
Rent paid by renters in 2022 in Pinardville, NH
-
- 76$200 to $249
- 34$250 to $299
- 16$350 to $399
- 32$450 to $499
- 11$650 to $699
- 39$900 to $999
- 140$1,000 to $1,249
- 176$1,250 to $1,499
- 50$1,500 to $1,999
- 82No cash rent


Percentage of workers working in this county: 74.5%
Number of people working at home: 165 (6.0% of all workers)
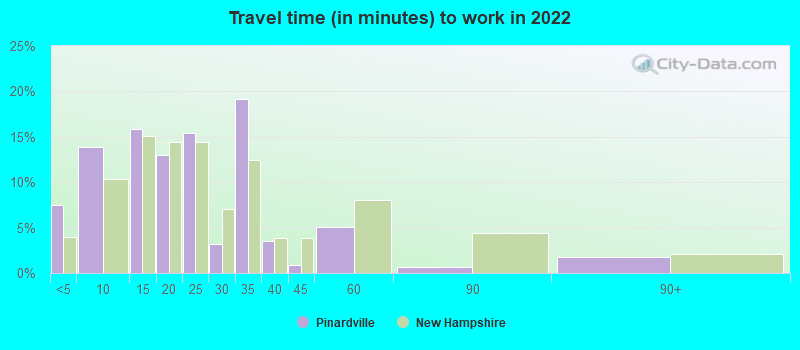
Travel time to work (commute)
- Less than 5 minutes: 91
- 5 to 9 minutes: 189
- 10 to 14 minutes: 375
- 15 to 19 minutes: 516
- 20 to 24 minutes: 369
- 25 to 29 minutes: 87
- 30 to 34 minutes: 303
- 35 to 39 minutes: 51
- 40 to 44 minutes: 97
- 45 to 59 minutes: 129
- 60 to 89 minutes: 194
- 90 or more minutes: 58
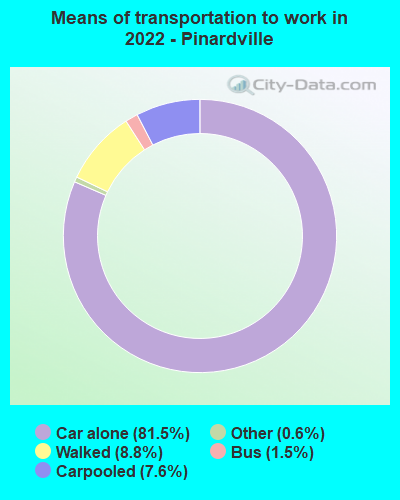
Means of transportation to work:
- Drove a car alone: 1,669 (71.3%)
- Carpooled: 199 (8.5%)
- Bus: 16 (0.7%)
- Taxi: 14 (0.6%)
- Walked: 187 (8.0%)
- Worked at home: 165 (7.1%)

- Unemployment by race in 2022
- Unemployment rate for White non-Hispanic residents
- 0.2%Males
- 0.3%Females
- Unemployment rate for other race residents
- 27.8%Males
- Unemployment rate for Hispanic or Latino residents
- 14.4%Males

- Year of entry for the foreign-born population in Pinardville, New Hampshire
- 282010 or later
- 1062000 to 2009
- 2161990 to 1999
- 71980 to 1989
- 141970 to 1979
- 192Before 1970

First ancestries reported:
- French Canadian: 409 (17.9%)
- American: 357 (15.6%)
- Irish: 302 (13.2%)
- Yugoslavian: 208 (9.1%)
- French: 176 (7.7%)
- Czech: 99 (4.3%)
- Italian: 56 (2.5%)
- Ukrainian: 46 (2.0%)
- Canadian: 37 (1.6%)
- German: 36 (1.6%)
- English: 30 (1.3%)
- Welsh: 28 (1.2%)
- Scotch-Irish: 26 (1.1%)
- Scottish: 13 (0.6%)
- Polish: 2 (0.09%)
Most common places of birth for foreign-born residents (%):
| Pinardville: | 30.6% (130) |
| New Hampshire: | 1.3% (1,068) |
| Pinardville: | 28.7% (122) |
| New Hampshire: | 1.6% (1,351) |
| Pinardville: | 17.6% (75) |
| New Hampshire: | 9.1% (7,618) |
| Pinardville: | 10.4% (44) |
| New Hampshire: | 3.3% (2,768) |
| Pinardville: | 5.2% (22) |
| New Hampshire: | 1.3% (1,066) |
| Pinardville: | 2.1% (9) |
| New Hampshire: | 0.2% (131) |
Place of birth for U.S.-born residents:
- This state: 2,903
- Other state: 1,609
- Northeast: 1,067
- Midwest: 79
- South: 301
- West: 163
87.0% of Pinardville residents lived in the same house 1 years ago.
Out of people who lived in different houses, 34.1% lived in this county.
Out of people who lived in different counties, 52.9% lived in New Hampshire.
| Pinardville: | 87.0% |
| State average: | 89.8% |
Education attainment for males 25 years and older:
- No schooling: 0
- Nursery to 4th grade: 0
- 5th and 6th grade: 0
- 7th and 8th grade: 40
- 9th grade: 0
- 10th grade: 24
- 11th grade: 0
- 12th grade, no diploma: 122
- High school graduate (or equivalency): 569
- Less than 1 year of college: 100
- Some college more than 1 year, no degree: 226
- Associate degree: 168
- Bachelor's degree: 280
- Master's degree: 38
- Professional school degree: 0
- Doctorate degree: 0

Education attainment for females 25 years and older:
- No schooling: 27
- Nursery to 4th grade: 0
- 5th and 6th grade: 7
- 7th and 8th grade: 31
- 9th grade: 6
- 10th grade: 32
- 11th grade: 12
- 12th grade, no diploma: 0
- High school graduate (or equivalency): 490
- Less than 1 year of college: 41
- Some college more than 1 year, no degree: 303
- Associate degree: 199
- Bachelor's degree: 407
- Master's degree: 351
- Professional school degree: 0
- Doctorate degree: 11


Housing units in structures:
- One, detached: 847
- One, attached: 352
- Two: 192
- 3 or 4: 32
- 5 to 9: 68
- 10 to 19: 105
- 20 to 49: 386
- 50 or more: 201
House/condo owner moved in on average 15 years ago
Renter moved in on average 1 years ago

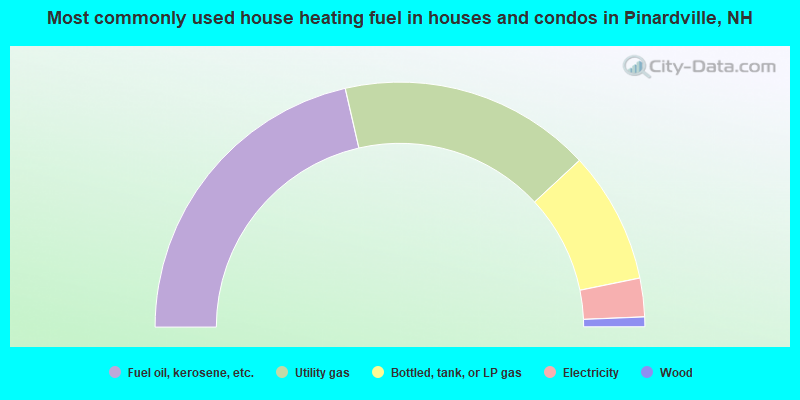
- 42.8%Fuel oil, kerosene, etc.
- 33.3%Utility gas
- 17.4%Bottled, tank, or LP gas
- 5.1%Electricity
- 1.3%Wood
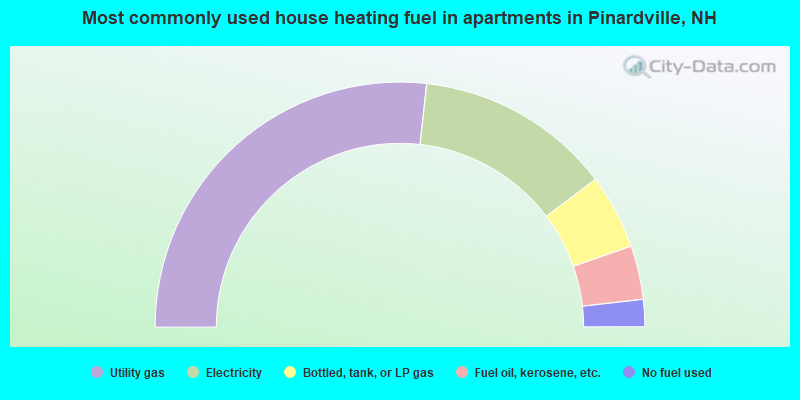
- 53.5%Utility gas
- 25.9%Electricity
- 9.9%Bottled, tank, or LP gas
- 7.1%Fuel oil, kerosene, etc.
- 3.6%No fuel used
Private vs. public school enrollment:
| Here: | 17.2% |
| New Hampshire: | 11.4% |
| Here: | 0.0% |
| New Hampshire: | 14.0% |
| Here: | 36.4% |
| New Hampshire: | 38.0% |


