Pike Creek, DE (Delaware) Houses and Residents
| Pike Creek: | $422,216 |
| Delaware: | $337,200 |
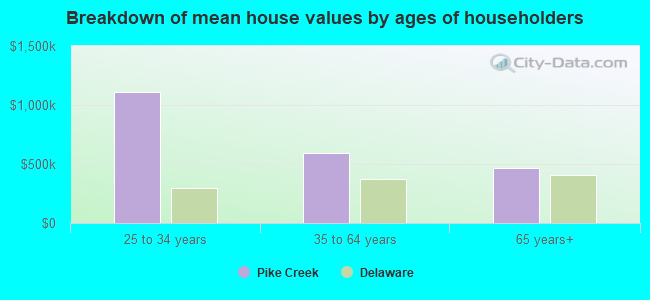
Mean price in 2022:
Detached houses: $533,630
Here: $533,630 State: $419,599 Townhouses or other attached units: $380,265
Here: $380,265 State: $291,415 In 3-to-4-unit structures: $312,887
Here: $312,887 State: $543,616 In 5-or-more-unit structures: $365,817
Here: $365,817 State: $212,751
Total population: 7,898 (All urban)
Houses: 2,800 (2,738 occupied: 2,309 owner occupied, 438 renter occupied)
| % of renters here: | 16% |
| State: | 26% |
Housing density: 457 houses/condos per square mile
Median price asked for vacant for-sale houses and condos in 2022 in this county: $238,015.
Median contract rent in 2022: $1,906 (lower quartile is $1,659, upper quartile is over $2,000)
Median rent asked for vacant for-rent units in 2022: $2,154
Median gross rent in Pike Creek, DE in 2022: over $2,000
Housing units in Pike Creek with a mortgage: 1,420 (269 second mortgage, 0 home equity loan, 265 both second mortgage and home equity loan)
Houses without a mortgage: 39
Median household income for houses/condos with a mortgage: $160,499
Median household income for apartments without a mortgage: $91,905
Median monthly housing costs: $1,757
Compare current foreclosures near Pike Creek, DE:
| Photo | Address | Area | Beds / Baths | Price | Details |
|---|---|---|---|---|---|

|
#1
N Norman Ave
Penns Grove, NJ 08069
|
882 sq. feet
|
1 baths 2 beds |
$74,900
|
show details |

|
#2
W Broadway
Salem, NJ 08079
|
2,869 sq. feet
|
2 baths 3 beds |
$90,900
|
show details |

|
#3
N Pine St
Wilmington, DE 19802
|
1,125 sq. feet
|
1 baths 3 beds |
$199,900
|
show details |

|
#4
Richard Wilson Dr
Coatesville, PA 19320
|
1,232 sq. feet
|
2 baths 3 beds |
$77,932
|
show details |

|
#5
E Miner St
West Chester, PA 19382
|
2,018 sq. feet
|
2 baths 5 beds |
$201,786
|
show details |

|
#6
Schoolview Ln
Oxford, PA 19363
|
3,504 sq. feet
|
2 baths 4 beds |
$346,389
|
show details |

|
#7
Media Rd
Oxford, PA 19363
|
1,155 sq. feet
|
1 baths 2 beds |
$211,938
|
show details |

|
#8
Flint Hill Rd
Landenberg, PA 19350
|
960 sq. feet
|
1 baths 2 beds |
$75,282
|
show details |

|
#9
Mimosa Cir
Kennett Square, PA 19348
|
2,024 sq. feet
|
2 baths 3 beds |
$500,493
|
show details |

|
#10
Birkdale Cir
Avondale, PA 19311
|
3,334 sq. feet
|
2 baths 4 beds |
$368,645
|
show details |
| Photo | Address | Area | Beds / Baths | Price | Details |
|---|---|---|---|---|---|

|
#11
S Guernsey Rd
West Grove, PA 19390
|
2,400 sq. feet
|
3 baths 6 beds |
$283,973
|
show details |

|
#12
Ewing Rd
Cochranville, PA 19330
|
3,110 sq. feet
|
1 baths 6 beds |
$471,404
|
show details |

|
#13
Coventry Ln
West Chester, PA 19382
|
1,580 sq. feet
|
2 baths 3 beds |
$205,686
|
show details |

|
#14
Barnsley Rd
Oxford, PA 19363
|
1,288 sq. feet
|
1 baths 3 beds |
$176,718
|
show details |

|
#15
Huntington Cir
Coatesville, PA 19320
|
3,124 sq. feet
|
3 baths 4 beds |
$71,206
|
show details |

|
#16
Larchwood Rd
West Chester, PA 19382
|
2,276 sq. feet
|
2 baths 3 beds |
$3,640
|
show details |

|
#17
Poorhouse Rd
Downingtown, PA 19335
|
2,402 sq. feet
|
2 baths 3 beds |
$496,564
|
show details |

|
#18
Conner Rd
Oxford, PA 19363
|
1,568 sq. feet
|
2 baths 3 beds |
$217,831
|
show details |

|
#19
Walnut Valley Rd
Chadds Ford, PA 19317
|
2,248 sq. feet
|
2 baths 3 beds |
$518,830
|
show details |

|
#20
Gap Newport Pike
Avondale, PA 19311
|
1,094 sq. feet
|
1 baths 3 beds |
$10,236
|
show details |
| Photo | Address | Area | Beds / Baths | Price | Details |
|---|---|---|---|---|---|

|
#21
Township Rd
Lincoln University, PA 19352
|
1,596 sq. feet
|
1 baths 2 beds |
$273,125
|
show details |

|
#22
Hazel Ave
Kennett Square, PA 19348
|
2,344 sq. feet
|
2 baths 3 beds |
$198,715
|
show details |

|
#23
Briarcliff Cir
West Grove, PA 19390
|
3,423 sq. feet
|
2 baths 4 beds |
$337,610
|
show details |

|
#24
Little John Cir
Avondale, PA 19311
|
2,668 sq. feet
|
2 baths 4 beds |
$389,391
|
show details |

|
#25
Forrest Ave # 12
Wilmington, DE 19805
|
1,625 sq. feet
|
1 baths 4 beds |
show details | |

|
#26
Brayden Dr
Marcus Hook, PA 19061
|
- sq. feet
|
2 baths 3 beds |
show details | |

|
#27
Louise Dr
Marcus Hook, PA 19061
|
4,171 sq. feet
|
2 baths 4 beds |
show details | |

|
#28
S 4th St
Oxford, PA 19363
|
- sq. feet
|
2 baths 3 beds |
show details | |

|
#29
Seton Dr
Wilmington, DE 19809
|
2,100 sq. feet
|
3 baths 4 beds |
show details | |

|
#30
Sanford Rd
Pennsville, NJ 08070
|
1,188 sq. feet
|
1 baths 3 beds |
show details |
| Photo | Address | Area | Beds / Baths | Price | Details |
|---|---|---|---|---|---|

|
#31
Booker Ave
Aston, PA 19014
|
1,128 sq. feet
|
1 baths 2 beds |
show details | |

|
#32
3rd Ave
Claymont, DE 19703
|
950 sq. feet
|
1 baths 3 beds |
show details | |

|
#33
Maple Ave
Pennsville, NJ 08070
|
1,143 sq. feet
|
1 baths 3 beds |
show details | |

|
#34
Automotive Blvd
Elkton, MD 21921
|
2,644 sq. feet
|
2 baths 4 beds |
show details | |

|
#35
Milestone Rd
Elkton, MD 21921
|
1,260 sq. feet
|
2 baths 4 beds |
show details | |

|
#36
Bonnie Marie Ln
Elkton, MD 21921
|
2,779 sq. feet
|
2 baths 4 beds |
show details | |

|
#37
Church Rd
Avondale, PA 19311
|
4,158 sq. feet
|
2 baths 4 beds |
show details | |

|
#38
Upper Gap Rd
Coatesville, PA 19320
|
- sq. feet
|
2 baths 3 beds |
show details | |

|
#39
Kirkwood St
Wilmington, DE 19801
|
1,375 sq. feet
|
1 baths 3 beds |
show details | |

|
#40
White Birch Dr
North East, MD 21901
|
1,028 sq. feet
|
2 baths 3 beds |
show details |
| Photo | Address | Area | Beds / Baths | Price | Details |
|---|---|---|---|---|---|

|
#41
Edjil Dr
Newark, DE 19713
|
- sq. feet
|
2 baths 4 beds |
show details | |

|
#42
S Springfield Dr
North East, MD 21901
|
3,486 sq. feet
|
2 baths - beds |
show details | |

|
#43
Federal Walk
Kennett Square, PA 19348
|
1,824 sq. feet
|
2 baths 3 beds |
show details | |

|
#44
Paxson Rd
Cochranville, PA 19330
|
988 sq. feet
|
1 baths 2 beds |
show details | |

|
#45
Leadline Ln
West Chester, PA 19382
|
4,625 sq. feet
|
2 baths 4 beds |
show details | |

|
#46
Armitage Ct
Lincoln University, PA 19352
|
2,436 sq. feet
|
1 baths 4 beds |
show details | |

|
#47
E Hillcrest Ave
West Grove, PA 19390
|
2,359 sq. feet
|
2 baths 3 beds |
show details | |

|
#48
Birmingham Rd
West Chester, PA 19382
|
3,671 sq. feet
|
3 baths 6 beds |
show details | |

|
#49
Newport Pike
Avondale, PA 19311
|
- sq. feet
|
- baths - beds |
$272,285
|
show details |

|
Check over 1 million property listings on Foreclosure.com!
|
browse all offers | |||


 | Renters insurance and furnished houses in Wilmington (2 replies) |
| Coronavirus in Delaware: a place to share news, tips, information (1873 replies) |
| Planning to buy home in North Delaware. Please suggest (9 replies) |
| St. Andrews Apartments (3 replies) |
| Moving to Northern Delaware? (10 replies) |
| Lower edge budget for OK house in Northern DE (13 replies) |

Median year apartment built: 1991
Household type by relationship:
Households: 7,035- Male householders: 1,300 (255 living alone), Female householders: 1,428 (579 living alone)
1,650 spouses (1,636 opposite-sex spouses), 189 unmarried partners, (189 opposite-sex unmarried partners), 2,184 children (2,133 natural, 13 adopted, 38 stepchildren), 48 grandchildren, 0 brothers or sisters, 36 parents, 0 foster children, 23 other relatives, 79 non-relatives
- In group quarters: 94
Size of family households: 661 2-persons, 447 3-persons, 437 4-persons, 136 5-persons, 20 6-persons.
Size of nonfamily households: 855 1-person, 194 2-persons.
1,442 married couples with children.
210 single-parent households (90 men, 120 women).
74.8% of residents of Pike Creek speak English at home.
4.3% of residents speak Spanish at home (26% speak English very well, 5% speak English well, 69% speak English not well).
5.9% of residents speak other Indo-European language at home (89% speak English very well, 7% speak English well, 4% don't speak English at all).
14.4% of residents speak Asian or Pacific Island language at home (81% speak English very well, 19% speak English well).
Foreign born population: 1,716 (24.4%)
(75.3% of them are naturalized citizens)
| Here: | 7.2 |
| State: | 6.9 |
| Here: | 6.4 |
| State: | 4.4 |
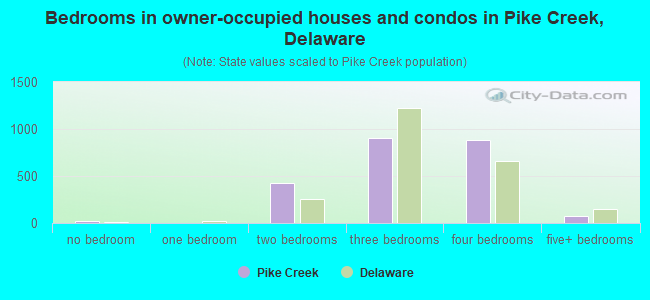
- Bedrooms in owner-occupied houses and condos in Pike Creek, Delaware
- 26no bedroom
- 01 bedroom
- 4232 bedrooms
- 9003 bedrooms
- 8874 bedrooms
- 735+ bedrooms
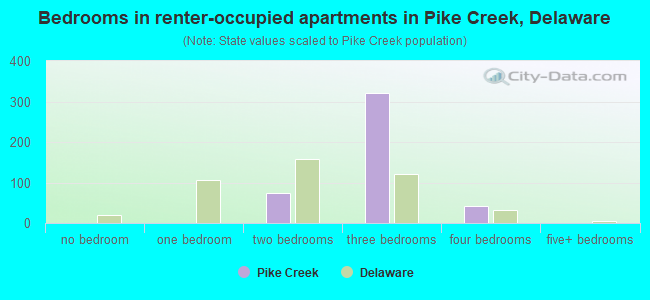
- Bedrooms in renter-occupied apartments in Pike Creek, Delaware
- 0no bedroom
- 01 bedroom
- 742 bedrooms
- 3223 bedrooms
- 434 bedrooms
- 05+ bedrooms
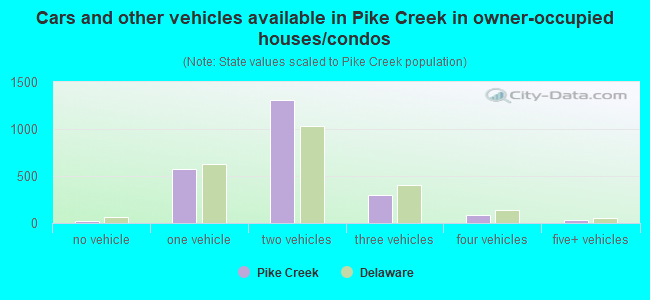
- Cars and other vehicles available in Pike Creek in owner-occupied houses/condos
- 17no vehicle
- 5771 vehicle
- 1,3082 vehicles
- 2963 vehicles
- 814 vehicles
- 305+ vehicles
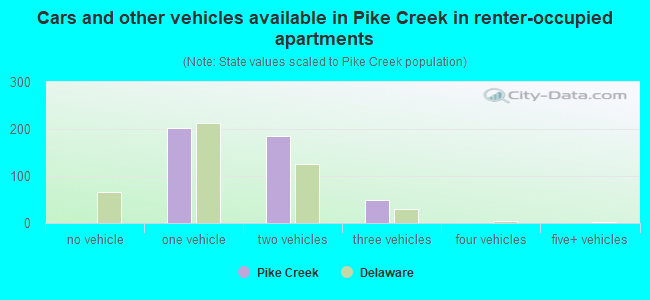
- Cars and other vehicles available in Pike Creek in renter-occupied apartments
- 0no vehicle
- 2031 vehicle
- 1862 vehicles
- 503 vehicles
- 04 vehicles
- 05+ vehicles
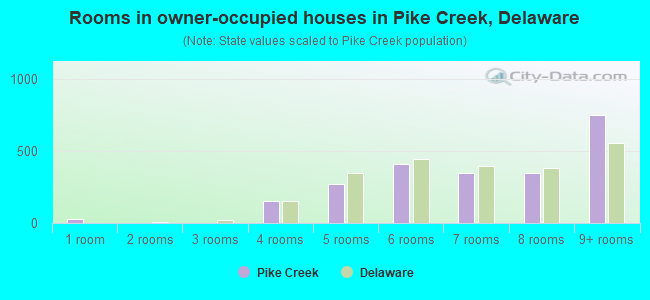
- Rooms in owner-occupied houses in Pike Creek, Delaware
- 261 room
- 02 rooms
- 03 rooms
- 1524 rooms
- 2715 rooms
- 4076 rooms
- 3517 rooms
- 3508 rooms
- 7529+ rooms
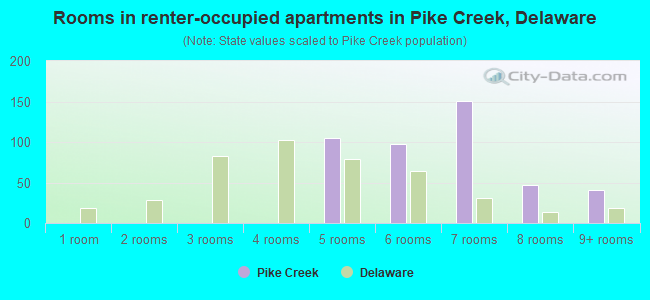
- Rooms in renter-occupied apartments in Pike Creek, Delaware
- 01 room
- 02 rooms
- 03 rooms
- 04 rooms
- 1055 rooms
- 976 rooms
- 1507 rooms
- 478 rooms
- 419+ rooms
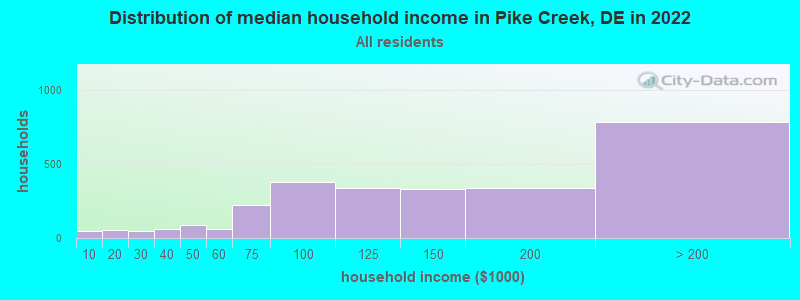
Pike Creek, DE household income distribution

- 46Less than $10,000
- 56$10,000 to $19,999
- 44$20,000 to $29,999
- 63$30,000 to $39,999
- 90$40,000 to $49,999
- 64$50,000 to $59,999
- 223$60,000 to $74,999
- 377$75,000 to $99,999
- 336$100,000 to $124,999
- 334$125,000 to $149,999
- 340$150,000 to $199,999
- 784$200,000 or more
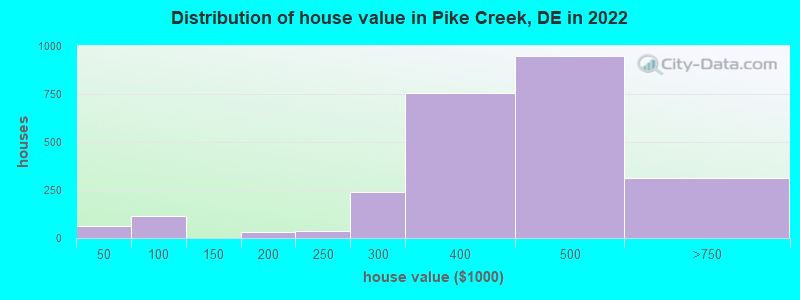
Home value of owner - occupied houses in 2022 in Pike Creek, DE
-
- 64$30,000 to $34,999
- 115$60,000 to $69,999
- 11$150,000 to $174,999
- 17$175,000 to $199,999
- 37$200,000 to $249,999
- 241$250,000 to $299,999
- 753$300,000 to $399,999
- 947$400,000 to $499,999
- 311$500,000 to $749,999
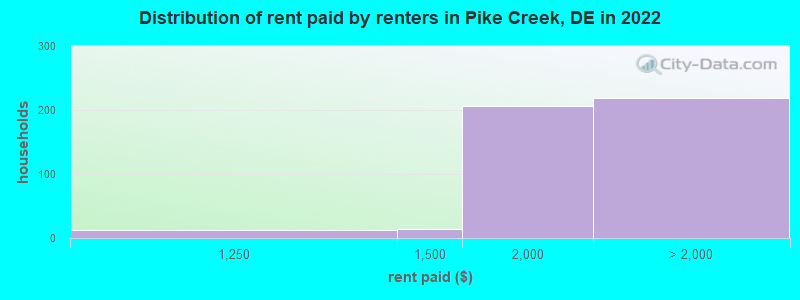
Rent paid by renters in 2022 in Pike Creek, DE
-
- 12$1,000 to $1,249
- 14$1,250 to $1,499
- 206$1,500 to $1,999
- 197$2,000 to $2,499
- 21No cash rent
Percentage of workers working in this county: 93.1%
Number of people working at home: 806 (20.4% of all workers)
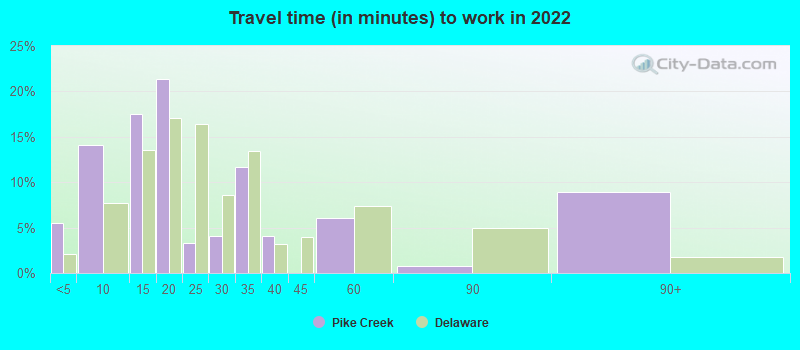
Travel time to work (commute)
- Less than 5 minutes: 28
- 5 to 9 minutes: 145
- 10 to 14 minutes: 204
- 15 to 19 minutes: 611
- 20 to 24 minutes: 583
- 25 to 29 minutes: 576
- 30 to 34 minutes: 447
- 35 to 39 minutes: 104
- 40 to 44 minutes: 183
- 45 to 59 minutes: 158
- 60 to 89 minutes: 65
- 90 or more minutes: 86
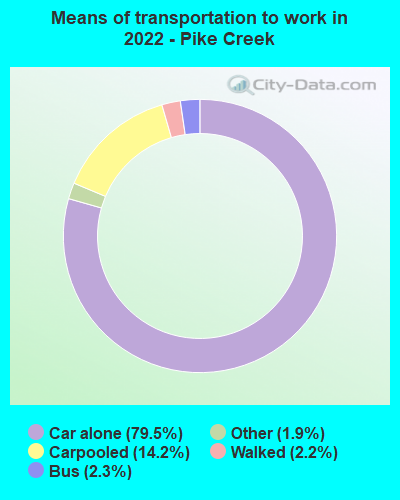
Means of transportation to work:
- Drove a car alone: 940 (50.8%)
- Carpooled: 157 (8.5%)
- Bus: 25 (1.4%)
- Taxi: 21 (1.1%)
- Walked: 27 (1.5%)
- Worked at home: 806 (43.6%)
- Unemployment by race in 2022
- Unemployment rate for White non-Hispanic residents
- 3.5%Males
- 6.5%Females
- Unemployment rate for Hispanic or Latino residents
- 24.7%Females
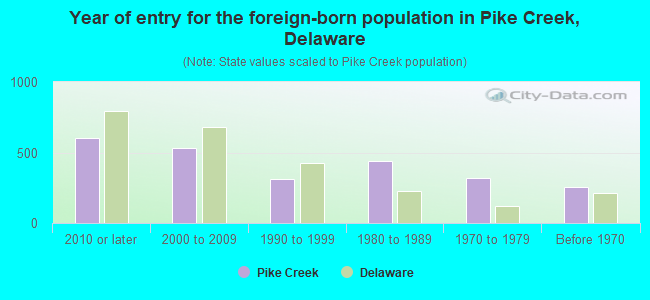
- Year of entry for the foreign-born population in Pike Creek, Delaware
- 6052010 or later
- 5352000 to 2009
- 3121990 to 1999
- 4411980 to 1989
- 3201970 to 1979
- 252Before 1970
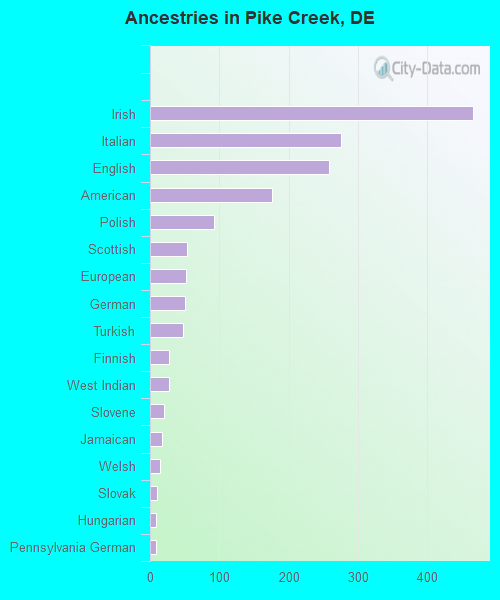
First ancestries reported:
- Irish: 466 (15.0%)
- Italian: 275 (8.9%)
- English: 258 (8.3%)
- American: 176 (5.7%)
- Polish: 92 (3.0%)
- Scottish: 53 (1.7%)
- European: 52 (1.7%)
- German: 50 (1.6%)
- Turkish: 47 (1.5%)
- Finnish: 28 (0.9%)
- West Indian: 28 (0.9%)
- Slovene: 20 (0.6%)
- Jamaican: 18 (0.6%)
- Welsh: 15 (0.5%)
- Slovak: 10 (0.3%)
- Hungarian: 8 (0.3%)
- Pennsylvania German: 8 (0.3%)
- Croatian: 2 (0.06%)
- French: 2 (0.06%)
Most common places of birth for foreign-born residents (%):
| Pike Creek: | 23.3% (398) |
| Delaware: | 11.6% (11,288) |
| Pike Creek: | 22.3% (381) |
| Delaware: | 0.8% (776) |
| Pike Creek: | 20.8% (355) |
| Delaware: | 5.7% (5,583) |
| Pike Creek: | 12.0% (204) |
| Delaware: | 0.6% (545) |
| Pike Creek: | 2.8% (47) |
| Delaware: | 1.1% (1,064) |
| Pike Creek: | 2.6% (44) |
| Delaware: | 1.4% (1,388) |
| Pike Creek: | 2.5% (43) |
| Delaware: | 0.2% (201) |
| Pike Creek: | 1.9% (32) |
| Delaware: | 15.3% (14,887) |
| Pike Creek: | 1.6% (27) |
| Delaware: | 0.9% (834) |
Place of birth for U.S.-born residents:
- This state: 3,103
- Other state: 2,183
- Northeast: 1,325
- Midwest: 221
- South: 438
- West: 183
92.1% of Pike Creek residents lived in the same house 1 years ago.
Out of people who lived in different houses, 32.5% lived in this county.
Out of people who lived in different counties, 0.3% lived in Delaware.
| Pike Creek: | 92.1% |
| State average: | 89.2% |
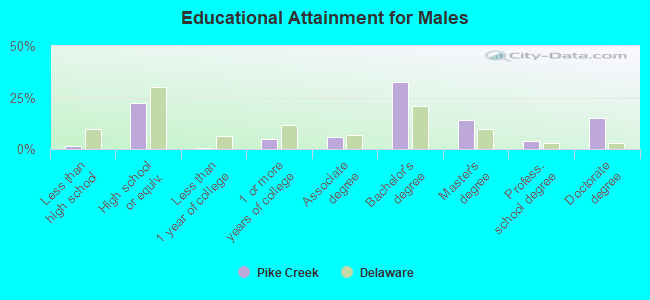
Education attainment for males 25 years and older:
- No schooling: 0
- Nursery to 4th grade: 0
- 5th and 6th grade: 0
- 7th and 8th grade: 21
- 9th grade: 0
- 10th grade: 1
- 11th grade: 0
- 12th grade, no diploma: 16
- High school graduate (or equivalency): 536
- Less than 1 year of college: 15
- Some college more than 1 year, no degree: 116
- Associate degree: 137
- Bachelor's degree: 783
- Master's degree: 340
- Professional school degree: 93
- Doctorate degree: 362
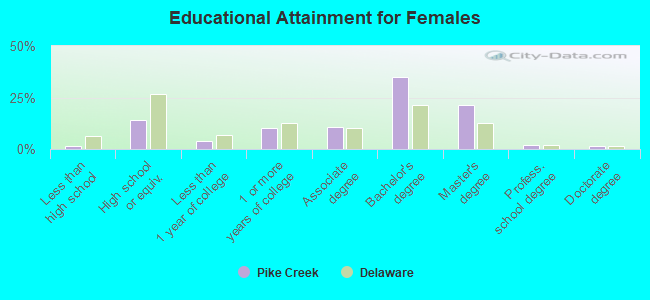
Education attainment for females 25 years and older:
- No schooling: 1
- Nursery to 4th grade: 1
- 5th and 6th grade: 0
- 7th and 8th grade: 0
- 9th grade: 0
- 10th grade: 0
- 11th grade: 0
- 12th grade, no diploma: 37
- High school graduate (or equivalency): 380
- Less than 1 year of college: 105
- Some college more than 1 year, no degree: 278
- Associate degree: 281
- Bachelor's degree: 937
- Master's degree: 566
- Professional school degree: 48
- Doctorate degree: 37


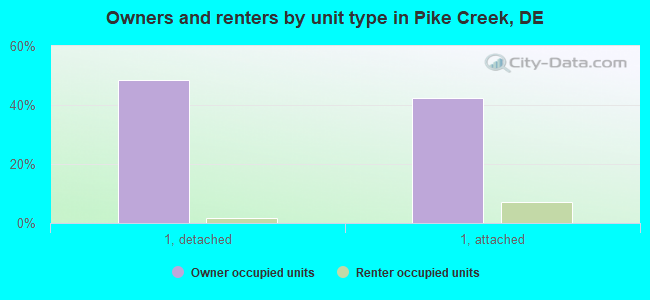
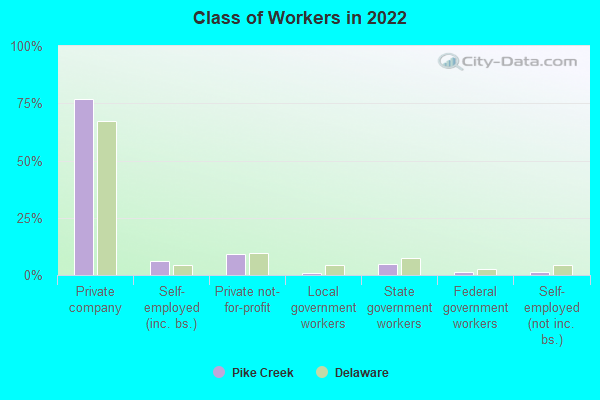
Housing units in structures:
- One, detached: 1,321
- One, attached: 1,346
- Two: 28
- 3 or 4: 18
- 5 to 9: 15
- 10 to 19: 43
- 20 to 49: 27
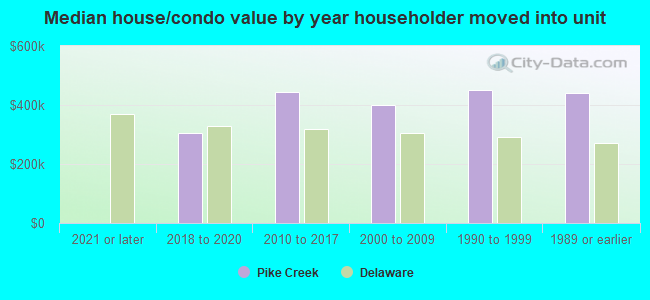
House/condo owner moved in on average 14 years ago
Renter moved in on average 6 years ago
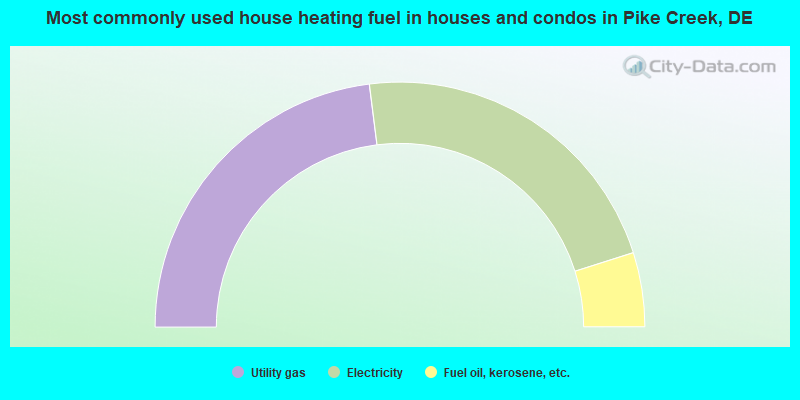
- 46.0%Utility gas
- 44.2%Electricity
- 9.8%Fuel oil, kerosene, etc.
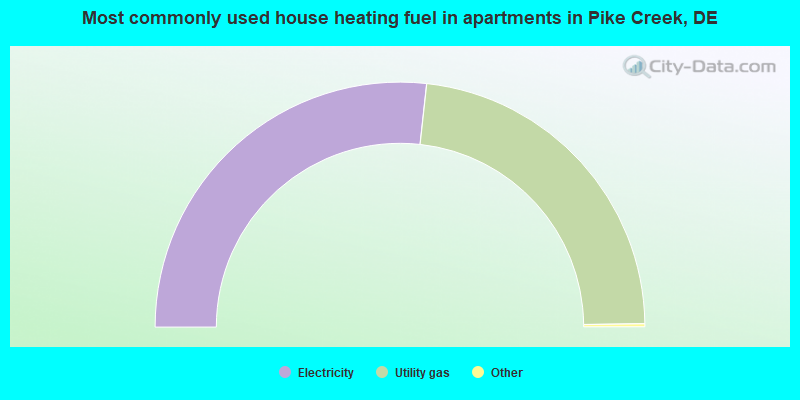
- 53.7%Electricity
- 46.3%Utility gas
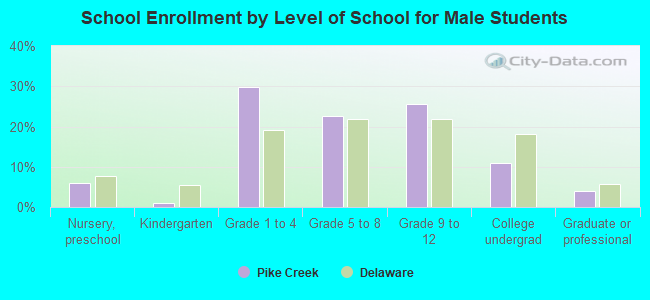
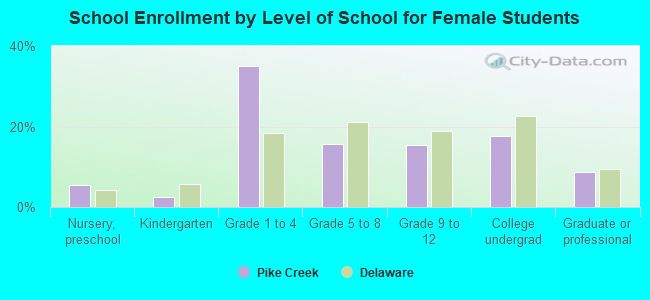
Private vs. public school enrollment:
| Here: | 12.0% |
| Delaware: | 11.5% |
| Here: | 14.3% |
| Delaware: | 12.1% |
| Here: | 43.8% |
| Delaware: | 19.2% |