Personville, TX (Texas) Houses and Residents
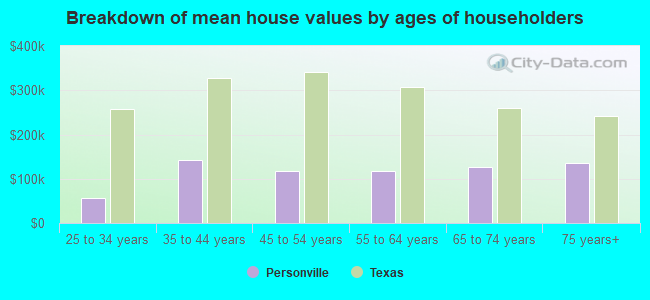
| Personville: | $212,489 |
| Texas: | $275,400 |
Total population: 1,522 (Urban population: 0, Rural population: 1,522 (130 farm, 1,392 nonfarm))
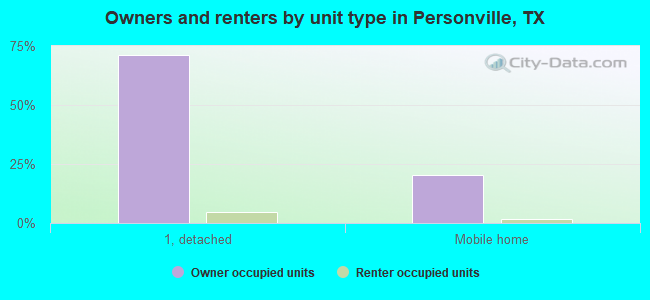
Houses: 923 (624 occupied: 581 owner occupied, 43 renter occupied)
| % of renters here: | 7% |
| State: | 38% |
Housing density: 8 houses/condos per square mile
Median price asked for vacant for-sale houses and condos in 2022 in this county: $357,925.
Median contract rent in 2022: $712 (lower quartile is $570, upper quartile is $780)
Median rent asked for vacant for-rent units in 2022: $654
Median gross rent in Personville, TX in 2022: $952
Housing units in Personville with a mortgage: 127 (0 second mortgage, 18 home equity loan, 0 both second mortgage and home equity loan)
Houses without a mortgage: 176
Compare current foreclosures near Personville, TX:
| Photo | Address | Area | Beds / Baths | Price | Details |
|---|---|---|---|---|---|

|
#1
Morningside Dr
Mexia, TX 76667
|
3,200 sq. feet
|
2 baths 3 beds |
show details | |

|
#2
E Sumpter St
Mexia, TX 76667
|
1,172 sq. feet
|
2 baths - beds |
show details | |

|
#3
Lcr 498
Mexia, TX 76667
|
400 sq. feet
|
2 baths - beds |
show details | |

|
#4
Tamarisk Dr
Mexia, TX 76667
|
1,836 sq. feet
|
2 baths - beds |
show details | |

|
#5
Morningside Dr
Mexia, TX 76667
|
2,855 sq. feet
|
2 baths - beds |
show details | |

|
#6
E Palestine St
Mexia, TX 76667
|
2,215 sq. feet
|
2 baths - beds |
show details | |

|
#7
Lcr 486
Mexia, TX 76667
|
1,392 sq. feet
|
1 baths - beds |
show details | |

|
#8
N Ross Ave
Mexia, TX 76667
|
2,152 sq. feet
|
2 baths - beds |
show details | |

|
#9
Lcr 450
Mexia, TX 76667
|
- sq. feet
|
- baths - beds |
show details | |

|
#10
E Fcr 421
Buffalo, TX 75831
|
- sq. feet
|
- baths - beds |
show details |
| Photo | Address | Area | Beds / Baths | Price | Details |
|---|---|---|---|---|---|

|
#11
Yellow Creek Cir
Jewett, TX 75846
|
- sq. feet
|
- baths - beds |
show details | |

|
#12
Clark St
Mexia, TX 76667
|
- sq. feet
|
- baths - beds |
show details | |

|
#13
S Bonham St
Mexia, TX 76667
|
1,120 sq. feet
|
- baths - beds |
show details | |

|
#14
County Road 481
Teague, TX 75860
|
- sq. feet
|
- baths - beds |
show details | |

|
#15
S Canton St
Mexia, TX 76667
|
- sq. feet
|
- baths - beds |
show details | |

|
#16
E Main St
Mexia, TX 76667
|
1,072 sq. feet
|
- baths - beds |
show details | |

|
#17
Lcr 641
Groesbeck, TX 76642
|
- sq. feet
|
- baths - beds |
show details | |

|
#18
W Us Highway 84
Fairfield, TX 75840
|
- sq. feet
|
- baths - beds |
show details | |

|
Check over 1 million property listings on Foreclosure.com!
|
browse all offers | |||

Household type by relationship:
Households: 21,792- In family households: 18,721 (4,038 male householders, 1,862 female householders)
4,312 spouses, 6,127 children (5,534 natural, 128 adopted, 465 stepchildren), 841 grandchildren, 253 brothers or sisters, 170 parents, foster children, 375 other relatives, 544 non-relatives
- In nonfamily households: 3,071 (1,259 male householders (1,042 living alone)), 1,340 female householders (1,197 living alone)), 472 nonrelatives
- In group quarters: 1,592 (1,542 institutionalized population)
3,435 married couples with children.
1,401 single-parent households (241 men, 1,160 women).
96.6% of residents of Personville speak English at home.
1.6% of residents speak Spanish at home (26% speak English very well, 43% speak English well, 30% speak English not well).
0.5% of residents speak other Indo-European language at home (100% speak English very well).
1.3% of residents speak Asian or Pacific Island language at home (100% speak English very well).
Foreign born population: 47 (2.3%)
(61.7% of them are naturalized citizens)
| Here: | 6.0 |
| State: | 6.3 |
| Here: | 4.8 |
| State: | 4.0 |
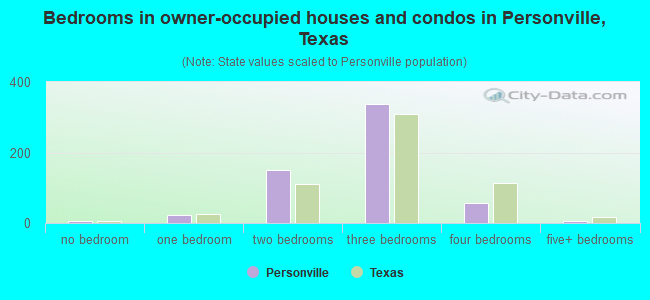
- Bedrooms in owner-occupied houses and condos in Personville, Texas
- 6no bedroom
- 231 bedroom
- 1512 bedrooms
- 3393 bedrooms
- 574 bedrooms
- 55+ bedrooms
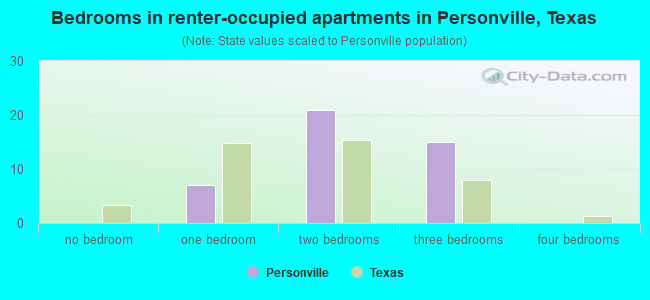
- Bedrooms in renter-occupied apartments in Personville, Texas
- 0no bedroom
- 71 bedroom
- 212 bedrooms
- 153 bedrooms
- 04 bedrooms
- 05+ bedrooms
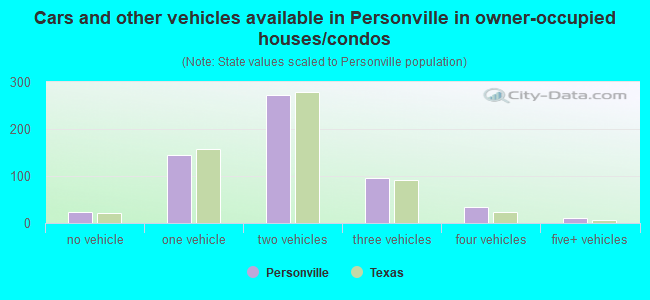
- Cars and other vehicles available in Personville in owner-occupied houses/condos
- 24no vehicle
- 1441 vehicle
- 2722 vehicles
- 963 vehicles
- 344 vehicles
- 115+ vehicles
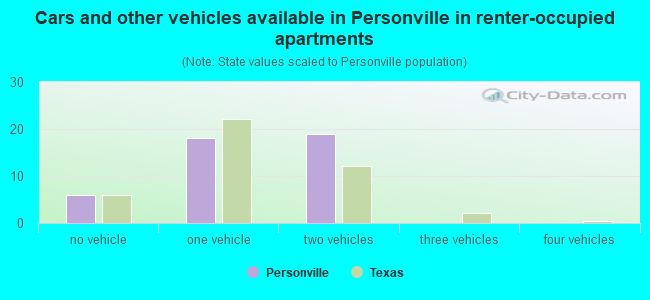
- Cars and other vehicles available in Personville in renter-occupied apartments
- 6no vehicle
- 181 vehicle
- 192 vehicles
- 03 vehicles
- 04 vehicles
- 05+ vehicles
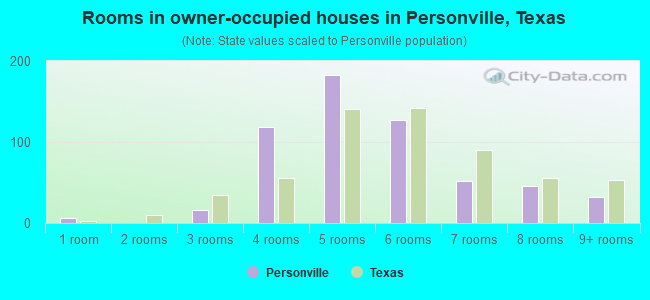
- Rooms in owner-occupied houses in Personville, Texas
- 61 room
- 02 rooms
- 163 rooms
- 1194 rooms
- 1835 rooms
- 1276 rooms
- 527 rooms
- 468 rooms
- 329+ rooms
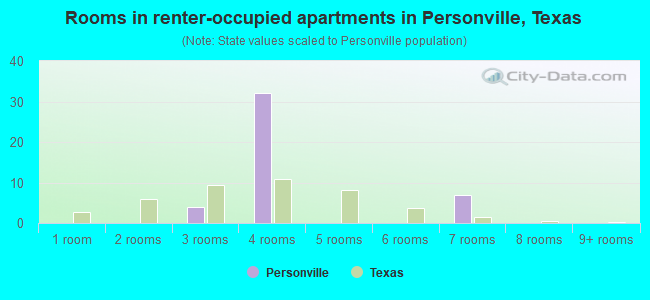
- Rooms in renter-occupied apartments in Personville, Texas
- 01 room
- 02 rooms
- 43 rooms
- 324 rooms
- 05 rooms
- 06 rooms
- 77 rooms
- 08 rooms
- 09+ rooms
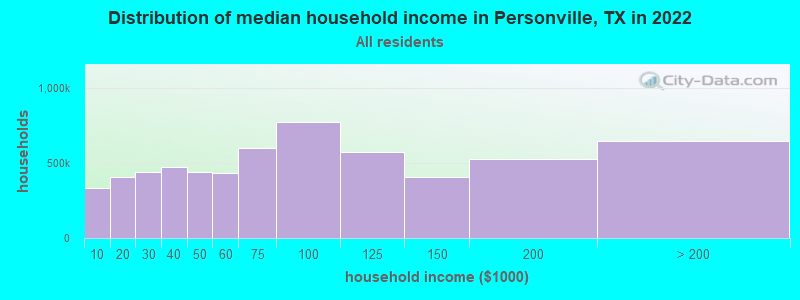
Personville, TX household income distribution

- 98,242Less than $10,000
- 133,561$10,000 to $19,999
- 145,299$20,000 to $29,999
- 153,037$30,000 to $39,999
- 144,384$40,000 to $49,999
- 138,570$50,000 to $59,999
- 191,822$60,000 to $74,999
- 262,649$75,000 to $99,999
- 199,103$100,000 to $124,999
- 146,787$125,000 to $149,999
- 170,698$150,000 to $199,999
- 191,870$200,000 or more
Percentage of workers working in this county: 51.4%
Number of people working at home: 98 (11.1% of all workers)
Travel time to work (commute)
- Less than 5 minutes: 6
- 5 to 9 minutes: 74
- 10 to 14 minutes: 50
- 15 to 19 minutes: 126
- 20 to 24 minutes: 122
- 25 to 29 minutes: 33
- 30 to 34 minutes: 83
- 35 to 39 minutes: 0
- 40 to 44 minutes: 8
- 45 to 59 minutes: 69
- 60 to 89 minutes: 49
- 90 or more minutes: 6
Means of transportation to work:
- Drove a car alone: 523 (80.7%)
- Carpooled: 74 (11.4%)
- Ferryboat: 7 (1.1%)
- Other means: 22 (3.4%)
- Worked at home: 22 (3.4%)
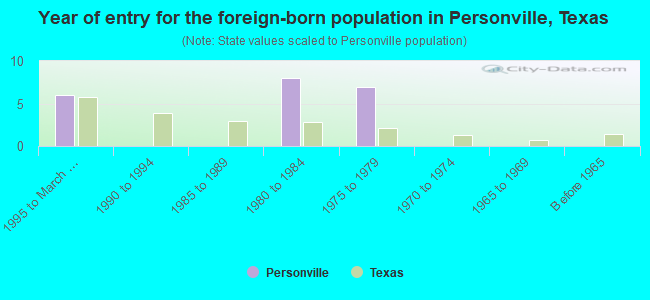
- Year of entry for the foreign-born population in Personville, Texas
- 61995 to March 2000
- 01990 to 1994
- 01985 to 1989
- 81980 to 1984
- 71975 to 1979
- 01970 to 1974
- 01965 to 1969
- 0Before 1965
Most common places of birth for foreign-born residents (%):
| Personville: | 47.6% (10) |
| Texas: | 64.8% (1,879,369) |
| Personville: | 33.3% (7) |
| Texas: | 0.5% (15,581) |
| Personville: | 19.0% (4) |
| Texas: | 1.4% (39,249) |
Place of birth for U.S.-born residents:
- This state: 1,235
- Other state: 266
- Northeast: 11
- Midwest: 58
- South: 135
- West: 62
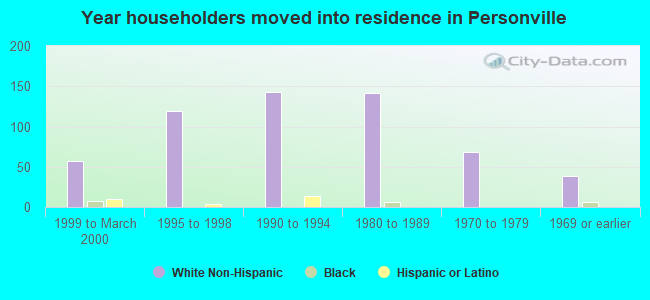
67% of Personville residents lived in the same house 5 years ago.
Out of people who lived in different houses, 33% lived in this county.
Out of people who lived in different counties, 97% lived in Texas.
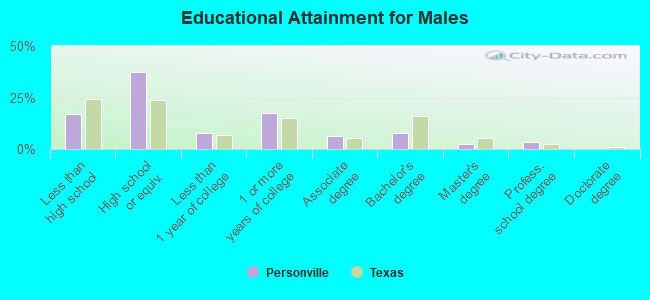
Education attainment for males 25 years and older:
- No schooling: 7
- Nursery to 4th grade: 0
- 5th and 6th grade: 6
- 7th and 8th grade: 0
- 9th grade: 41
- 10th grade: 32
- 11th grade: 8
- 12th grade, no diploma: 0
- High school graduate (or equivalency): 211
- Less than 1 year of college: 44
- Some college more than 1 year, no degree: 99
- Associate degree: 35
- Bachelor's degree: 44
- Master's degree: 14
- Professional school degree: 20
- Doctorate degree: 0
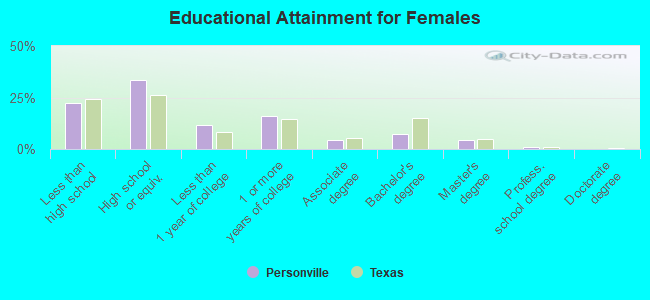
Education attainment for females 25 years and older:
- No schooling: 0
- Nursery to 4th grade: 0
- 5th and 6th grade: 0
- 7th and 8th grade: 7
- 9th grade: 27
- 10th grade: 33
- 11th grade: 45
- 12th grade, no diploma: 15
- High school graduate (or equivalency): 191
- Less than 1 year of college: 67
- Some college more than 1 year, no degree: 91
- Associate degree: 24
- Bachelor's degree: 41
- Master's degree: 24
- Professional school degree: 6
- Doctorate degree: 0


Housing units in structures:
- One, detached: 652
- One, attached: 12
- 10 to 19: 4
- Mobile homes: 246
- Boats, RVs, vans, etc.: 9
Median worth of mobile homes: $117,021
Housing units lacking complete kitchen facilities: 1.6%
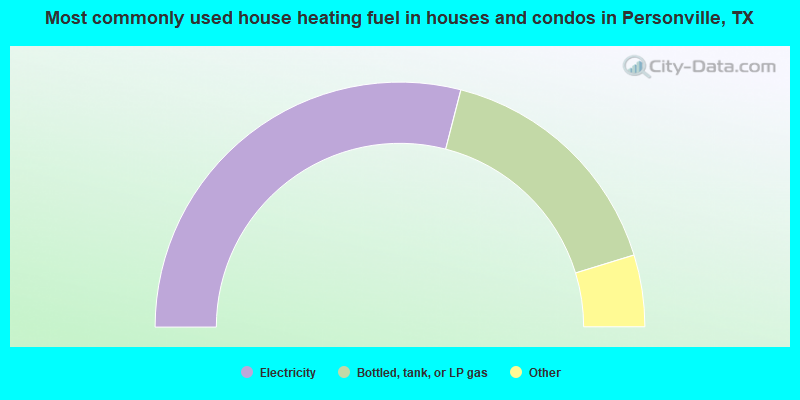
- 58.0%Electricity
- 32.5%Bottled, tank, or LP gas
- 3.4%Other fuel
- 3.3%Wood
- 2.8%Utility gas
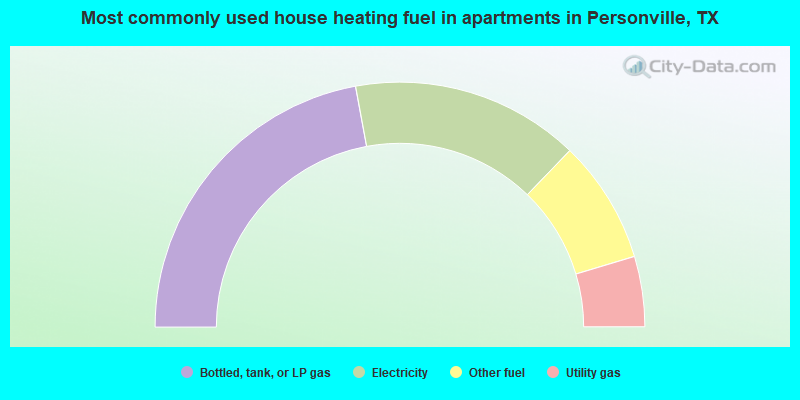
- 44.2%Bottled, tank, or LP gas
- 30.2%Electricity
- 16.3%Other fuel
- 9.3%Utility gas
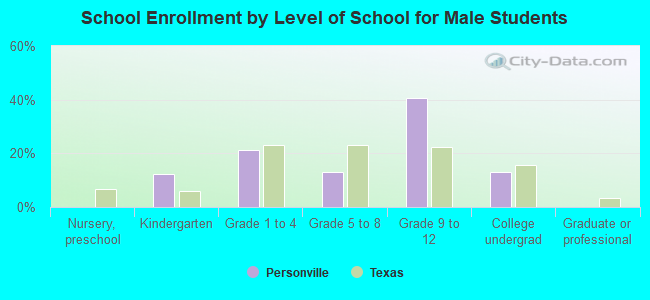
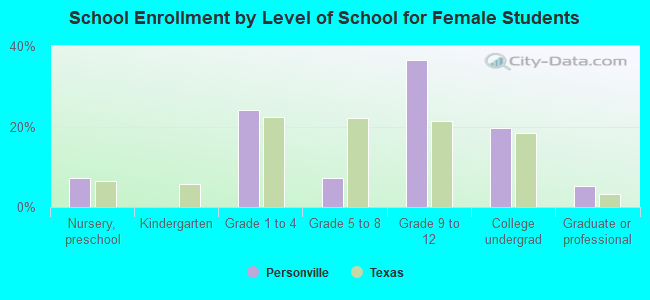
Private vs. public school enrollment:
| Here: | 0.0% |
| Texas: | 6.8% |
| Here: | 11.0% |
| Texas: | 6.2% |
| Here: | 23.4% |
| Texas: | 15.4% |