Perris Valley, CA (California) Houses and Residents
| Perris Valley: | $449,668 |
| California: | $715,900 |
Total population: 190,588 (Urban population: 130,673, Rural population: 13,860 (329 farm, 13,531 nonfarm))
Houses: 51,323 (46,991 occupied: 36,693 owner occupied, 10,298 renter occupied)
| % of renters here: | 22% |
| State: | 44% |
Housing density: 186 houses/condos per square mile
Median price asked for vacant for-sale houses and condos in 2022 in this county: $550,307.
Median contract rent in 2022: $1,549 (lower quartile is $1,064, upper quartile is over $2,000)
Median rent asked for vacant for-rent units in 2022: $1,460
Median gross rent in Perris Valley, CA in 2022: $1,797
Housing units in Perris Valley with a mortgage: 21,647 (3,573 second mortgage, 962 home equity loan, 116 both second mortgage and home equity loan)
Houses without a mortgage: 6,227
Compare current foreclosures near Perris Valley, CA:
| Photo | Address | Area | Beds / Baths | Price | Details |
|---|---|---|---|---|---|

|
#1
Camino Cristal
Menifee, CA 92584
|
2,337 sq. feet
|
2 baths 5 beds |
$440,900
|
show details |

|
#2
Vellanto Way
Moreno Valley, CA 92553
|
1,316 sq. feet
|
2 baths 3 beds |
$480,000
|
show details |

|
#3
Quail Creek Lane
Wildomar, CA 92595
|
1,891 sq. feet
|
2 baths 3 beds |
$675,000
|
show details |

|
#4
Ryan Ave
Lake Elsinore, CA 92530
|
- sq. feet
|
2 baths 2 beds |
$509,900
|
show details |

|
#5
Periwinkle Way
Lake Elsinore, CA 92532
|
2,858 sq. feet
|
3 baths 5 beds |
show details | |

|
#6
Cleveland Ave
Riverside, CA 92503
|
2,302 sq. feet
|
2 baths 4 beds |
show details | |

|
#7
Juniper Flats Rd
Nuevo, CA 92567
|
2,555 sq. feet
|
2 baths 3 beds |
show details | |

|
#8
Chervil Way
Lake Elsinore, CA 92532
|
2,533 sq. feet
|
3 baths 4 beds |
show details | |

|
#9
Brookside Ln
Beaumont, CA 92223
|
2,494 sq. feet
|
2 baths 4 beds |
show details | |

|
#10
Rosy Sky Cir
Riverside, CA 92503
|
2,093 sq. feet
|
2 baths 4 beds |
show details |
| Photo | Address | Area | Beds / Baths | Price | Details |
|---|---|---|---|---|---|

|
#11
Westlake Dr
Menifee, CA 92584
|
1,746 sq. feet
|
2 baths 3 beds |
show details | |

|
#12
Lomas St
Hemet, CA 92544
|
2,176 sq. feet
|
4 baths 4 beds |
show details | |

|
#13
Bradley Rd
Sun City, CA 92586
|
1,066 sq. feet
|
2 baths 2 beds |
show details | |

|
#14
Bonica St
Lake Elsinore, CA 92532
|
2,867 sq. feet
|
3 baths 4 beds |
show details | |

|
#15
Duncan Dr
Moreno Valley, CA 92555
|
3,570 sq. feet
|
3 baths 6 beds |
show details | |

|
#16
Avenida Bonita
Murrieta, CA 92562
|
3,359 sq. feet
|
4 baths 4 beds |
show details | |

|
#17
Carnation Way
Lake Elsinore, CA 92532
|
- sq. feet
|
2 baths 3 beds |
show details | |

|
#18
Brentwood Way
Hemet, CA 92545
|
2,040 sq. feet
|
3 baths 3 beds |
show details | |

|
#19
Bell Cir
Winchester, CA 92596
|
2,565 sq. feet
|
3 baths 3 beds |
show details | |

|
#20
Grove Dr
Riverside, CA 92503
|
3,269 sq. feet
|
4 baths 4 beds |
show details |
| Photo | Address | Area | Beds / Baths | Price | Details |
|---|---|---|---|---|---|

|
#21
Canyon Estates Dr
Lake Elsinore, CA 92532
|
2,358 sq. feet
|
2 baths 6 beds |
show details | |

|
#22
Windsong Ln
San Jacinto, CA 92582
|
1,662 sq. feet
|
2 baths 4 beds |
show details | |

|
#23
Brutus Way
Beaumont, CA 92223
|
3,396 sq. feet
|
2 baths 4 beds |
show details | |

|
#24
Villa Valtelena
Lake Elsinore, CA 92532
|
2,589 sq. feet
|
3 baths 4 beds |
show details | |

|
#25
Plymouth Way
Temecula, CA 92591
|
2,203 sq. feet
|
2 baths 3 beds |
show details | |

|
#26
Oak Cliff Dr
Temecula, CA 92591
|
1,262 sq. feet
|
2 baths 3 beds |
show details | |

|
#27
Davis St
Moreno Valley, CA 92557
|
1,126 sq. feet
|
2 baths 3 beds |
show details | |

|
#28
Calle Arrebol
Murrieta, CA 92563
|
1,810 sq. feet
|
2 baths 2 beds |
show details | |

|
#29
Sweet Magnolia Way
Murrieta, CA 92563
|
3,732 sq. feet
|
4 baths 4 beds |
show details | |

|
#30
Long St
Hemet, CA 92543
|
1,464 sq. feet
|
2 baths 2 beds |
show details |
| Photo | Address | Area | Beds / Baths | Price | Details |
|---|---|---|---|---|---|

|
#31
Eleanor Ln
Moreno Valley, CA 92551
|
1,123 sq. feet
|
2 baths 3 beds |
show details | |

|
#32
Camino De Oro
San Jacinto, CA 92583
|
1,332 sq. feet
|
2 baths 2 beds |
show details | |

|
#33
Almont Way
Sun City, CA 92585
|
2,865 sq. feet
|
3 baths 6 beds |
show details | |

|
#34
Whieldon Dr
Perris, CA 92571
|
2,177 sq. feet
|
2 baths 4 beds |
show details | |

|
#35
Bonnie Lea Dr
Lake Elsinore, CA 92530
|
702 sq. feet
|
1 baths 1 beds |
show details | |

|
#36
Fortuna St
Perris, CA 92571
|
- sq. feet
|
2 baths 3 beds |
show details | |

|
#37
Coral Ave
Hemet, CA 92543
|
1,034 sq. feet
|
2 baths 2 beds |
show details | |

|
#38
Via Verde
Lake Elsinore, CA 92530
|
1,274 sq. feet
|
2 baths 3 beds |
show details | |

|
#39
La Costa Alta Dr
Moreno Valley, CA 92555
|
4,817 sq. feet
|
4 baths 6 beds |
show details | |

|
#40
Hibiscus
Lake Elsinore, CA 92530
|
3,014 sq. feet
|
5 baths 5 beds |
show details |
| Photo | Address | Area | Beds / Baths | Price | Details |
|---|---|---|---|---|---|

|
#41
Mcguire Rd
Perris, CA 92570
|
6,347 sq. feet
|
4 baths 5 beds |
show details | |

|
#42
E Acacia Ave
Hemet, CA 92543
|
988 sq. feet
|
1 baths 4 beds |
show details | |

|
#43
Broadleaf Ln
Moreno Valley, CA 92553
|
2,074 sq. feet
|
3 baths 4 beds |
show details | |

|
#44
Titus Ct
San Jacinto, CA 92583
|
1,814 sq. feet
|
3 baths 4 beds |
show details | |

|
#45
Almond Dr
Perris, CA 92571
|
1,516 sq. feet
|
2 baths 3 beds |
show details | |

|
#46
Mount Vernon St
Riverside, CA 92504
|
1,505 sq. feet
|
2 baths 4 beds |
show details | |

|
#47
Tierra Shores Ln
Menifee, CA 92584
|
1,979 sq. feet
|
2 baths 3 beds |
show details | |

|
#48
W Westmont Ave
Hemet, CA 92543
|
1,218 sq. feet
|
2 baths 2 beds |
show details | |

|
#49
Lake Vista Rd
Moreno Valley, CA 92557
|
2,284 sq. feet
|
3 baths 4 beds |
show details | |

|
Check over 1 million property listings on Foreclosure.com!
|
browse all offers | |||

Household type by relationship:
Households: 2,153,812- In family households: 1,916,707 (357,691 male householders, 152,550 female householders)
376,381 spouses, 728,028 children (675,451 natural, 15,499 adopted, 37,078 stepchildren), 69,455 grandchildren, 34,232 brothers or sisters, 33,896 parents, foster children, 57,727 other relatives, 76,462 non-relatives
- In nonfamily households: 237,105 (84,686 male householders (58,397 living alone)), 91,333 female householders (74,097 living alone)), 61,086 nonrelatives
- In group quarters: 35,829 (20,862 institutionalized population)
308,692 married couples with children.
98,911 single-parent households (26,262 men, 72,649 women).
68.8% of residents of Perris Valley speak English at home.
27.8% of residents speak Spanish at home (52% speak English very well, 21% speak English well, 19% speak English not well, 8% don't speak English at all).
1.3% of residents speak other Indo-European language at home (75% speak English very well, 17% speak English well, 8% speak English not well, 1% don't speak English at all).
1.7% of residents speak Asian or Pacific Island language at home (64% speak English very well, 21% speak English well, 13% speak English not well, 2% don't speak English at all).
0.4% of residents speak other language at home (73% speak English very well, 24% speak English well, 3% don't speak English at all).
Foreign born population: 47,345 (20.5%)
(59.3% of them are naturalized citizens)
| Here: | 6.1 |
| State: | 6.0 |
| Here: | 5.7 |
| State: | 3.9 |

- Bedrooms in owner-occupied houses and condos in Perris Valley, California
- 1,148no bedroom
- 2,1011 bedroom
- 11,1782 bedrooms
- 15,4693 bedrooms
- 6,0064 bedrooms
- 7915+ bedrooms

- Bedrooms in renter-occupied apartments in Perris Valley, California
- 626no bedroom
- 1,6981 bedroom
- 3,9432 bedrooms
- 3,1293 bedrooms
- 8434 bedrooms
- 595+ bedrooms

- Cars and other vehicles available in Perris Valley in owner-occupied houses/condos
- 1,445no vehicle
- 12,1431 vehicle
- 15,2812 vehicles
- 5,6843 vehicles
- 1,4934 vehicles
- 6475+ vehicles

- Cars and other vehicles available in Perris Valley in renter-occupied apartments
- 1,295no vehicle
- 4,8111 vehicle
- 3,0582 vehicles
- 8293 vehicles
- 2444 vehicles
- 615+ vehicles

- Rooms in owner-occupied houses in Perris Valley, California
- 1621 room
- 1,0542 rooms
- 3,1553 rooms
- 4,2624 rooms
- 8,9725 rooms
- 8,9926 rooms
- 5,8047 rooms
- 2,8418 rooms
- 1,4519+ rooms

- Rooms in renter-occupied apartments in Perris Valley, California
- 2861 room
- 9332 rooms
- 1,6253 rooms
- 2,1544 rooms
- 2,4665 rooms
- 1,7686 rooms
- 6707 rooms
- 2428 rooms
- 1549+ rooms


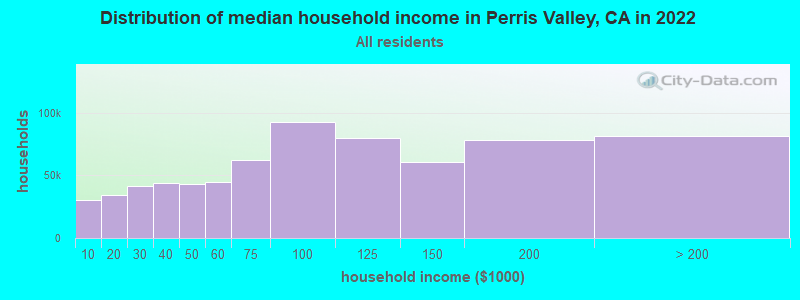
Perris Valley, CA household income distribution

- 30,329Less than $10,000
- 34,299$10,000 to $19,999
- 41,397$20,000 to $29,999
- 43,988$30,000 to $39,999
- 43,444$40,000 to $49,999
- 44,677$50,000 to $59,999
- 62,557$60,000 to $74,999
- 92,570$75,000 to $99,999
- 79,665$100,000 to $124,999
- 60,931$125,000 to $149,999
- 77,849$150,000 to $199,999
- 81,462$200,000 or more
Percentage of workers working in this county: 74.4%
Number of people working at home: 10,893 (11.7% of all workers)
Travel time to work (commute)
- Less than 5 minutes: 1,006
- 5 to 9 minutes: 2,922
- 10 to 14 minutes: 4,603
- 15 to 19 minutes: 4,986
- 20 to 24 minutes: 5,467
- 25 to 29 minutes: 2,360
- 30 to 34 minutes: 7,613
- 35 to 39 minutes: 1,185
- 40 to 44 minutes: 2,175
- 45 to 59 minutes: 5,030
- 60 to 89 minutes: 5,207
- 90 or more minutes: 4,668
Means of transportation to work:
- Drove a car alone: 36,207 (73.6%)
- Carpooled: 8,865 (18.0%)
- Bus or trolley bus: 476 (1.0%)
- Subway or elevated: 28 (0.1%)
- Railroad: 99 (0.2%)
- Ferryboat: 9 (0.0%)
- Taxi: 27 (0.1%)
- Motorcycle: 43 (0.1%)
- Bicycle: 162 (0.3%)
- Walked: 710 (1.4%)
- Other means: 596 (1.2%)
- Worked at home: 1,952 (4.0%)

- Year of entry for the foreign-born population in Perris Valley, California
- 3,6051995 to March 2000
- 3,5691990 to 1994
- 4,8121985 to 1989
- 3,6311980 to 1984
- 3,0781975 to 1979
- 2,4281970 to 1974
- 1,3481965 to 1969
- 3,101Before 1965
Most common places of birth for foreign-born residents (%):
| Perris Valley: | 71.9% (18,379) |
| California: | 44.3% (3,928,701) |
| Perris Valley: | 3.4% (872) |
| California: | 7.5% (664,935) |
| Perris Valley: | 2.4% (612) |
| California: | 4.1% (359,673) |
| Perris Valley: | 2.1% (544) |
| California: | 1.6% (141,181) |
| Perris Valley: | 1.8% (458) |
| California: | 2.4% (211,458) |
| Perris Valley: | 1.6% (421) |
| California: | 1.5% (133,090) |
Place of birth for U.S.-born residents:
- This state: 77,750
- Other state: 39,873
- Northeast: 6,988
- Midwest: 15,246
- South: 11,494
- West: 6,145
50% of Perris Valley residents lived in the same house 5 years ago.
Out of people who lived in different houses, 60% lived in this county.
Out of people who lived in different counties, 81% lived in California.
Education attainment for males 25 years and older:
- No schooling: 1,201
- Nursery to 4th grade: 817
- 5th and 6th grade: 1,810
- 7th and 8th grade: 1,202
- 9th grade: 1,252
- 10th grade: 1,351
- 11th grade: 1,493
- 12th grade, no diploma: 2,474
- High school graduate (or equivalency): 11,245
- Less than 1 year of college: 3,428
- Some college more than 1 year, no degree: 7,288
- Associate degree: 2,644
- Bachelor's degree: 3,265
- Master's degree: 1,068
- Professional school degree: 458
- Doctorate degree: 202

Education attainment for females 25 years and older:
- No schooling: 1,150
- Nursery to 4th grade: 623
- 5th and 6th grade: 1,671
- 7th and 8th grade: 1,478
- 9th grade: 1,556
- 10th grade: 1,638
- 11th grade: 1,717
- 12th grade, no diploma: 2,967
- High school graduate (or equivalency): 13,533
- Less than 1 year of college: 4,664
- Some college more than 1 year, no degree: 7,969
- Associate degree: 2,774
- Bachelor's degree: 3,204
- Master's degree: 973
- Professional school degree: 421
- Doctorate degree: 108


Housing units in structures:
- One, detached: 35,585
- One, attached: 1,602
- Two: 253
- 3 or 4: 569
- 5 to 9: 395
- 10 to 19: 299
- 20 to 49: 189
- 50 or more: 813
- Mobile homes: 11,154
- Boats, RVs, vans, etc.: 464
Median worth of mobile homes: $178,306
Housing units lacking complete kitchen facilities: 1.1%

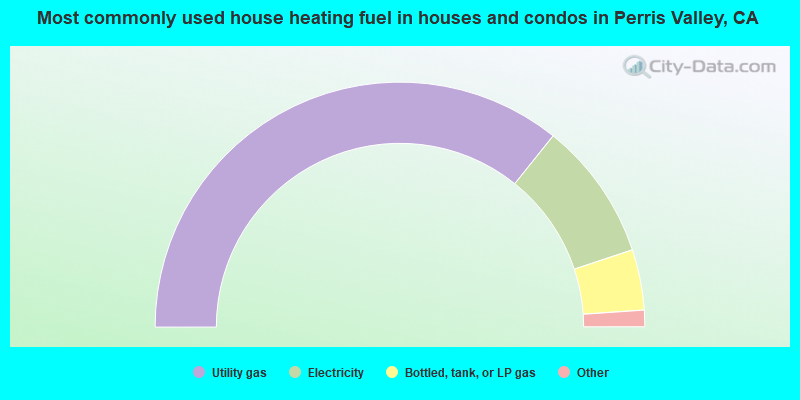
- 71.5%Utility gas
- 18.3%Electricity
- 8.0%Bottled, tank, or LP gas
- 1.2%Wood
- 0.6%No fuel used
- 0.2%Other fuel
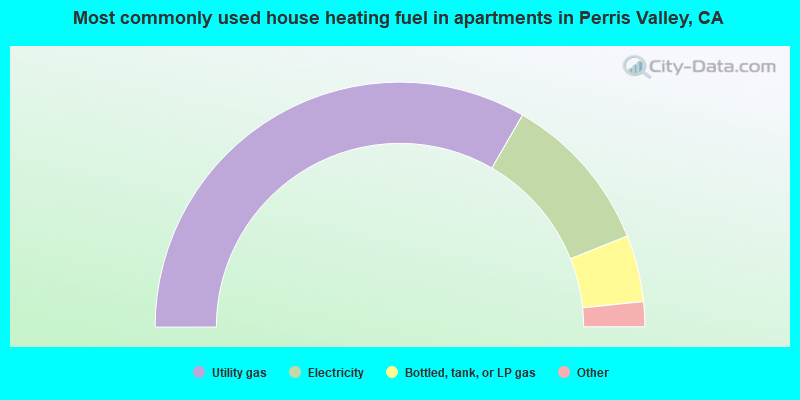
- 66.7%Utility gas
- 21.2%Electricity
- 8.8%Bottled, tank, or LP gas
- 1.5%No fuel used
- 1.2%Wood
- 0.5%Other fuel
- 0.1%Solar energy
Private vs. public school enrollment:
| Here: | 7.2% |
| California: | 9.9% |
| Here: | 5.2% |
| California: | 7.8% |
| Here: | 14.2% |
| California: | 15.4% |


