Peoria, IL (Illinois) Houses and Residents
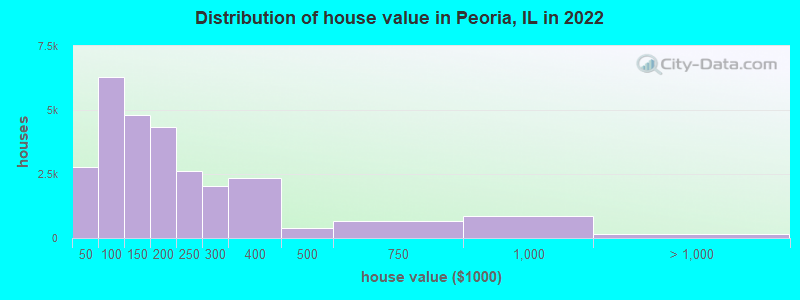
Estimated median house or condo value in 2022: $151,400 (it was $84,000 in 2000 )
Peoria:
$151,400Illinois:
$251,600
Lower value quartile - upper value quartile: $84,500 - $246,700Mean price in 2022: Detached houses: $180,637 Here:
$180,637State:
$310,164
Townhouses or other attached units: $247,353 Here:
$247,353State:
$286,230
In 2-unit structures: $161,021 Here:
$161,021State:
$299,638
In 3-to-4-unit structures: $170,689 Here:
$170,689State:
$330,907
In 5-or-more-unit structures: $106,281 Here:
$106,281State:
$318,887
Mobile homes: $80,247 Here:
$80,247State:
$78,855
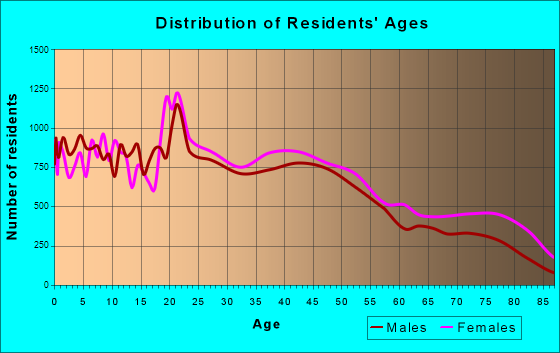
Total population: 115,828 (Urban population: 112,796, Rural population: 96 (all nonfarm) )
Houses: 52,247 (47,488 occupied: 26,521 owner occupied, 20,967 renter occupied )
% of renters here:
44%State:
33%
Housing density: 1,177 houses/condos per square mile
Median price asked for vacant for-sale houses and condos in 2022: $71,451.
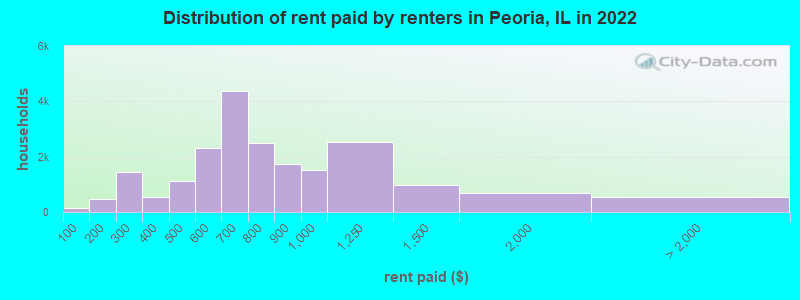
Median contract rent in 2022: $696 (lower quartile is $549, upper quartile is $952)
Median rent asked for vacant for-rent units in 2022: $890
Median gross rent in Peoria, IL in 2022: $919
Housing units in Peoria with a mortgage: 16,701 (1,170 second mortgage, 0 home equity loan, 820 both second mortgage and home equity loan )Houses without a mortgage: 90
Median household income for houses/condos with a mortgage: $95,854
Median household income for apartments without a mortgage: $57,333
Median monthly housing costs: $1,000
Data:
Median house or condo value ($)
Median house or condo value ($ change since 2000)
Median house or condo value ($) - White
Median house or condo value ($) - Black or African American
Median house or condo value ($) - Asian
Median house or condo value ($) - Hispanic or Latino
Median house or condo value ($) - American Indian and Alaska Native
Median house or condo value ($) - Multirace
Median house or condo value ($) - Other Race
Median price asked for mobile homes ($)
Household density (households per square mile)
Mean house or condo value by units in structure - 1, detached ($)
Mean house or condo value by units in structure - 1, attached ($)
Mean house or condo value by units in structure - 2 ($)
Mean house or condo value by units in structure by units in structure - 3 or 4 ($)
Mean house or condo value by units in structure - 5 or more ($)
Mean house or condo value by units in structure - Boat, RV, van, etc. ($)
Mean house or condo value by units in structure - Mobile home ($)
Median contract rent ($)
Median contract rent - Lower quartile ($)
Median contract rent - Upper quartile ($)
Median gross rent ($)
Urban houses (%)
Rural houses (%)
Houses occupied (%)
Houses occupied (% change since 2000)
Houses owner occupied (%)
Houses owner occupied (% change since 2000)
Houses renter occupied (%)
Houses renter occupied (% change since 2000)
Vacant housing units - For rent (%)
Vacant housing units - For rent (% change since 2000)
Vacant housing units - For sale only (%)
Vacant housing units - For sale only (% change since 2000)
Vacant housing units - Rented or sold, not occupied (%)
Vacant housing units - Rented or sold, not occupied (% change since 2000)
Vacant housing units - For seasonal, recreational, or occasional use (%)
Vacant housing units - For seasonal, recreational, or occasional use (% change since 2000)
Vacant housing units - For migrant workers (%)
Vacant housing units - For migrant workers (% change since 2000)
Vacant housing units - Other vacant (%)
Vacant housing units - Other vacant (% change since 2000)
Median monthly housing costs ($)
Median household income for houses/condos with a mortgage ($)
Median household income for houses/condos without a mortgage ($)
Median household income ($)
Median household income ($) - White
Median household income ($) - Black or African American
Median household income ($) - Asian
Median household income ($) - Hispanic or Latino
Median household income ($) - American Indian and Alaska Native
Median household income ($) - Multirace
Median household income ($) - Other Race
Mortgage status - with mortgage (%)
Mortgage status - with second mortgage (%)
Mortgage status - with home equity loan (%)
Mortgage status - with both second mortgage and home equity loan (%)
Mortgage status - without a mortgage (%)
Median year house/condo built
Median year apartment built
Household type by relationship - Male householder living alone (%)
Household type by relationship - Male householder not living alone (%)
Household type by relationship - Female householder living alone (%)
Household type by relationship - Female householder not living alone (%)
Household type by relationship - Opposite-Sex spouse (%)
Household type by relationship - Same-Sex spouse (%)
Household type by relationship - Opposite-Sex unmarried partner (%)
Household type by relationship - Same-Sex unmarried partner (%)
Household type by relationship - In group quarters (%)
Size of family households - 2-person household (%)
Size of family households - 3-person household (%)
Size of family households - 4-person household (%)
Size of family households - 5-person household (%)
Size of family households - 6-person household (%)
Size of family households - 7-or-more-person household (%)
Size of nonfamily households - 1-person household (%)
Size of nonfamily households - 2-person household (%)
Size of nonfamily households - 3-person household (%)
Size of nonfamily households - 4-person household (%)
Size of nonfamily households - 5-person household (%)
Size of nonfamily households - 6-person household (%)
Size of nonfamily households - 7-or-moreperson household (%)
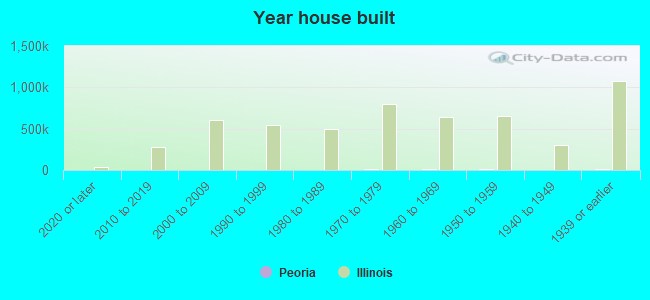
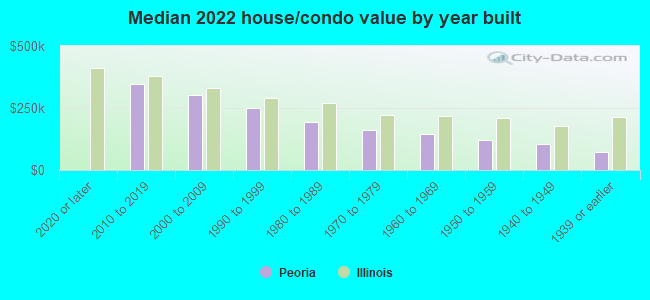
Year house built - Built 2010 or later (%)
Year house built - Built 2000 to 2009 (%)
Year house built - Built 1990 to 1999 (%)
Year house built - Built 1980 to 1989 (%)
Year house built - Built 1970 to 1979 (%)
Year house built - Built 1960 to 1969 (%)
Year house built - Built 1950 to 1959 (%)
Year house built - Built 1940 to 1949 (%)
Year house built - Built 1939 or earlier (%)
Median number of rooms in houses and condos
Median number of rooms in apartments
Median number of bedrooms in owner occupied houses
Mean number of bedrooms in owner occupied houses
Median number of bedrooms in renter occupied houses
Mean number of bedrooms in renter occupied houses
Median number of vehichles in owner occupied houses
Mean number of vehichles in owner occupied houses
Median number of vehichles in renter occupied houses
Mean number of vehichles in renter occupied houses
Rooms in owner-occupied houses - 1 room (%)
Rooms in owner-occupied houses - 2 rooms (%)
Rooms in owner-occupied houses - 3 rooms (%)
Rooms in owner-occupied houses - 4 rooms (%)
Rooms in owner-occupied houses - 5 rooms (%)
Rooms in owner-occupied houses - 6 rooms (%)
Rooms in owner-occupied houses - 7 rooms (%)
Rooms in owner-occupied houses - 8 rooms (%)
Rooms in owner-occupied houses - 9+ rooms (%)
Rooms in renter-occupied houses - 1 room (%)
Rooms in renter-occupied houses - 2 rooms (%)
Rooms in renter-occupied houses - 3 rooms (%)
Rooms in renter-occupied houses - 4 rooms (%)
Rooms in renter-occupied houses - 5 rooms (%)
Rooms in renter-occupied houses - 6 rooms (%)
Rooms in renter-occupied houses - 7 rooms (%)
Rooms in renter-occupied houses - 8 rooms (%)
Rooms in renter-occupied houses - 9+ rooms (%)
Bedrooms in owner-occupied houses - no bedrooms (%)
Bedrooms in owner-occupied houses - 1 bedroom (%)
Bedrooms in owner-occupied houses - 2 bedrooms (%)
Bedrooms in owner-occupied houses - 3 bedrooms (%)
Bedrooms in owner-occupied houses - 4 bedrooms (%)
Bedrooms in owner-occupied houses - 5+ bedrooms (%)
Bedrooms in renter-occupied houses - no bedrooms (%)
Bedrooms in renter-occupied houses - 1 bedroom (%)
Bedrooms in renter-occupied houses - 2 bedrooms (%)
Bedrooms in renter-occupied houses - 3 bedrooms (%)
Bedrooms in renter-occupied houses - 4 bedrooms (%)
Bedrooms in renter-occupied houses - 5+ bedrooms (%)
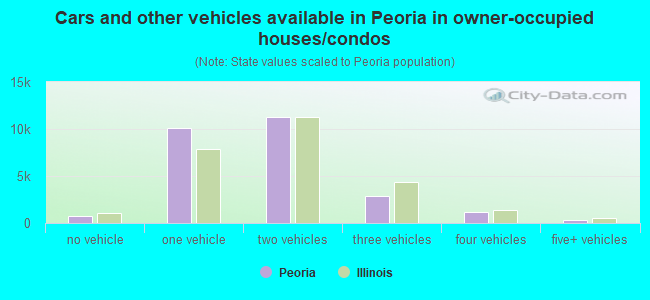
Vehicles available in owner-occupied houses - no vehicle available (%)
Vehicles available in owner-occupied houses - 1 vehicle available(%)
Vehicles available in owner-occupied houses - 2 Vehicles available (%)
Vehicles available in owner-occupied houses - 3 Vehicles available (%)
Vehicles available in owner-occupied houses - 4 Vehicles available (%)
Vehicles available in owner-occupied houses - 5+ Vehicles available (%)
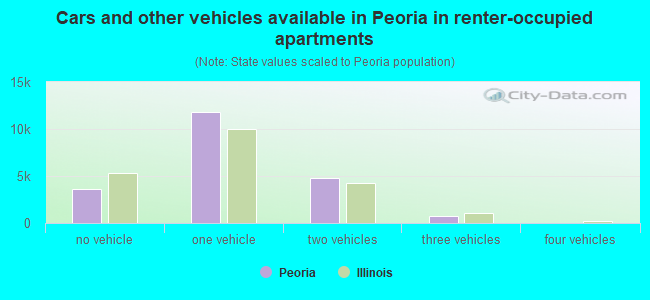
Vehicles available in renter-occupied houses - no vehicle available (%)
Vehicles available in renter-occupied houses - 1 vehicle available (%)
Vehicles available in renter-occupied houses - 2 Vehicles available (%)
Vehicles available in renter-occupied houses - 3 Vehicles available (%)
Vehicles available in renter-occupied houses - 4 Vehicles available (%)
Vehicles available in renter-occupied houses - 5+ Vehicles available (%)
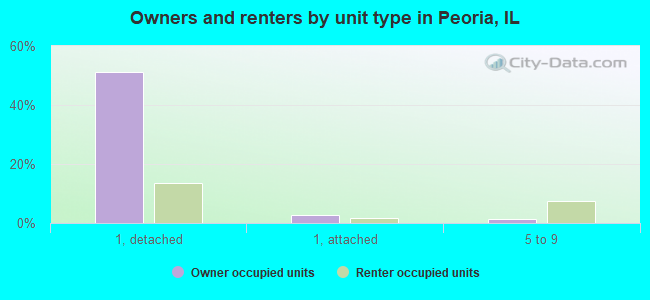
Housing units in structures - 1, detached (%)
Housing units in structures - 1, attached (%)
Housing units in structures - 2 (%)
Housing units in structures - 3 or 4 (%)
Housing units in structures - 5 to 9 (%)
Housing units in structures - 10 to 19 (%)
Housing units in structures - 20 to 49 (%)
Housing units in structures - 50 or more (%)
Housing units in structures - Mobile home (%)
Housing units in structures - Boat, RV, van, etc. (%)
Housing units in structures - Owners - 1, detached (%)
Housing units in structures - Owners - 1, attached (%)
Housing units in structures - Owners - 2 (%)
Housing units in structures - Owners - 3 or 4 (%)
Housing units in structures - Owners - 5 to 9 (%)
Housing units in structures - Owners - 10 to 19 (%)
Housing units in structures - Owners - 20 to 49 (%)
Housing units in structures - Owners - 50 or more (%)
Housing units in structures - Owners - Mobile home (%)
Housing units in structures - Owners - Boat, RV, van, etc. (%)
Housing units in structures - Renters - 1, detached (%)
Housing units in structures - Renters - 1, attached (%)
Housing units in structures - Renters - 2 (%)
Housing units in structures - Renters - 3 or 4 (%)
Housing units in structures - Renters - 5 to 9 (%)
Housing units in structures - Renters - 10 to 19 (%)
Housing units in structures - Renters - 20 to 49 (%)
Housing units in structures - Renters - 50 or more (%)
Housing units in structures - Renters - Mobile home (%)
Housing units in structures - Renters - Boat, RV, van, etc. (%)
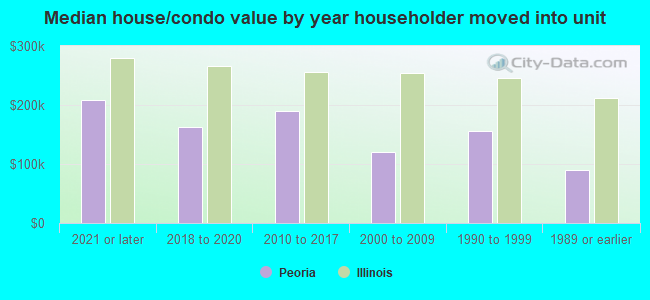
House/condo owner moved in on average (years ago)
Renter moved in on average (years ago)
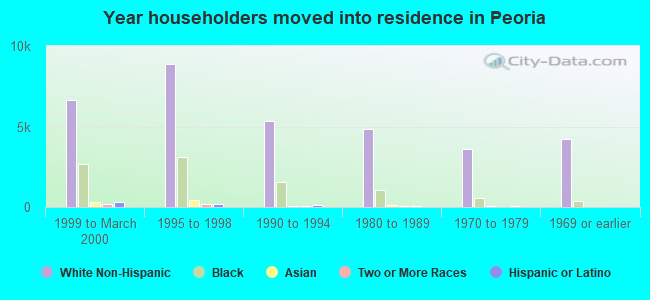
Year householder moved into unit - Moved in 1999 to March 2000 (%)
Year householder moved into unit - Moved in 1999 to March 2000 (%) - White
Year householder moved into unit - Moved in 1999 to March 2000 (%) - Black or African American
Year householder moved into unit - Moved in 1999 to March 2000 (%) - Asian
Year householder moved into unit - Moved in 1999 to March 2000 (%) - Hispanic or Latino
Year householder moved into unit - Moved in 1999 to March 2000 (%) - American Indian and Alaska Native
Year householder moved into unit - Moved in 1999 to March 2000 (%) - Multirace
Year householder moved into unit - Moved in 1999 to March 2000 (%) - Other Race
Year householder moved into unit - Moved in 1995 to 1998 (%)
Year householder moved into unit - Moved in 1995 to 1998 (%) - White
Year householder moved into unit - Moved in 1995 to 1998 (%) - Black or African American
Year householder moved into unit - Moved in 1995 to 1998 (%) - Asian
Year householder moved into unit - Moved in 1995 to 1998 (%) - Hispanic or Latino
Year householder moved into unit - Moved in 1995 to 1998 (%) - American Indian and Alaska Native
Year householder moved into unit - Moved in 1995 to 1998 (%) - Multirace
Year householder moved into unit - Moved in 1995 to 1998 (%) - Other Race
Year householder moved into unit - Moved in 1990 to 1994 (%)
Year householder moved into unit - Moved in 1990 to 1994 (%) - White
Year householder moved into unit - Moved in 1990 to 1994 (%) - Black or African American
Year householder moved into unit - Moved in 1990 to 1994 (%) - Asian
Year householder moved into unit - Moved in 1990 to 1994 (%) - Hispanic or Latino
Year householder moved into unit - Moved in 1990 to 1994 (%) - American Indian and Alaska Native
Year householder moved into unit - Moved in 1990 to 1994 (%) - Multirace
Year householder moved into unit - Moved in 1990 to 1994 (%) - Other Race
Year householder moved into unit - Moved in 1980 to 1989 (%)
Year householder moved into unit - Moved in 1980 to 1989 (%) - White
Year householder moved into unit - Moved in 1980 to 1989 (%) - Black or African American
Year householder moved into unit - Moved in 1980 to 1989 (%) - Asian
Year householder moved into unit - Moved in 1980 to 1989 (%) - Hispanic or Latino
Year householder moved into unit - Moved in 1980 to 1989 (%) - American Indian and Alaska Native
Year householder moved into unit - Moved in 1980 to 1989 (%) - Multirace
Year householder moved into unit - Moved in 1980 to 1989 (%) - Other Race
Year householder moved into unit - Moved in 1970 to 1979 (%)
Year householder moved into unit - Moved in 1970 to 1979 (%) - White
Year householder moved into unit - Moved in 1970 to 1979 (%) - Black or African American
Year householder moved into unit - Moved in 1970 to 1979 (%) - Asian
Year householder moved into unit - Moved in 1970 to 1979 (%) - Hispanic or Latino
Year householder moved into unit - Moved in 1970 to 1979 (%) - American Indian and Alaska Native
Year householder moved into unit - Moved in 1970 to 1979 (%) - Multirace
Year householder moved into unit - Moved in 1970 to 1979 (%) - Other Race
Year householder moved into unit - Moved in 1969 or earlier (%)
Year householder moved into unit - Moved in 1969 or earlier (%) - White
Year householder moved into unit - Moved in 1969 or earlier (%) - Black or African American
Year householder moved into unit - Moved in 1969 or earlier (%) - Asian
Year householder moved into unit - Moved in 1969 or earlier (%) - Hispanic or Latino
Year householder moved into unit - Moved in 1969 or earlier (%) - American Indian and Alaska Native
Year householder moved into unit - Moved in 1969 or earlier (%) - Multirace
Year householder moved into unit - Moved in 1969 or earlier (%) - Other Race
Housing units lacking complete plumbing facilities (%)
Housing units lacking complete kitchen facilities (%)
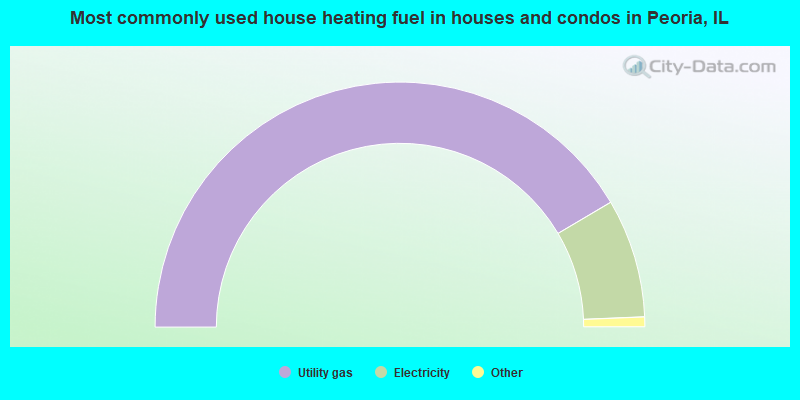
House heating fuel used in houses and condos - Utility gas (%)
House heating fuel used in houses and condos - Bottled, tank, or LP gas (%)
House heating fuel used in houses and condos - Electricity (%)
House heating fuel used in houses and condos - Fuel oil, kerosene, etc. (%)
House heating fuel used in houses and condos - Coal or coke (%)
House heating fuel used in houses and condos - Wood (%)
House heating fuel used in houses and condos - Solar energy (%)
House heating fuel used in houses and condos - Other fuel (%)
House heating fuel used in houses and condos - No fuel used (%)
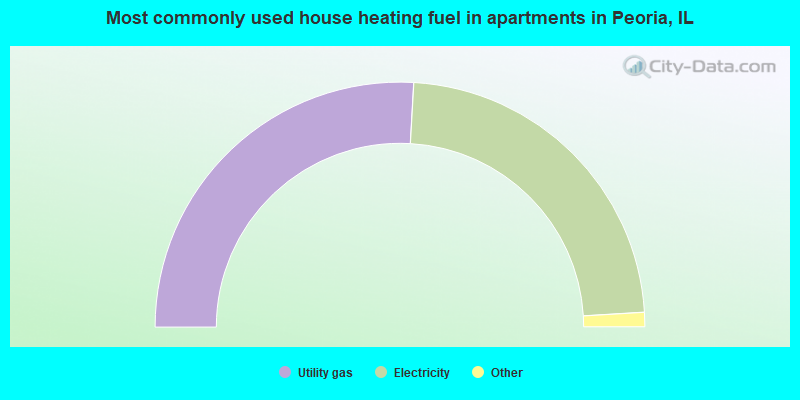
House heating fuel used in apartments - Utility gas (%)
House heating fuel used in apartments - Bottled, tank, or LP gas (%)
House heating fuel used in apartments - Electricity (%)
House heating fuel used in apartments - Fuel oil, kerosene, etc. (%)
House heating fuel used in apartments - Coal or coke (%)
House heating fuel used in apartments - Wood (%)
House heating fuel used in apartments - Solar energy (%)
House heating fuel used in apartments - Other fuel (%)
House heating fuel used in apartments - No fuel used (%)
Latest news about housing in Peoria, IL collected exclusively by city-data.com from local newspapers, TV, and radio stations
Median year house/condo built: 1968Median year apartment built: 1970Household type by relationship:
Households: 109,221
Male householders: 22,455 (7,818 living alone ), Female householders: 25,033 (9,800 living alone )15,910 spouses (15,469 opposite-sex spouses ), 4,069 unmarried partners , (3,824 opposite-sex unmarried partners ), 31,638 children (28,838 natural , 1,510 adopted , 1,290 stepchildren ), 1,723 grandchildren , 639 brothers or sisters , 391 parents , 62 foster children , 1,103 other relatives , 2,131 non-relatives In group quarters: 4,067
Size of family households: 12,136 2-persons , 5,980 3-persons , 3,664 4-persons , 2,649 5-persons , 856 6-persons , 531 7-or-more-persons .
Size of nonfamily households: 17,618 1-person , 3,650 2-persons , 327 3-persons , 77 4-persons .
13,093 married couples with children. single-parent households (2,700 men , 9,961 women ).
87.0% of residents of Peoria speak English at home. of residents speak Spanish at home (64% speak English very well , 17% speak English well , 14% speak English not well , 5% don't speak English at all ).of residents speak other Indo-European language at home (83% speak English very well , 7% speak English well , 8% speak English not well , 2% don't speak English at all ).of residents speak Asian or Pacific Island language at home (70% speak English very well , 20% speak English well , 10% speak English not well ).of residents speak other language at home (75% speak English very well , 19% speak English well , 4% speak English not well , 2% don't speak English at all ).
Foreign born population: 8,501 (7.8%)of them are naturalized citizens )
Median number of rooms in houses and condos:
Median number of rooms in apartments
Owner-occupied Renter-occupied
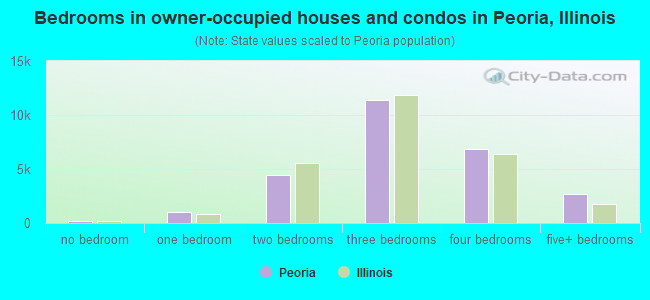
Bedrooms in owner-occupied houses and condos in Peoria, Illinois
159 no bedroom 973 1 bedroom 4,475 2 bedrooms 11,396 3 bedrooms 6,860 4 bedrooms 2,658 5+ bedrooms
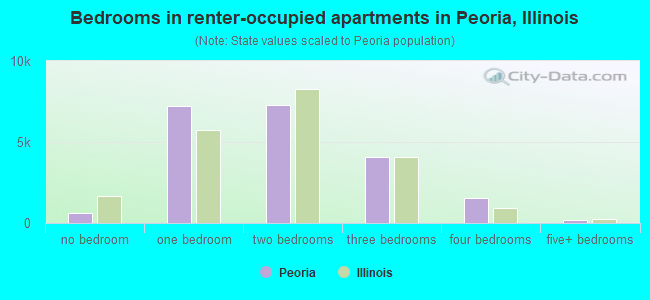
Bedrooms in renter-occupied apartments in Peoria, Illinois
628 no bedroom 7,238 1 bedroom 7,309 2 bedrooms 4,045 3 bedrooms 1,552 4 bedrooms 195 5+ bedrooms
Owner-occupied Renter-occupied
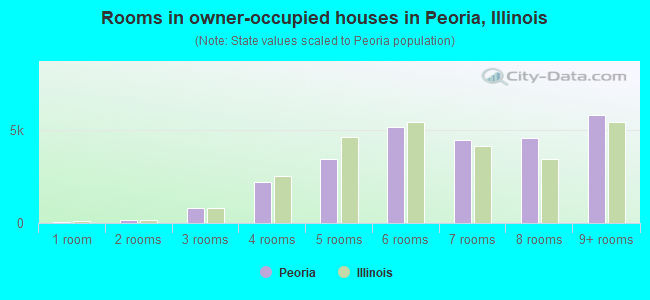
Rooms in owner-occupied houses in Peoria, Illinois
42 1 room 147 2 rooms 820 3 rooms 2,200 4 rooms 3,418 5 rooms 5,159 6 rooms 4,430 7 rooms 4,528 8 rooms 5,777 9+ rooms
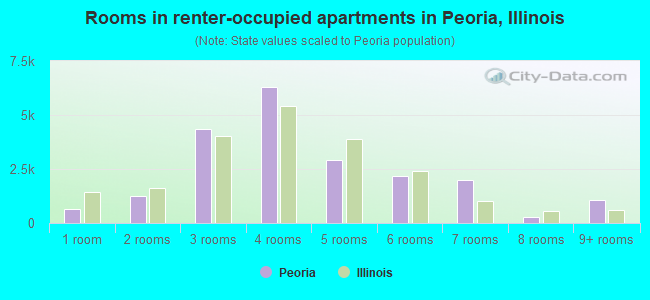
Rooms in renter-occupied apartments in Peoria, Illinois
628 1 room 1,243 2 rooms 4,357 3 rooms 6,317 4 rooms 2,918 5 rooms 2,178 6 rooms 1,978 7 rooms 299 8 rooms 1,049 9+ rooms
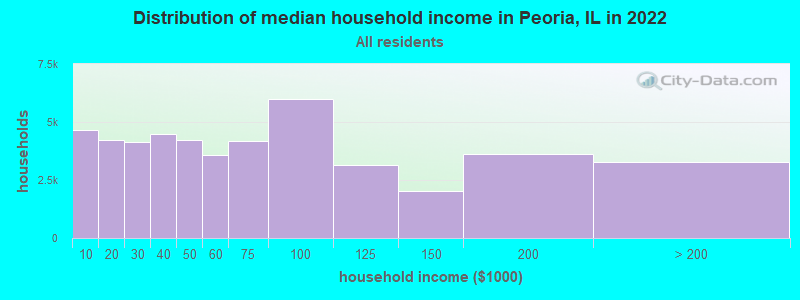
Peoria, IL household income distribution 4,653 Less than $10,0004,224 $10,000 to $19,9994,123 $20,000 to $29,9994,475 $30,000 to $39,9994,241 $40,000 to $49,9993,580 $50,000 to $59,9994,183 $60,000 to $74,9996,002 $75,000 to $99,9993,130 $100,000 to $124,9992,007 $125,000 to $149,9993,602 $150,000 to $199,9993,268 $200,000 or more
Home value of owner - occupied houses in 2022 in Peoria, IL 292 Less than $10,000181 $10,000 to $14,999453 $15,000 to $19,999561 $20,000 to $24,999115 $25,000 to $29,999179 $30,000 to $34,999219 $35,000 to $39,999758 $40,000 to $49,999905 $50,000 to $59,9991,219 $60,000 to $69,9991,369 $70,000 to $79,999836 $80,000 to $89,9991,209 $90,000 to $99,9992,308 $100,000 to $124,9992,504 $125,000 to $149,9992,657 $150,000 to $174,9991,674 $175,000 to $199,9992,625 $200,000 to $249,9992,038 $250,000 to $299,9992,357 $300,000 to $399,999410 $400,000 to $499,999653 $500,000 to $749,999846 $750,000 to $999,999153 $1,000,000 to $1,499,999Rent paid by renters in 2022 in Peoria, IL 155 Less than $100366 $100 to $149117 $150 to $1991,406 $200 to $24949 $250 to $299166 $300 to $349392 $350 to $399286 $400 to $449847 $450 to $4991,404 $500 to $549914 $550 to $5992,283 $600 to $6492,102 $650 to $6991,033 $700 to $7491,464 $750 to $7991,722 $800 to $8991,515 $900 to $9992,547 $1,000 to $1,249972 $1,250 to $1,499701 $1,500 to $1,99987 $2,000 to $2,499123 $3,500 or more316 No cash rent
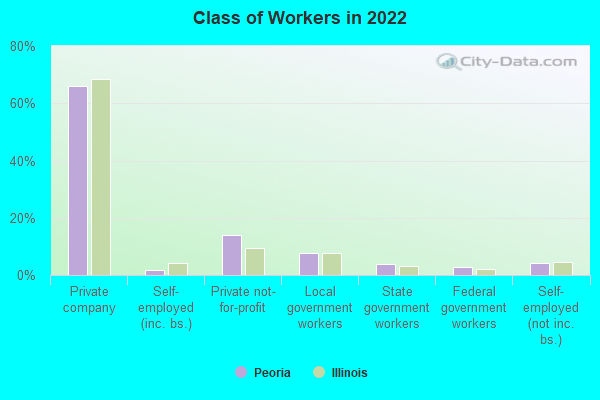
Percentage of workers working in this county: 82.0%Number of people working at home: 5,938 (12.0% of all workers )
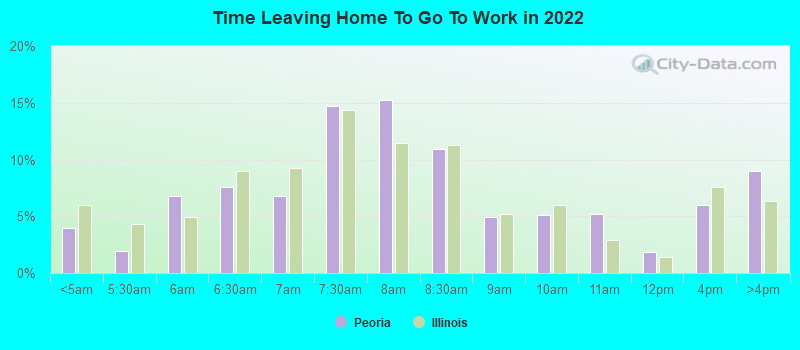
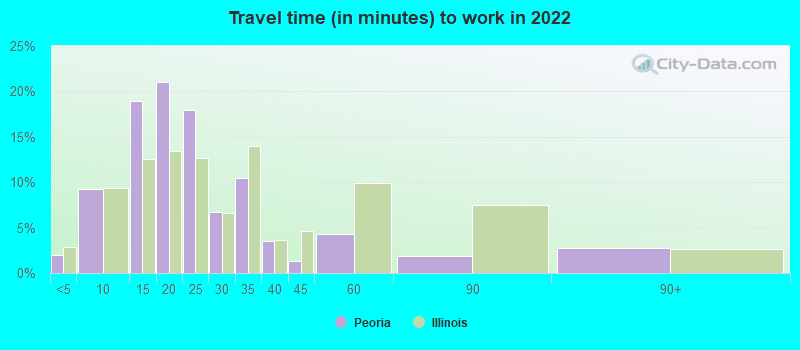
Travel time to work (commute)
Less than 5 minutes: 7685 to 9 minutes: 5,75110 to 14 minutes: 10,63415 to 19 minutes: 10,32020 to 24 minutes: 6,69625 to 29 minutes: 3,12830 to 34 minutes: 1,35035 to 39 minutes: 1,53840 to 44 minutes: 95245 to 59 minutes: 1,39260 to 89 minutes: 30390 or more minutes: 628
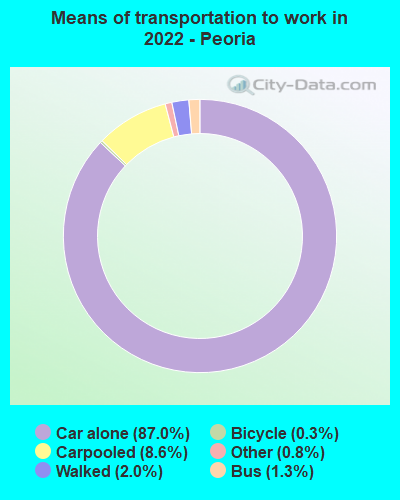
Means of transportation to work:
Drove a car alone: 56,678 (77.5%)Carpooled: 6,452 (8.8%)Bus : 934 (1.3%)Subway or elevated rail : 2 (0.0%)Taxi: 1,030 (1.4%)Bicycle: 94 (0.1%)Walked: 1,294 (1.8%)Worked at home: 6,439 (8.8%)
Unemployment by race in 2022
Unemployment rate for White non-Hispanic residents 3.2% Males3.7% FemalesUnemployment rate for Black residents 13.8% Males1.9% FemalesUnemployment rate for American Indian and Alaska Native residents 41.9% MalesUnemployment rate for Asian residents 2.7% Males4.1% FemalesUnemployment rate for other race residents 9.7% Males11.7% FemalesUnemployment rate for two or more race residents 10.8% Males16.7% FemalesUnemployment rate for Hispanic or Latino residents 10.1% Males14.6% Females
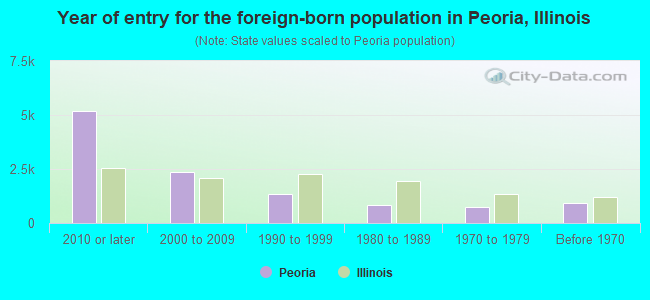
Year of entry for the foreign-born population in Peoria, Illinois
5,197 2010 or later 2,362 2000 to 2009 1,341 1990 to 1999 828 1980 to 1989 735 1970 to 1979 926 Before 1970
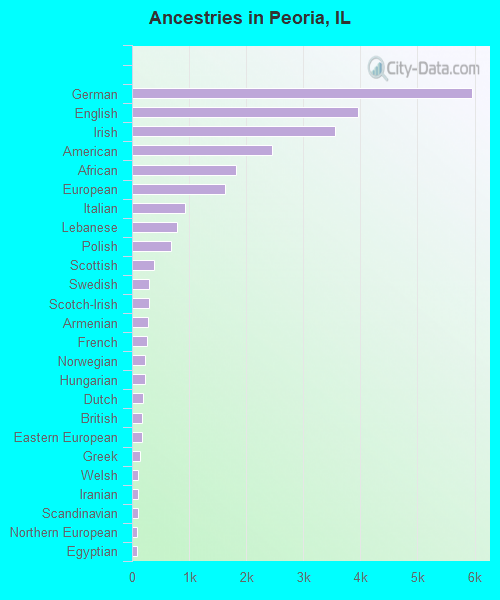
First ancestries reported:
German: 5,955 (10.5%)
English: 3,955 (7.0%)
Irish: 3,556 (6.3%)
American: 2,450 (4.3%)
African: 1,821 (3.2%)
European: 1,629 (2.9%)
Italian: 929 (1.6%)
Lebanese: 791 (1.4%)
Polish: 682 (1.2%)
Scottish: 390 (0.7%)
Swedish: 293 (0.5%)
Scotch-Irish: 290 (0.5%)
Armenian: 272 (0.5%)
French: 261 (0.5%)
Norwegian: 235 (0.4%)
Hungarian: 225 (0.4%)
Dutch: 192 (0.3%)
British: 177 (0.3%)
Eastern European: 177 (0.3%)
Greek: 133 (0.2%)
Welsh: 110 (0.2%)
Iranian: 108 (0.2%)
Scandinavian: 101 (0.2%)
Northern European: 92 (0.2%)
Egyptian: 84 (0.1%)
Australian: 63 (0.1%)
Croatian: 63 (0.1%)
Swiss: 61 (0.1%)
Ghanaian: 56 (0.10%)
Romanian: 54 (0.10%)
Ukrainian: 51 (0.09%)
Portuguese: 48 (0.09%)
Nigerian: 45 (0.08%)
Czech: 44 (0.08%)
Danish: 43 (0.08%)
Russian: 42 (0.07%)
French Canadian: 38 (0.07%)
Trinidadian and Tobagonian: 37 (0.07%)
Ethiopian: 32 (0.06%)
Maltese: 29 (0.05%)
Pennsylvania German: 27 (0.05%)
Moroccan: 26 (0.05%)
Austrian: 23 (0.04%)
Brazilian: 22 (0.04%)
Turkish: 21 (0.04%)
Slovak: 18 (0.03%)
Palestinian: 18 (0.03%)
Lithuanian: 16 (0.03%)
Bulgarian: 16 (0.03%)
Czechoslovakian: 12 (0.02%)
Cape Verdean: 10 (0.02%)
Jordanian: 8 (0.01%)
Slavic: 6 (0.01%)
Albanian: 5 (0.01%)
Belgian: 5 (0.01%)
Sudanese: 4 (0.01%)
Bahamian: 3 (0.01%)
Most common places of birth for foreign-born residents (%): India Peoria:
28.8% (2,967)Illinois:
9.2% (166,409)
Mexico Peoria:
11.2% (1,155)Illinois:
34.7% (626,958)
China, excluding Hong Kong and Taiwan Peoria:
7.9% (813)Illinois:
4.1% (74,364)
Nigeria Peoria:
5.3% (547)Illinois:
1.2% (21,186)
Jamaica Peoria:
4.9% (508)Illinois:
0.5% (8,168)
Vietnam Peoria:
4.6% (469)Illinois:
1.2% (22,269)
Philippines Peoria:
4.3% (448)Illinois:
5.2% (93,003)
Lebanon Peoria:
3.2% (327)Illinois:
0.2% (3,080)
Armenia Peoria:
2.4% (250)Illinois:
0.0% (734)
Honduras Peoria:
2.2% (223)Illinois:
0.6% (10,762)
Korea Peoria:
2.1% (218)Illinois:
2.2% (40,393)
Pakistan Peoria:
2.1% (214)Illinois:
1.6% (29,519)
Place of birth for U.S.-born residents:
This state: 78,684Other state: 20,551Northeast: 1,533Midwest: 7,750South: 6,554West: 4,714 81.0% of Peoria residents lived in the same house 1 years ago.
Out of people who lived in different houses, 38.9% lived in this county.
Out of people who lived in different counties, 70.1% lived in Illinois.
Peoria:
81.0%State average:
88.3%
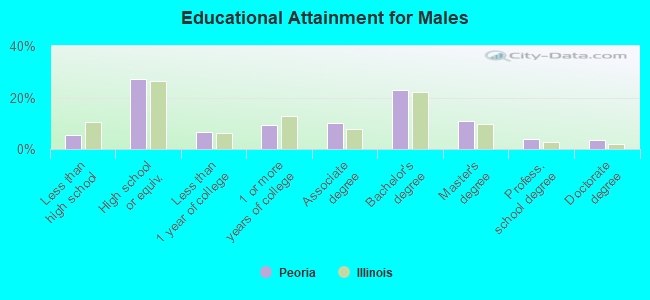
Education attainment for males 25 years and older:
No schooling: 259Nursery to 4th grade: 05th and 6th grade: 2217th and 8th grade: 409th grade: 21510th grade: 13611th grade: 8812th grade, no diploma: 759High school graduate (or equivalency): 8,700Less than 1 year of college: 2,117Some college more than 1 year, no degree: 3,006Associate degree: 3,235Bachelor's degree: 7,360Master's degree: 3,520Professional school degree: 1,197Doctorate degree: 1,103
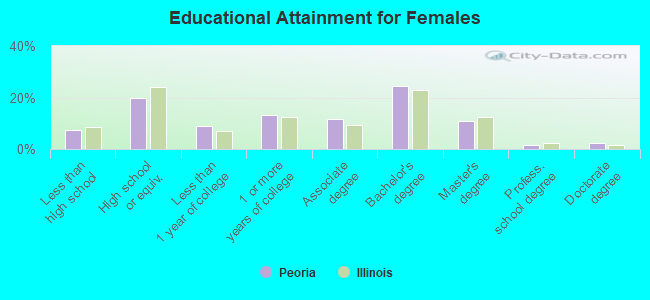
Education attainment for females 25 years and older:
No schooling: 346Nursery to 4th grade: 315th and 6th grade: 07th and 8th grade: 2809th grade: 54710th grade: 37011th grade: 12312th grade, no diploma: 891High school graduate (or equivalency): 7,069Less than 1 year of college: 3,158Some college more than 1 year, no degree: 4,690Associate degree: 4,183Bachelor's degree: 8,679Master's degree: 3,926Professional school degree: 529Doctorate degree: 866
Housing units in structures:
One, detached: 32,819One, attached: 2,701Two: 1,9463 or 4: 7975 to 9: 4,80410 to 19: 2,72520 to 49: 2,99650 or more: 3,032Mobile homes: 427Median worth of mobile homes: $18,200
Housing units lacking complete plumbing facilities in 2022: 0.6%Housing units lacking complete kitchen facilities in 2022: 2.4%House/condo owner moved in on average 9 years ago
Renter moved in on average 2 years ago
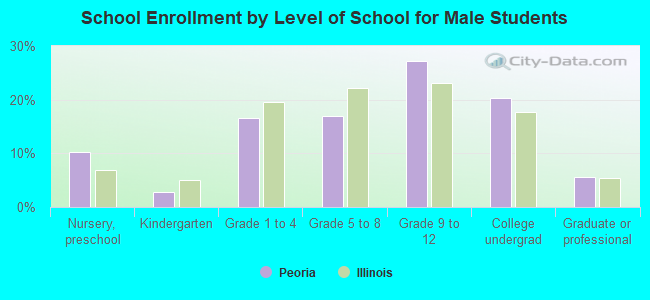
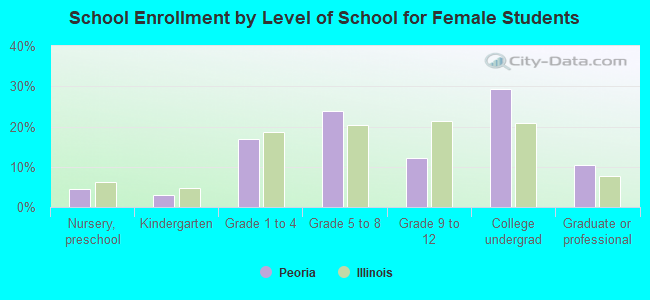
Private vs. public school enrollment:
Students in private schools in grades 1 to 8 (elementary and middle school): 1,801 Students in private schools in grades 9 to 12 (high school): 786 Students in private undergraduate colleges: 2,819