Housing density: 270 houses/condos per square mile
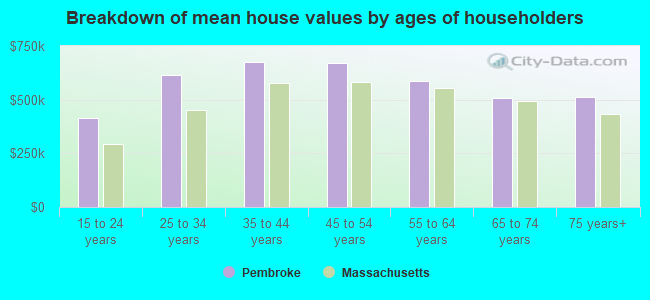
Median price asked for vacant for-sale houses and condos in 2022 in this county: $446,078.
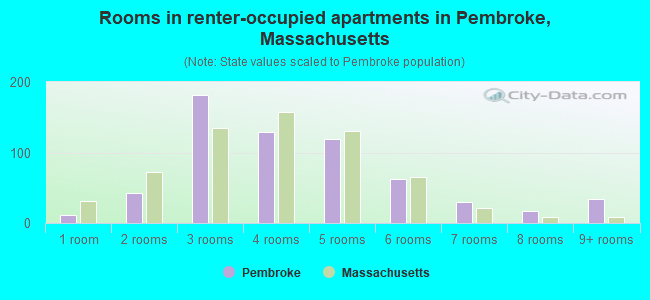
Median contract rent in 2022: $1,305 (lower quartile is $779, upper quartile is over $2,000)
Median rent asked for vacant for-rent units in 2022: $2,028
Median gross rent in Pembroke, MA in 2022: $1,576
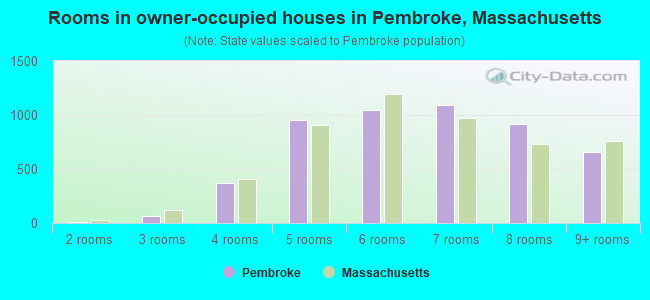
Housing units in Pembroke with a mortgage: 3,934 (424 second mortgage, 516 home equity loan, 11 both second mortgage and home equity loan) Houses without a mortgage: 985
In family households: 417,329 (86,307 male householders, 41,618 female householders)
97,089 spouses, 154,870 children (146,729 natural, 3,391 adopted, 4,750 stepchildren), 8,780 grandchildren, 4,455 brothers or sisters, 5,200 parents, foster children, 5,123 other relatives, 10,196 non-relatives
In nonfamily households: 65,769 (22,929 male householders (17,306 living alone)), 30,272 female householders (25,724 living alone)), 12,568 nonrelatives
In group quarters: 11,821 (7,645 institutionalized population)
92,167 married couples with children.
24,193 single-parent households (4,628 men, 19,565 women).
96.3% of residents of Pembroke speak English at home.
1.2% of residents speak Spanish at home (56% speak English very well, 24% speak English well, 20% speak English not well).
2.1% of residents speak other Indo-European language at home (85% speak English very well, 8% speak English well, 6% speak English not well).
0.4% of residents speak Asian or Pacific Island language at home (43% speak English very well, 49% speak English well, 8% speak English not well).
0.1% of residents speak other language at home (100% speak English very well).
Foreign born population: 682 (3.6%)
(98.2% of them are naturalized citizens)
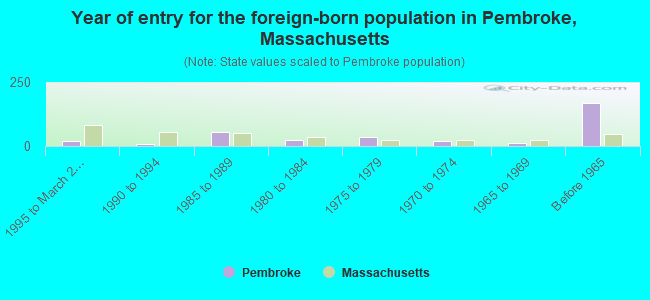
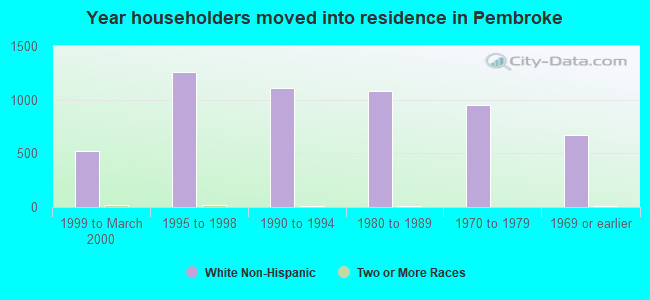
Year of entry for the foreign-born population in Pembroke, Massachusetts
191995 to March 2000
81990 to 1994
541985 to 1989
251980 to 1984
351975 to 1979
201970 to 1974
121965 to 1969
167Before 1965
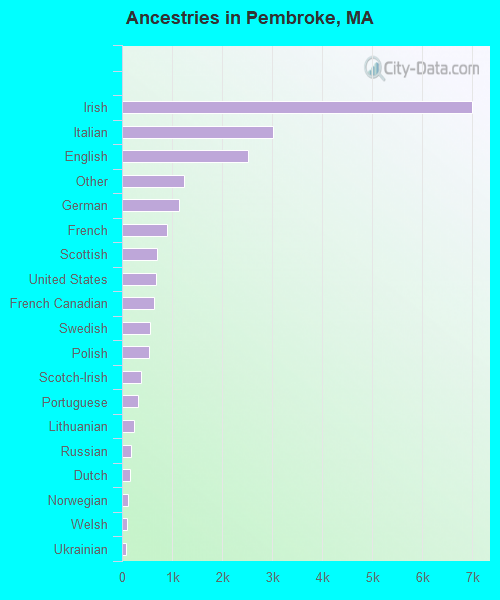
First ancestries reported:
Irish: 6,986 (33.6%)
Italian: 3,020 (14.5%)
English: 2,522 (12.1%)
Other: 1,230 (5.9%)
German: 1,146 (5.5%)
French: 897 (4.3%)
Scottish: 703 (3.4%)
United States: 678 (3.3%)
French Canadian: 643 (3.1%)
Swedish: 569 (2.7%)
Polish: 537 (2.6%)
Scotch-Irish: 387 (1.9%)
Portuguese: 315 (1.5%)
Lithuanian: 231 (1.1%)
Russian: 184 (0.9%)
Dutch: 153 (0.7%)
Norwegian: 122 (0.6%)
Welsh: 99 (0.5%)
Ukrainian: 74 (0.4%)
Greek: 61 (0.3%)
Subsaharan African: 58 (0.3%)
Arab: 46 (0.2%)
Danish: 32 (0.2%)
Swiss: 30 (0.1%)
Slovak: 29 (0.1%)
Czech: 20 (0.10%)
Hungarian: 12 (0.06%)
West Indian: 11 (0.05%)
Most common places of birth for foreign-born residents (%):
Ireland
Pembroke:
16.5% (56)
Massachusetts:
2.3% (17,987)
United Kingdom
Pembroke:
14.7% (50)
Massachusetts:
3.3% (25,403)
Germany
Pembroke:
12.6% (43)
Massachusetts:
1.9% (14,883)
India
Pembroke:
11.8% (40)
Massachusetts:
3.6% (28,086)
Canada
Pembroke:
9.7% (33)
Massachusetts:
5.2% (40,247)
Vietnam
Pembroke:
9.1% (31)
Massachusetts:
3.9% (30,457)
Portugal
Pembroke:
4.7% (16)
Massachusetts:
8.6% (66,627)
Korea
Pembroke:
2.6% (9)
Massachusetts:
1.7% (13,456)
Italy
Pembroke:
2.4% (8)
Massachusetts:
3.7% (28,319)
Iran
Pembroke:
2.4% (8)
Massachusetts:
0.6% (4,416)
Other Western Europe
Pembroke:
2.1% (7)
Massachusetts:
0.3% (2,642)
Other Eastern Europe
Pembroke:
2.1% (7)
Massachusetts:
1.6% (12,350)
Japan
Pembroke:
2.1% (7)
Massachusetts:
1.1% (8,682)
Ecuador
Pembroke:
2.1% (7)
Massachusetts:
0.4% (3,066)
Poland
Pembroke:
1.8% (6)
Massachusetts:
1.8% (13,543)
Other Western Africa
Pembroke:
1.8% (6)
Massachusetts:
2.6% (20,299)
Other Central America
Pembroke:
1.8% (6)
Massachusetts:
0.1% (400)
Place of birth for U.S.-born residents:
This state: 14,690
Other state: 1,841
Northeast: 1,201
Midwest: 207
South: 275
West: 158
71% of Pembroke residents lived in the same house 5 years ago. Out of people who lived in different houses, 56% lived in this county. Out of people who lived in different counties, 84% lived in Massachusetts.
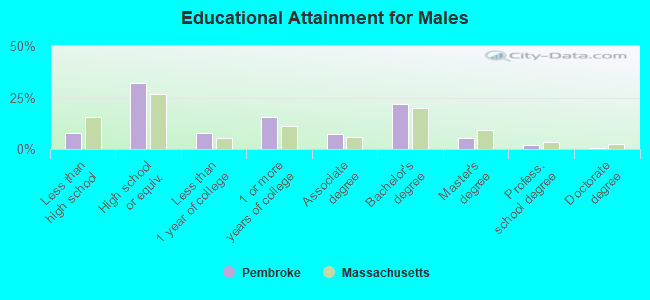
Education attainment for males 25 years and older:
No schooling: 42
Nursery to 4th grade: 6
5th and 6th grade: 15
7th and 8th grade: 35
9th grade: 50
10th grade: 80
11th grade: 74
12th grade, no diploma: 123
High school graduate (or equivalency): 1,703
Less than 1 year of college: 420
Some college more than 1 year, no degree: 838
Associate degree: 395
Bachelor's degree: 1,157
Master's degree: 283
Professional school degree: 93
Doctorate degree: 25
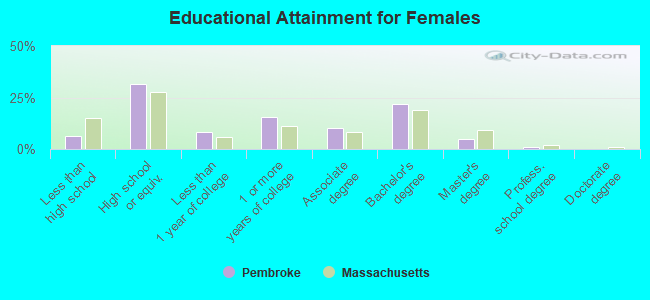
Education attainment for females 25 years and older:
No schooling: 32
Nursery to 4th grade: 6
5th and 6th grade: 16
7th and 8th grade: 59
9th grade: 12
10th grade: 94
11th grade: 48
12th grade, no diploma: 92
High school graduate (or equivalency): 1,819
Less than 1 year of college: 479
Some college more than 1 year, no degree: 883
Associate degree: 599
Bachelor's degree: 1,265
Master's degree: 288
Professional school degree: 42
Doctorate degree: 8
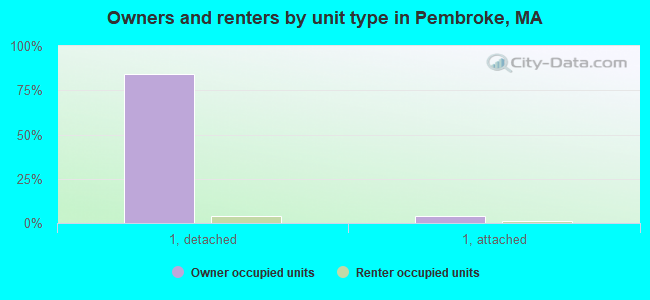
Housing units in structures:
One, detached: 5,221
One, attached: 274
Two: 81
3 or 4: 91
5 to 9: 140
10 to 19: 66
20 to 49: 6
50 or more: 7
Mobile homes: 11
Housing units lacking complete plumbing facilities: 0.3%
Housing units lacking complete kitchen facilities: 0.3%