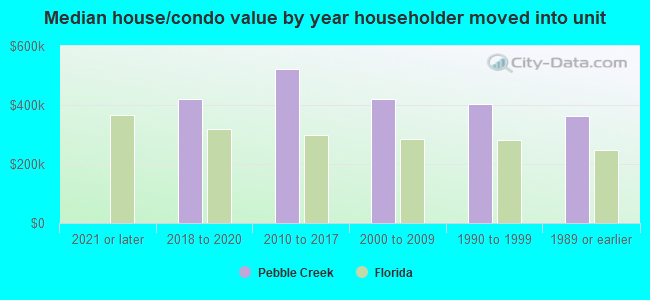
Pebble Creek, FL (Florida) Houses and Residents
| Pebble Creek: | $451,875 |
| Florida: | $354,100 |
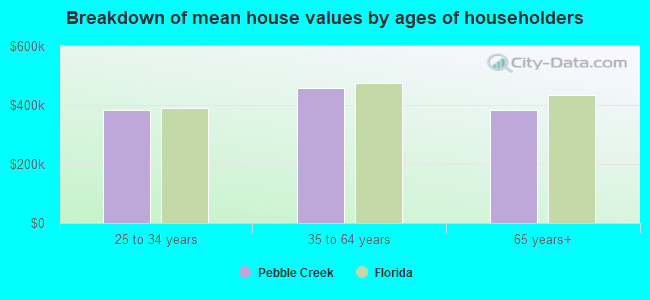
Mean price in 2022:
Detached houses: $402,260
Here: $402,260 State: $500,941 Townhouses or other attached units: $233,708
Here: $233,708 State: $370,869
Total population: 7,622 (Urban population: 4,830, Rural population: 0)
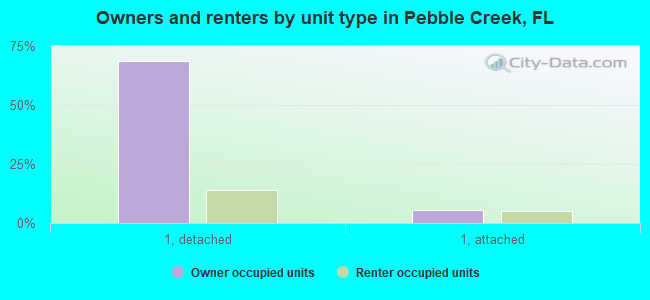
Houses: 3,764 (3,697 occupied: 2,836 owner occupied, 876 renter occupied)
| % of renters here: | 24% |
| State: | 33% |
Housing density: 1,264 houses/condos per square mile
Median price asked for vacant for-sale houses and condos in 2022 in this county: $333,299.
Median contract rent in 2022: $1,791 (lower quartile is $1,447, upper quartile is over $2,000)
Median rent asked for vacant for-rent units in 2022: $1,729
Median gross rent in Pebble Creek, FL in 2022: over $2,000
Housing units in Pebble Creek with a mortgage: 1,853 (247 second mortgage, 0 home equity loan, 254 both second mortgage and home equity loan)
Houses without a mortgage: 0
Median household income for houses/condos with a mortgage: $108,229
Median household income for apartments without a mortgage: $139,519
Median monthly housing costs: $1,766
Compare current foreclosures near Pebble Creek, FL:
| Photo | Address | Area | Beds / Baths | Price | Details |
|---|---|---|---|---|---|

|
#1
Cactus Needle Ln
Wesley Chapel, FL 33544
|
1,576 sq. feet
|
2 baths 3 beds |
$295,000
|
show details |

|
#2
Blazing Trail Way
Land O Lakes, FL 34639
|
2,486 sq. feet
|
3 baths 4 beds |
$452,400
|
show details |

|
#3
Blue Magnolia Rd
Brandon, FL 33510
|
1,231 sq. feet
|
2 baths 2 beds |
$200,000
|
show details |

|
#4
N Merrin St
Plant City, FL 33563
|
2,208 sq. feet
|
2 baths 3 beds |
$435,000
|
show details |

|
#5
King Alfred Dr
Tampa, FL 33610
|
1,043 sq. feet
|
1 baths 3 beds |
show details | |

|
#6
Julie Ln
Brandon, FL 33511
|
1,903 sq. feet
|
2 baths 2 beds |
show details | |

|
#7
N Mulberry St
Tampa, FL 33612
|
1,708 sq. feet
|
2 baths 5 beds |
show details | |

|
#8
Dennison Dr
Tampa, FL 33619
|
1,716 sq. feet
|
2 baths 4 beds |
show details | |

|
#9
Swenson Ter
Lutz, FL 33549
|
1,816 sq. feet
|
2 baths 3 beds |
show details | |

|
#10
Painter Dr
Land O Lakes, FL 34639
|
1,796 sq. feet
|
2 baths 3 beds |
show details |
| Photo | Address | Area | Beds / Baths | Price | Details |
|---|---|---|---|---|---|

|
#11
Twin Lakes Ln # 15
Tampa, FL 33618
|
1,537 sq. feet
|
1 baths 2 beds |
show details | |

|
#12
Temple Park Dr
Tampa, FL 33637
|
1,234 sq. feet
|
2 baths 3 beds |
show details | |

|
#13
Corvilla Dr
Zephyrhills, FL 33540
|
2,319 sq. feet
|
2 baths 4 beds |
show details | |

|
#14
Ravenna Hollow Rd
Odessa, FL 33556
|
1,440 sq. feet
|
2 baths 3 beds |
show details | |

|
#15
Carol Dr
Wesley Chapel, FL 33543
|
1,860 sq. feet
|
2 baths 4 beds |
show details | |

|
#16
E Giddens Ave
Tampa, FL 33610
|
1,210 sq. feet
|
2 baths 2 beds |
show details | |

|
#17
Dew Bloom Rd
Valrico, FL 33594
|
1,318 sq. feet
|
2 baths 3 beds |
show details | |

|
#18
Truman Dr
Seffner, FL 33584
|
1,243 sq. feet
|
2 baths 3 beds |
show details | |

|
#19
Galewood Cir
Tampa, FL 33615
|
1,445 sq. feet
|
1 baths 2 beds |
show details | |

|
#20
S Valrico Rd
Valrico, FL 33594
|
3,568 sq. feet
|
2 baths 3 beds |
show details |
| Photo | Address | Area | Beds / Baths | Price | Details |
|---|---|---|---|---|---|

|
#21
Grasmere Dr
Land O Lakes, FL 34637
|
2,568 sq. feet
|
3 baths 4 beds |
show details | |

|
#22
Cypress Haven Dr
Tampa, FL 33647
|
3,444 sq. feet
|
4 baths 5 beds |
show details | |

|
#23
Shaw Dr
Zephyrhills, FL 33541
|
649 sq. feet
|
1 baths 2 beds |
show details | |

|
#24
N 12th St
Tampa, FL 33604
|
1,160 sq. feet
|
1 baths 3 beds |
show details | |

|
#25
Lancer Dr
Tampa, FL 33618
|
1,452 sq. feet
|
2 baths 3 beds |
show details | |

|
#26
Bass St
Tampa, FL 33617
|
1,130 sq. feet
|
2 baths 3 beds |
show details | |

|
#27
N 20th St
Lutz, FL 33549
|
1,678 sq. feet
|
2 baths 3 beds |
show details | |

|
#28
Winners Cir
Odessa, FL 33556
|
3,662 sq. feet
|
3 baths 5 beds |
show details | |

|
#29
N 21st St
Tampa, FL 33605
|
1,250 sq. feet
|
2 baths 3 beds |
show details | |

|
#30
Mccoy Ct
Zephyrhills, FL 33542
|
1,508 sq. feet
|
1 baths 2 beds |
show details |
| Photo | Address | Area | Beds / Baths | Price | Details |
|---|---|---|---|---|---|

|
#31
W Crawford St
Tampa, FL 33614
|
1,037 sq. feet
|
1 baths 3 beds |
show details | |

|
#32
E 33rd Ave
Tampa, FL 33610
|
1,434 sq. feet
|
1 baths 2 beds |
show details | |

|
#33
N 11th St
Tampa, FL 33603
|
1,378 sq. feet
|
1 baths 2 beds |
show details | |

|
#34
Cognac Cir
Lutz, FL 33558
|
2,833 sq. feet
|
3 baths 4 beds |
show details | |

|
#35
N 53rd St
Tampa, FL 33619
|
1,200 sq. feet
|
2 baths 3 beds |
show details | |

|
#36
E Ida St
Tampa, FL 33610
|
1,386 sq. feet
|
2 baths 3 beds |
show details | |

|
#37
Bradbury Ct
Tampa, FL 33624
|
1,280 sq. feet
|
2 baths 2 beds |
show details | |

|
#38
Grove Point Dr
Tampa, FL 33624
|
1,544 sq. feet
|
2 baths 3 beds |
show details | |

|
#39
Alice Rd
Tampa, FL 33624
|
784 sq. feet
|
1 baths 2 beds |
show details | |

|
#40
E 18th Ave
Tampa, FL 33619
|
896 sq. feet
|
1 baths 2 beds |
show details |
| Photo | Address | Area | Beds / Baths | Price | Details |
|---|---|---|---|---|---|

|
#41
Palm Leaf Dr
Brandon, FL 33510
|
1,460 sq. feet
|
2 baths 3 beds |
show details | |

|
#42
W Hiawatha St
Tampa, FL 33604
|
1,637 sq. feet
|
2 baths 2 beds |
show details | |

|
#43
E 27th Ave
Tampa, FL 33605
|
2,706 sq. feet
|
2 baths 3 beds |
show details | |

|
#44
Shadberry Dr
Tampa, FL 33624
|
1,224 sq. feet
|
1 baths 2 beds |
show details | |

|
#45
Egypt Lake Dr
Tampa, FL 33614
|
1,373 sq. feet
|
2 baths 3 beds |
show details | |

|
#46
Fruitridge St
Brandon, FL 33510
|
2,577 sq. feet
|
2 baths 3 beds |
show details | |

|
#47
Vallejo Pl
Tampa, FL 33614
|
1,667 sq. feet
|
2 baths 3 beds |
show details | |

|
#48
E 33rd Ave
Tampa, FL 33610
|
1,283 sq. feet
|
2 baths 3 beds |
show details | |

|
#49
Marsh Wood Dr
Seffner, FL 33584
|
1,278 sq. feet
|
2 baths 3 beds |
show details | |

|
Check over 1 million property listings on Foreclosure.com!
|
browse all offers | |||


 | I have to rent a house before I move from PHX plz help! (25 replies) |
| Frontier vs Brighthouse (37 replies) |
| Best city to live in Near tampa for Family? (110 replies) |
| Moving to Tampa...Looking for Safe Tampa Suburb (46 replies) |
| How is this area in you opinion? (1 reply) |
| Which Tampa areas to live or avoid? Job in Terrace Park. (7 replies) |

Median year apartment built: 1999
Household type by relationship:
Households: 11,310- Male householders: 1,949 (211 living alone), Female householders: 1,726 (497 living alone)
2,331 spouses (2,331 opposite-sex spouses), 186 unmarried partners, (186 opposite-sex unmarried partners), 4,026 children (3,474 natural, 391 adopted, 159 stepchildren), 168 grandchildren, 56 brothers or sisters, 462 parents, 0 foster children, 106 other relatives, 295 non-relatives
Size of family households: 869 2-persons, 675 3-persons, 812 4-persons, 290 5-persons, 116 6-persons, 127 7-or-more-persons.
Size of nonfamily households: 681 1-person, 133 2-persons, 18 3-persons.
2,621 married couples with children.
477 single-parent households (147 men, 330 women).
54.7% of residents of Pebble Creek speak English at home.
19.8% of residents speak Spanish at home (87% speak English very well, 6% speak English well, 5% speak English not well, 1% don't speak English at all).
14.7% of residents speak other Indo-European language at home (59% speak English very well, 24% speak English well, 8% speak English not well, 8% don't speak English at all).
3.0% of residents speak Asian or Pacific Island language at home (62% speak English very well, 28% speak English well, 11% speak English not well).
8.2% of residents speak other language at home (92% speak English very well, 8% speak English well).
Foreign born population: 3,239 (28.6%)
(66.9% of them are naturalized citizens)
| Here: | 7.2 |
| State: | 5.9 |
| Here: | 5.2 |
| State: | 4.2 |
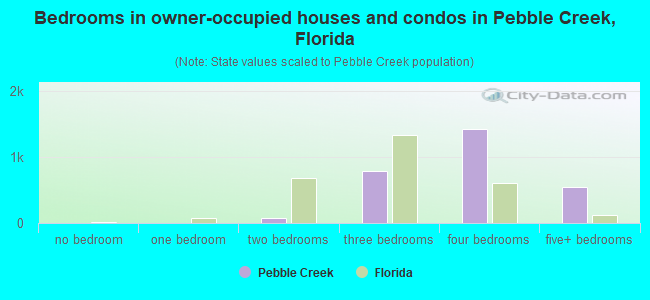
- Bedrooms in owner-occupied houses and condos in Pebble Creek, Florida
- 0no bedroom
- 01 bedroom
- 822 bedrooms
- 7803 bedrooms
- 1,4234 bedrooms
- 5525+ bedrooms
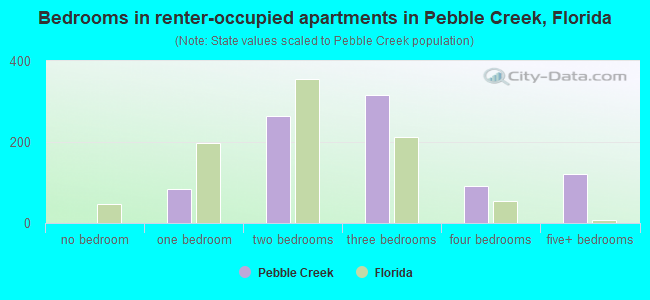
- Bedrooms in renter-occupied apartments in Pebble Creek, Florida
- 0no bedroom
- 841 bedroom
- 2632 bedrooms
- 3153 bedrooms
- 924 bedrooms
- 1225+ bedrooms
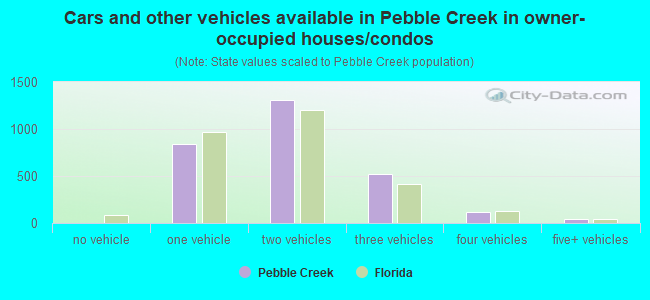
- Cars and other vehicles available in Pebble Creek in owner-occupied houses/condos
- 5no vehicle
- 8361 vehicle
- 1,3122 vehicles
- 5183 vehicles
- 1204 vehicles
- 455+ vehicles
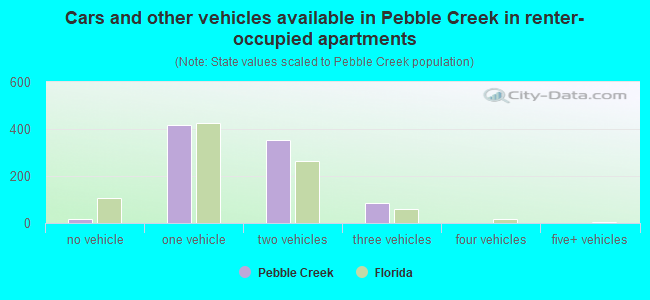
- Cars and other vehicles available in Pebble Creek in renter-occupied apartments
- 19no vehicle
- 4191 vehicle
- 3542 vehicles
- 843 vehicles
- 04 vehicles
- 05+ vehicles
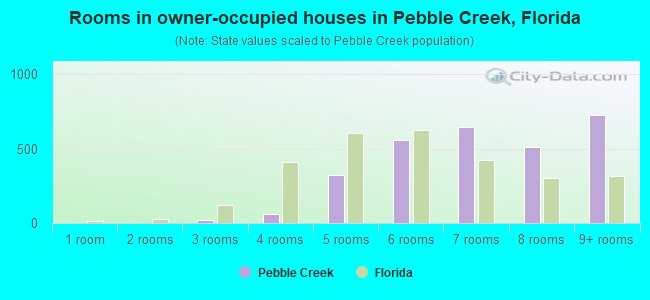
- Rooms in owner-occupied houses in Pebble Creek, Florida
- 01 room
- 02 rooms
- 193 rooms
- 584 rooms
- 3215 rooms
- 5576 rooms
- 6427 rooms
- 5138 rooms
- 7269+ rooms
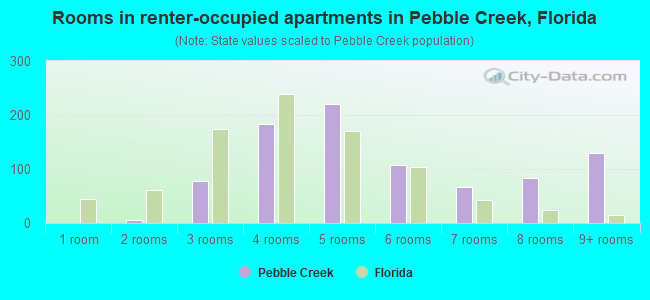
- Rooms in renter-occupied apartments in Pebble Creek, Florida
- 01 room
- 52 rooms
- 783 rooms
- 1844 rooms
- 2215 rooms
- 1086 rooms
- 677 rooms
- 838 rooms
- 1309+ rooms
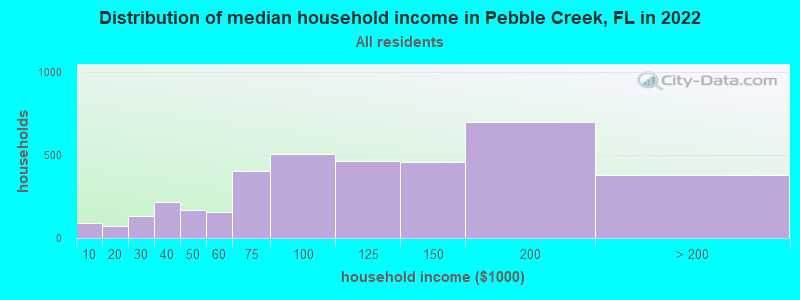
Pebble Creek, FL household income distribution

- 90Less than $10,000
- 75$10,000 to $19,999
- 130$20,000 to $29,999
- 216$30,000 to $39,999
- 168$40,000 to $49,999
- 156$50,000 to $59,999
- 402$60,000 to $74,999
- 505$75,000 to $99,999
- 464$100,000 to $124,999
- 455$125,000 to $149,999
- 698$150,000 to $199,999
- 378$200,000 or more
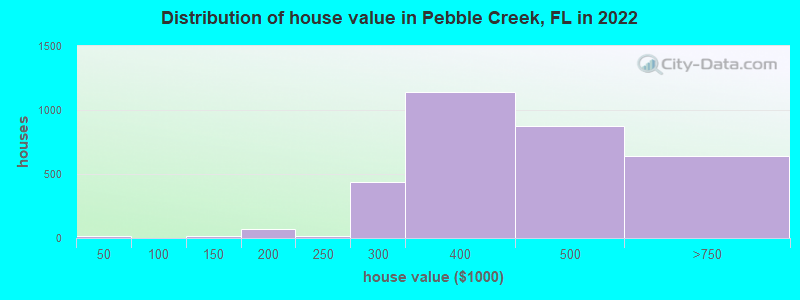
Home value of owner - occupied houses in 2022 in Pebble Creek, FL
-
- 15$15,000 to $19,999
- 7$100,000 to $124,999
- 8$125,000 to $149,999
- 34$150,000 to $174,999
- 36$175,000 to $199,999
- 13$200,000 to $249,999
- 434$250,000 to $299,999
- 1,142$300,000 to $399,999
- 877$400,000 to $499,999
- 625$500,000 to $749,999
- 14$750,000 to $999,999
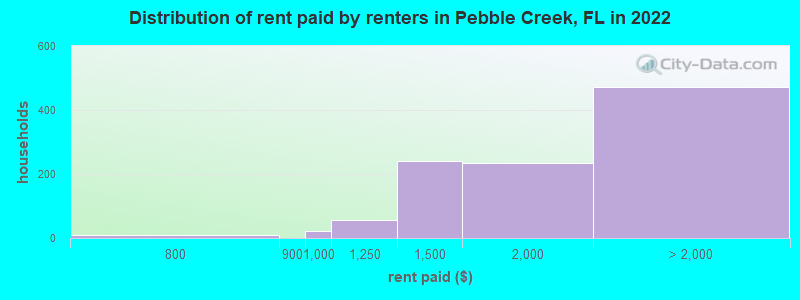
Rent paid by renters in 2022 in Pebble Creek, FL
-
- 8$750 to $799
- 20$900 to $999
- 56$1,000 to $1,249
- 240$1,250 to $1,499
- 235$1,500 to $1,999
- 177$2,000 to $2,499
- 272$2,500 to $2,999
- 22No cash rent
Percentage of workers working in this county: 87.9%
Number of people working at home: 2,185 (37.7% of all workers)
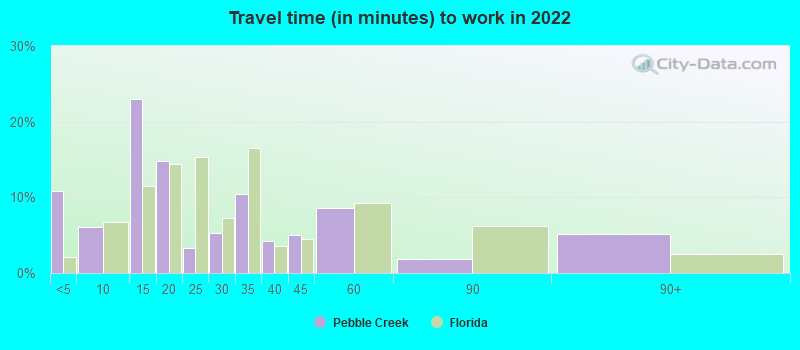
Travel time to work (commute)
- Less than 5 minutes: 21
- 5 to 9 minutes: 65
- 10 to 14 minutes: 306
- 15 to 19 minutes: 623
- 20 to 24 minutes: 753
- 25 to 29 minutes: 450
- 30 to 34 minutes: 671
- 35 to 39 minutes: 160
- 40 to 44 minutes: 133
- 45 to 59 minutes: 478
- 60 to 89 minutes: 189
- 90 or more minutes: 30
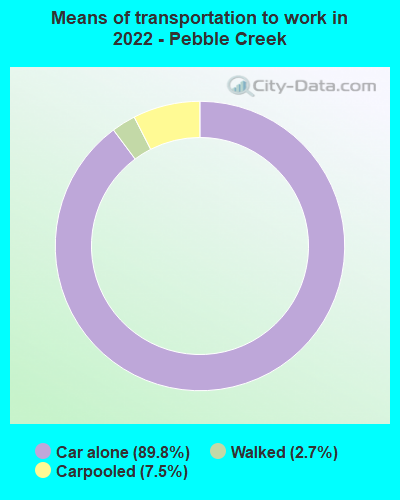
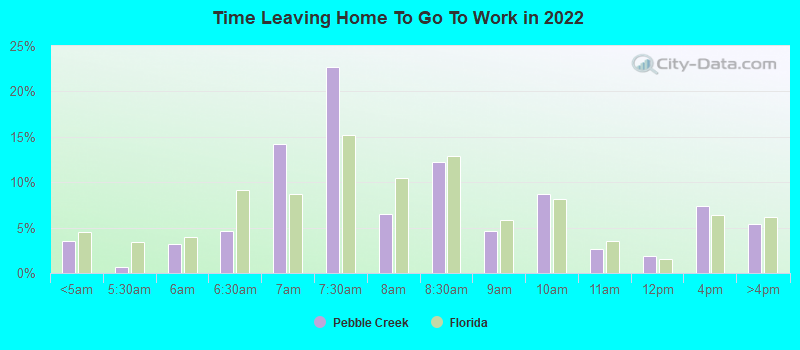
Means of transportation to work:
- Drove a car alone: 718 (29.2%)
- Carpooled: 68 (2.8%)
- Walked: 20 (0.8%)
- Worked at home: 2,185 (89.0%)
- Unemployment by race in 2022
- Unemployment rate for White non-Hispanic residents
- 3.2%Males
- Unemployment rate for Black residents
- 3.8%Males
- 12.6%Females
- Unemployment rate for Asian residents
- 6.3%Females
- Unemployment rate for Hispanic or Latino residents
- 2.7%Females
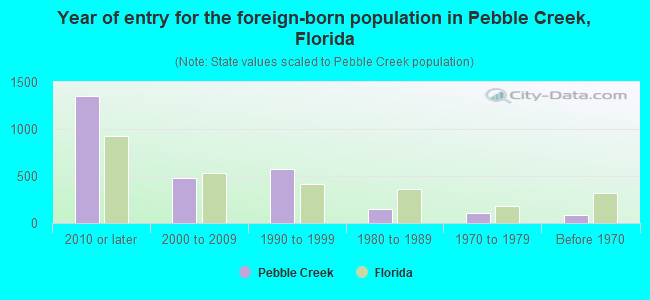
- Year of entry for the foreign-born population in Pebble Creek, Florida
- 1,3552010 or later
- 4752000 to 2009
- 5731990 to 1999
- 1491980 to 1989
- 1021970 to 1979
- 88Before 1970
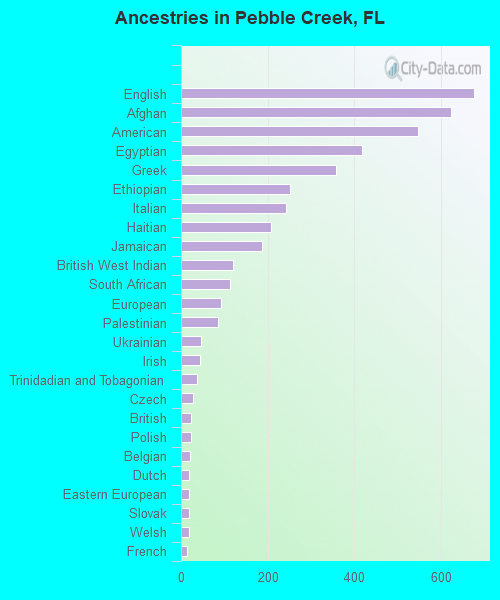
First ancestries reported:
- English: 677 (9.3%)
- Afghan: 622 (8.5%)
- American: 547 (7.5%)
- Egyptian: 417 (5.7%)
- Greek: 357 (4.9%)
- Ethiopian: 251 (3.4%)
- Italian: 242 (3.3%)
- Haitian: 207 (2.8%)
- Jamaican: 186 (2.5%)
- British West Indian: 121 (1.7%)
- South African: 113 (1.5%)
- European: 93 (1.3%)
- Palestinian: 85 (1.2%)
- Ukrainian: 46 (0.6%)
- Irish: 45 (0.6%)
- Trinidadian and Tobagonian: 37 (0.5%)
- Czech: 27 (0.4%)
- British: 23 (0.3%)
- Polish: 23 (0.3%)
- Belgian: 21 (0.3%)
- Dutch: 19 (0.3%)
- Eastern European: 19 (0.3%)
- Slovak: 18 (0.2%)
- Welsh: 18 (0.2%)
- French: 15 (0.2%)
- Portuguese: 14 (0.2%)
- Jordanian: 13 (0.2%)
- West Indian: 13 (0.2%)
- French Canadian: 10 (0.1%)
- Bahamian: 10 (0.1%)
- Celtic: 9 (0.1%)
- German: 9 (0.1%)
- Brazilian: 7 (0.10%)
- African: 6 (0.08%)
Most common places of birth for foreign-born residents (%):
| Pebble Creek: | 27.6% (857) |
| Florida: | 2.1% (94,349) |
| Pebble Creek: | 11.6% (362) |
| Florida: | 0.0% (1,485) |
| Pebble Creek: | 8.9% (276) |
| Florida: | 5.7% (262,042) |
| Pebble Creek: | 6.1% (191) |
| Florida: | 22.0% (1,006,576) |
| Pebble Creek: | 4.7% (145) |
| Florida: | 7.5% (342,375) |
| Pebble Creek: | 4.4% (138) |
| Florida: | 3.0% (137,727) |
| Pebble Creek: | 3.4% (107) |
| Florida: | 0.3% (13,998) |
| Pebble Creek: | 3.4% (106) |
| Florida: | 5.0% (227,319) |
| Pebble Creek: | 3.3% (103) |
| Florida: | 0.2% (11,243) |
| Pebble Creek: | 3.0% (94) |
| Florida: | 2.1% (97,632) |
| Pebble Creek: | 2.7% (83) |
| Florida: | 0.1% (3,129) |
| Pebble Creek: | 2.5% (79) |
| Florida: | 0.1% (2,578) |
| Pebble Creek: | 2.5% (77) |
| Florida: | 1.8% (84,403) |
| Pebble Creek: | 2.3% (73) |
| Florida: | 0.3% (13,053) |
| Pebble Creek: | 2.3% (71) |
| Florida: | 1.2% (56,071) |
| Pebble Creek: | 2.3% (70) |
| Florida: | 0.8% (37,723) |
| Pebble Creek: | 2.2% (69) |
| Florida: | 2.4% (109,132) |
| Pebble Creek: | 1.6% (49) |
| Florida: | 0.1% (4,197) |
Place of birth for U.S.-born residents:
- This state: 4,360
- Other state: 3,185
- Northeast: 1,586
- Midwest: 645
- South: 731
- West: 247
85.4% of Pebble Creek residents lived in the same house 1 years ago.
Out of people who lived in different houses, 30.5% lived in this county.
Out of people who lived in different counties, 76.6% lived in Florida.
| Pebble Creek: | 85.4% |
| State average: | 86.3% |
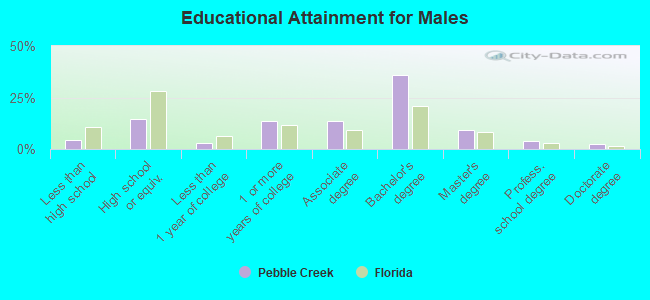
Education attainment for males 25 years and older:
- No schooling: 68
- Nursery to 4th grade: 0
- 5th and 6th grade: 9
- 7th and 8th grade: 0
- 9th grade: 3
- 10th grade: 0
- 11th grade: 0
- 12th grade, no diploma: 74
- High school graduate (or equivalency): 533
- Less than 1 year of college: 105
- Some college more than 1 year, no degree: 491
- Associate degree: 490
- Bachelor's degree: 1,307
- Master's degree: 329
- Professional school degree: 149
- Doctorate degree: 90
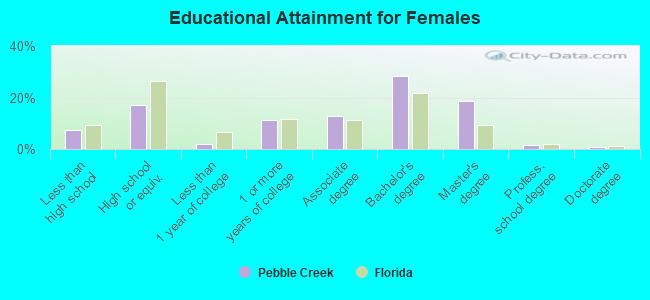
Education attainment for females 25 years and older:
- No schooling: 142
- Nursery to 4th grade: 6
- 5th and 6th grade: 0
- 7th and 8th grade: 6
- 9th grade: 0
- 10th grade: 10
- 11th grade: 10
- 12th grade, no diploma: 114
- High school graduate (or equivalency): 644
- Less than 1 year of college: 71
- Some college more than 1 year, no degree: 428
- Associate degree: 494
- Bachelor's degree: 1,078
- Master's degree: 707
- Professional school degree: 62
- Doctorate degree: 36


Housing units in structures:
- One, detached: 3,208
- One, attached: 243
- 3 or 4: 9
- 5 to 9: 18
- 10 to 19: 102
- 20 to 49: 99
- 50 or more: 58
- Mobile homes: 24
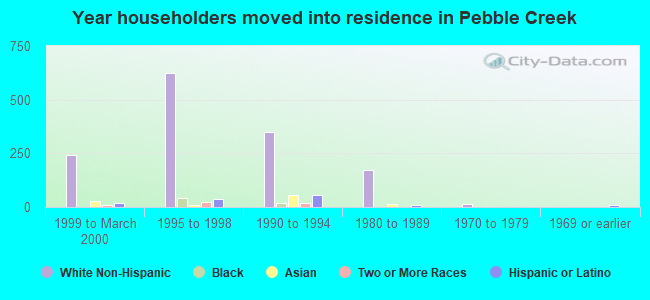
House/condo owner moved in on average 7 years ago
Renter moved in on average 3 years ago
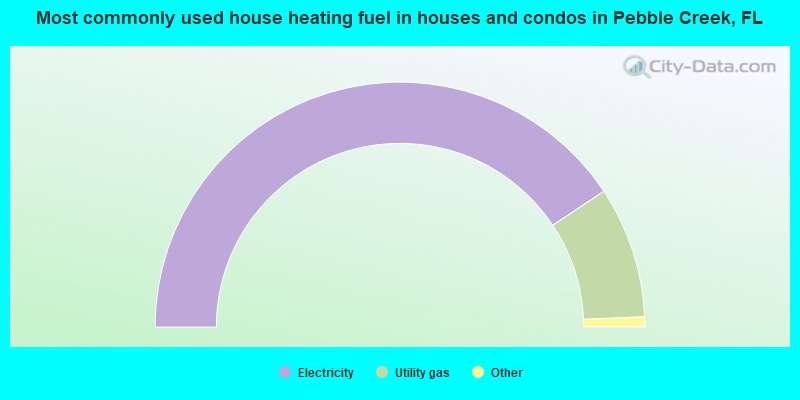
- 81.4%Electricity
- 17.4%Utility gas
- 0.8%Solar energy
- 0.5%Other fuel

- 73.0%Electricity
- 27.0%Utility gas
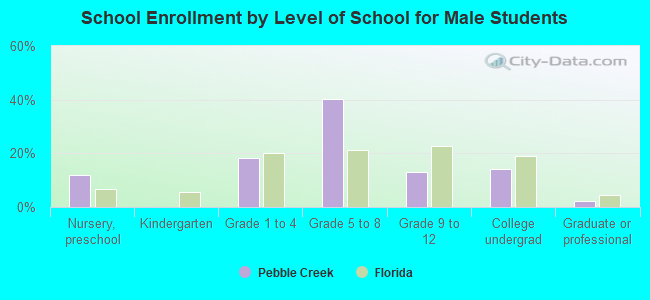
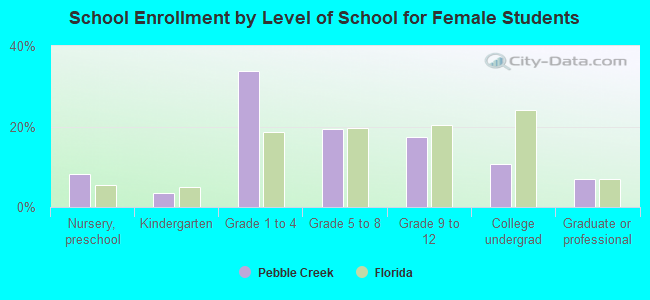
Private vs. public school enrollment:
| Here: | 2.0% |
| Florida: | 15.8% |
| Here: | 20.3% |
| Florida: | 12.9% |
| Here: | 24.5% |
| Florida: | 23.6% |