Payson, AZ (Arizona) Houses and Residents
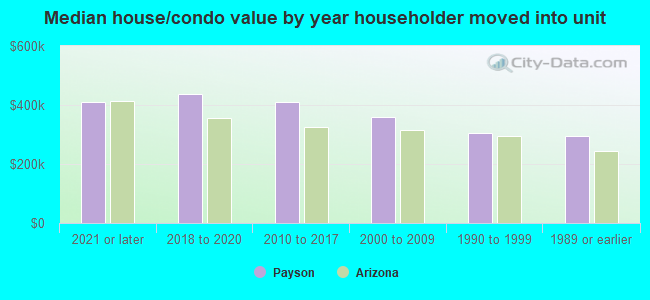
| Payson: | $383,124 |
| Arizona: | $402,800 |
Total population: 15,245 (Urban population: 11,080 (all inside urban clusters), Rural population: 2,941 (28 farm, 2,913 nonfarm))
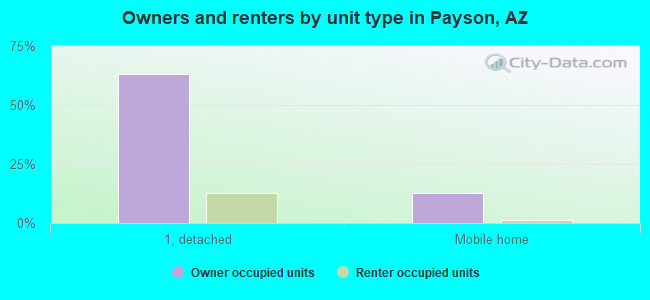
Houses: 10,006 (7,774 occupied: 6,030 owner occupied, 1,834 renter occupied)
| % of renters here: | 23% |
| State: | 33% |
Housing density: 514 houses/condos per square mile
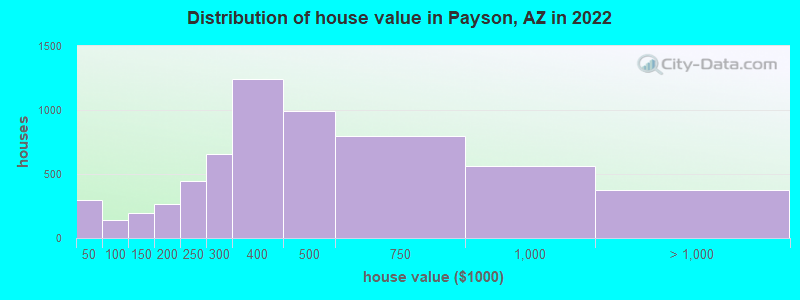
Median price asked for vacant for-sale houses and condos in 2022: $230,359.
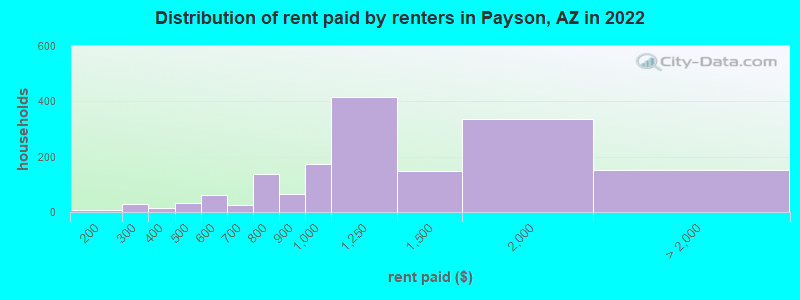
Median contract rent in 2022: $1,197 (lower quartile is $882, upper quartile is $1,463)
Median rent asked for vacant for-rent units in 2022: $1,273
Median gross rent in Payson, AZ in 2022: $1,418
Housing units in Payson with a mortgage: 3,257 (225 second mortgage, 18 home equity loan, 217 both second mortgage and home equity loan)
Houses without a mortgage: 81
Median household income for houses/condos with a mortgage: $75,486
Median household income for apartments without a mortgage: $56,853
Median monthly housing costs: $1,196
Compare current foreclosures near Payson, AZ:
| Photo | Address | Area | Beds / Baths | Price | Details |
|---|---|---|---|---|---|

|
#1
W Camino Real
Payson, AZ 85541
|
1,296 sq. feet
|
2 baths 2 beds |
$279,900
|
show details |

|
#2
N Matterhorn Rd
Payson, AZ 85541
|
986 sq. feet
|
2 baths 2 beds |
show details | |

|
#3
N William Tell Cir
Payson, AZ 85541
|
1,272 sq. feet
|
2 baths 2 beds |
show details | |

|
#4
N Carefree Cir
Payson, AZ 85541
|
- sq. feet
|
2 baths 2 beds |
show details | |

|
#5
S Mariposa Cir
Payson, AZ 85541
|
1,344 sq. feet
|
- baths - beds |
show details | |

|
#6
W Rim View Rd
Payson, AZ 85541
|
- sq. feet
|
- baths - beds |
show details | |

|
#7
W Frontier St Unit 557
Payson, AZ 85547
|
- sq. feet
|
- baths - beds |
show details | |

|
#8
S Moonlight Dr
Payson, AZ 85541
|
- sq. feet
|
- baths - beds |
show details | |

|
#9
E Highway 260, Space # 248
Payson, AZ 85541
|
- sq. feet
|
- baths - beds |
show details | |

|
#10
E Yerba Serita
Payson, AZ 85541
|
- sq. feet
|
- baths - beds |
show details |
| Photo | Address | Area | Beds / Baths | Price | Details |
|---|---|---|---|---|---|

|
#11
E Springdale Dr
Payson, AZ 85541
|
- sq. feet
|
- baths - beds |
show details | |

|
#12
302-43-090
Payson, AZ 85541
|
- sq. feet
|
- baths - beds |
show details | |

|
#13
E Phoenix St
Payson, AZ 85541
|
- sq. feet
|
- baths - beds |
show details | |

|
#14
Marissa Cir
Payson, AZ 85541
|
- sq. feet
|
- baths - beds |
show details | |

|
#15
W Dead Eye Rd
Payson, AZ 85541
|
- sq. feet
|
- baths - beds |
show details | |

|
#16
W Cherry Ann Ln
Payson, AZ 85541
|
- sq. feet
|
- baths - beds |
show details | |

|
#17
E Timber Dr
Payson, AZ 85541
|
- sq. feet
|
- baths - beds |
show details | |

|
#18
N Beeline Hwy
Payson, AZ 85541
|
- sq. feet
|
- baths - beds |
show details | |

|
#19
N Mclane Rd
Payson, AZ 85541
|
- sq. feet
|
- baths - beds |
show details | |

|
#20
N Maranantha Rd
Payson, AZ 85541
|
- sq. feet
|
- baths - beds |
show details |
| Photo | Address | Area | Beds / Baths | Price | Details |
|---|---|---|---|---|---|

|
#21
E Tahoe Vista Cir
Payson, AZ 85541
|
- sq. feet
|
- baths - beds |
show details | |

|
#22
N Pioneer Trl
Payson, AZ 85541
|
- sq. feet
|
- baths - beds |
show details | |

|
#23
E Pine Canyon Dr
Payson, AZ 85541
|
- sq. feet
|
- baths - beds |
show details | |

|
#24
E State Highway 260
Payson, AZ 85541
|
- sq. feet
|
- baths - beds |
show details | |

|
#25
S Pineview St
Payson, AZ 85541
|
- sq. feet
|
- baths - beds |
show details | |

|
#26
N Granite Dr
Payson, AZ 85541
|
- sq. feet
|
- baths - beds |
show details | |

|
#27
W Dead Eye Rd
Payson, AZ 85541
|
- sq. feet
|
- baths - beds |
show details | |

|
#28
W Cherry Ann Ln
Payson, AZ 85541
|
- sq. feet
|
- baths - beds |
show details | |

|
#29
Pinon Way
Pine, AZ 85544
|
- sq. feet
|
- baths - beds |
show details | |

|
#30
N Mikes Way
Pine, AZ 85544
|
- sq. feet
|
- baths - beds |
show details |
| Photo | Address | Area | Beds / Baths | Price | Details |
|---|---|---|---|---|---|

|
#31
N Papago Ln
Pine, AZ 85544
|
- sq. feet
|
- baths - beds |
show details | |

|
Check over 1 million property listings on Foreclosure.com!
|
browse all offers | |||

Latest news about housing in Payson, AZ collected exclusively by city-data.com from local newspapers, TV, and radio stations


Median year apartment built: 1986
Household type by relationship:
Households: 16,789- Male householders: 3,688 (1,084 living alone), Female householders: 4,066 (1,568 living alone)
3,890 spouses (3,880 opposite-sex spouses), 481 unmarried partners, (473 opposite-sex unmarried partners), 2,950 children (2,628 natural, 150 adopted, 171 stepchildren), 319 grandchildren, 189 brothers or sisters, 54 parents, 0 foster children, 491 other relatives, 260 non-relatives
- In group quarters: 396
Size of family households: 2,735 2-persons, 820 3-persons, 774 4-persons, 138 5-persons, 49 6-persons, 112 7-or-more-persons.
Size of nonfamily households: 2,700 1-person, 524 2-persons, 4 3-persons.
1,718 married couples with children.
462 single-parent households (3 men, 459 women).
90.7% of residents of Payson speak English at home.
7.0% of residents speak Spanish at home (74% speak English very well, 23% speak English well, 2% speak English not well).
1.4% of residents speak other Indo-European language at home (97% speak English very well, 3% speak English well).
1.1% of residents speak Asian or Pacific Island language at home (100% speak English very well).
0.7% of residents speak other language at home (69% speak English very well, 16% speak English well, 8% speak English not well, 8% don't speak English at all).
Foreign born population: 753 (4.5%)
(69.1% of them are naturalized citizens)
| Here: | 5.7 |
| State: | 6.0 |
| Here: | 4.6 |
| State: | 4.1 |
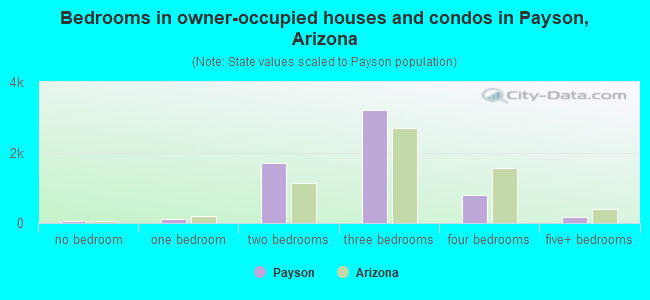
- Bedrooms in owner-occupied houses and condos in Payson, Arizona
- 48no bedroom
- 1141 bedroom
- 1,7072 bedrooms
- 3,2003 bedrooms
- 7854 bedrooms
- 1775+ bedrooms
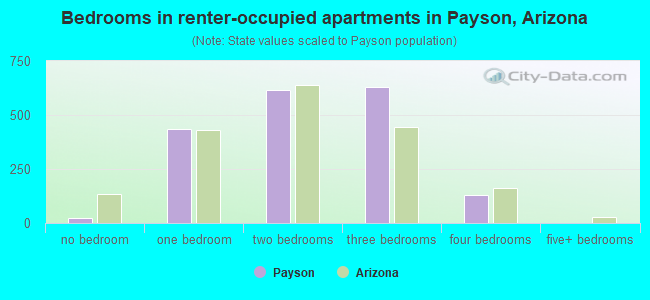
- Bedrooms in renter-occupied apartments in Payson, Arizona
- 25no bedroom
- 4331 bedroom
- 6182 bedrooms
- 6293 bedrooms
- 1304 bedrooms
- 05+ bedrooms
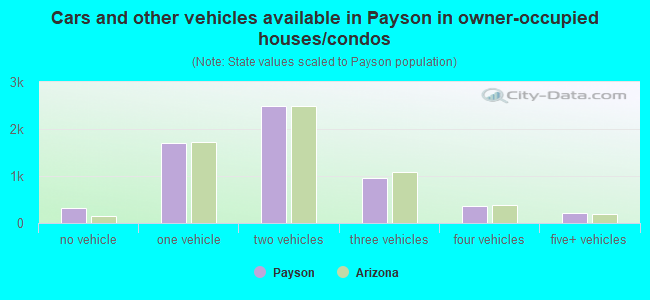
- Cars and other vehicles available in Payson in owner-occupied houses/condos
- 310no vehicle
- 1,7111 vehicle
- 2,4822 vehicles
- 9513 vehicles
- 3704 vehicles
- 2065+ vehicles
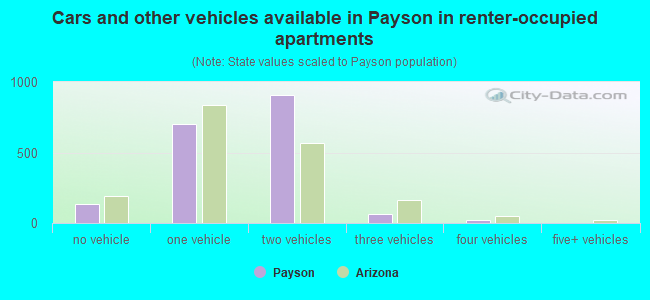
- Cars and other vehicles available in Payson in renter-occupied apartments
- 138no vehicle
- 7001 vehicle
- 9112 vehicles
- 663 vehicles
- 204 vehicles
- 05+ vehicles
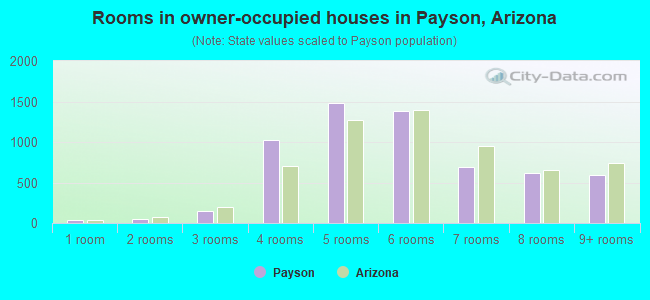
- Rooms in owner-occupied houses in Payson, Arizona
- 361 room
- 482 rooms
- 1493 rooms
- 1,0274 rooms
- 1,4815 rooms
- 1,3796 rooms
- 6947 rooms
- 6238 rooms
- 5939+ rooms
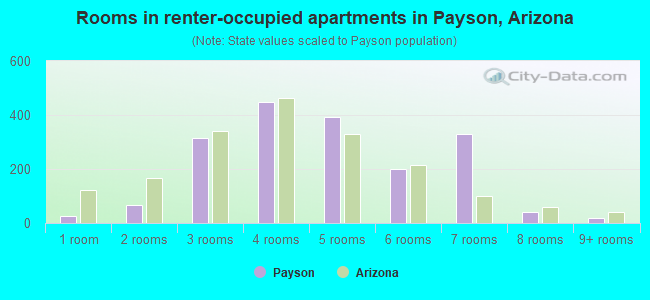
- Rooms in renter-occupied apartments in Payson, Arizona
- 251 room
- 652 rooms
- 3153 rooms
- 4494 rooms
- 3945 rooms
- 2016 rooms
- 3297 rooms
- 398 rooms
- 199+ rooms
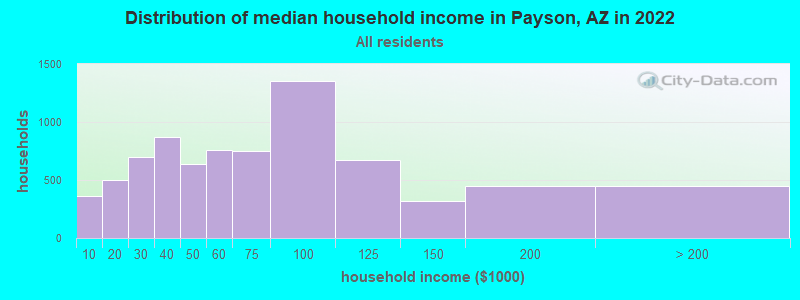
Payson, AZ household income distribution

- 364Less than $10,000
- 496$10,000 to $19,999
- 699$20,000 to $29,999
- 869$30,000 to $39,999
- 635$40,000 to $49,999
- 757$50,000 to $59,999
- 754$60,000 to $74,999
- 1,354$75,000 to $99,999
- 672$100,000 to $124,999
- 319$125,000 to $149,999
- 444$150,000 to $199,999
- 452$200,000 or more
Home value of owner - occupied houses in 2022 in Payson, AZ
-
- 74Less than $10,000
- 49$10,000 to $14,999
- 4$15,000 to $19,999
- 57$20,000 to $24,999
- 49$30,000 to $34,999
- 58$40,000 to $49,999
- 16$50,000 to $59,999
- 39$70,000 to $79,999
- 13$80,000 to $89,999
- 10$90,000 to $99,999
- 147$100,000 to $124,999
- 46$125,000 to $149,999
- 130$150,000 to $174,999
- 133$175,000 to $199,999
- 445$200,000 to $249,999
- 655$250,000 to $299,999
- 1,245$300,000 to $399,999
- 990$400,000 to $499,999
- 793$500,000 to $749,999
- 562$750,000 to $999,999
- 226$1,000,000 to $1,499,999
- 115$1,500,000 to $1,999,999
- 34$2,000,000 or more
Rent paid by renters in 2022 in Payson, AZ
-
- 9$150 to $199
- 28$250 to $299
- 15$350 to $399
- 33$450 to $499
- 47$500 to $549
- 12$550 to $599
- 24$600 to $649
- 62$700 to $749
- 77$750 to $799
- 63$800 to $899
- 172$900 to $999
- 416$1,000 to $1,249
- 148$1,250 to $1,499
- 334$1,500 to $1,999
- 41$3,500 or more
- 108No cash rent
Percentage of workers working in this county: 86.3%
Number of people working at home: 635 (10.7% of all workers)
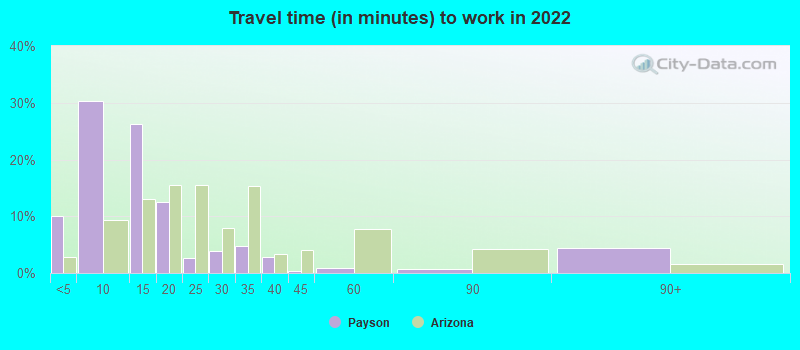
Travel time to work (commute)
- Less than 5 minutes: 609
- 5 to 9 minutes: 1,847
- 10 to 14 minutes: 1,455
- 15 to 19 minutes: 272
- 20 to 24 minutes: 37
- 25 to 29 minutes: 55
- 30 to 34 minutes: 59
- 35 to 39 minutes: 0
- 40 to 44 minutes: 48
- 45 to 59 minutes: 74
- 60 to 89 minutes: 240
- 90 or more minutes: 353
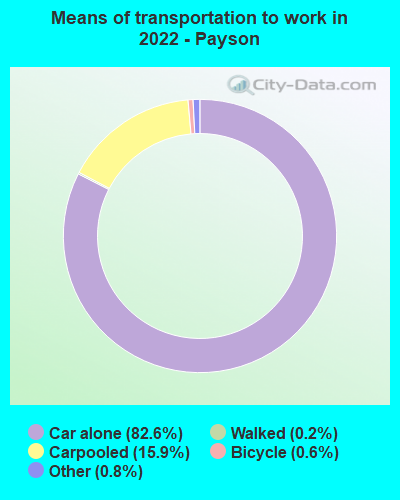
Means of transportation to work:
- Drove a car alone: 5,050 (72.2%)
- Carpooled: 1,018 (14.6%)
- Taxi: 54 (0.8%)
- Bicycle: 31 (0.4%)
- Walked: 11 (0.2%)
- Worked at home: 635 (9.1%)
- Unemployment by race in 2022
- Unemployment rate for White non-Hispanic residents
- 5.2%Males
- 5.4%Females
- Unemployment rate for Black residents
- 100.0%Males
- Unemployment rate for American Indian and Alaska Native residents
- 6.0%Males
- Unemployment rate for Asian residents
- 29.3%Males
- Unemployment rate for other race residents
- 51.2%Males
- Unemployment rate for Hispanic or Latino residents
- 14.5%Males
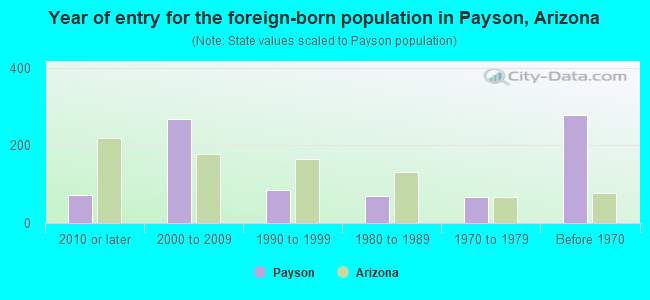
- Year of entry for the foreign-born population in Payson, Arizona
- 712010 or later
- 2672000 to 2009
- 841990 to 1999
- 691980 to 1989
- 681970 to 1979
- 278Before 1970
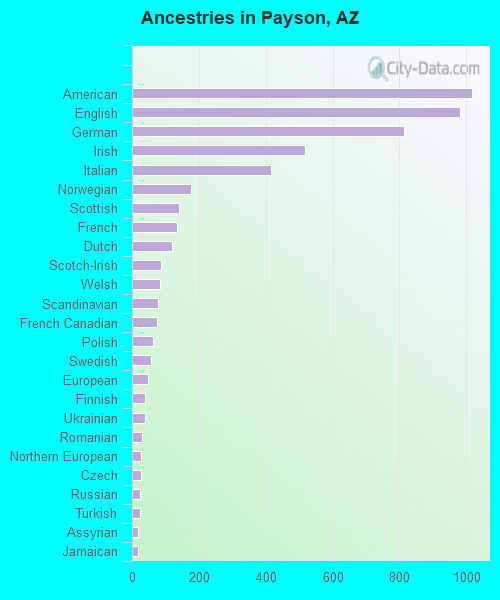
First ancestries reported:
- American: 1,017 (13.6%)
- English: 980 (13.1%)
- German: 814 (10.9%)
- Irish: 517 (6.9%)
- Italian: 417 (5.6%)
- Norwegian: 175 (2.3%)
- Scottish: 140 (1.9%)
- French: 136 (1.8%)
- Dutch: 119 (1.6%)
- Scotch-Irish: 87 (1.2%)
- Welsh: 85 (1.1%)
- Scandinavian: 77 (1.0%)
- French Canadian: 75 (1.0%)
- Polish: 62 (0.8%)
- Swedish: 57 (0.8%)
- European: 47 (0.6%)
- Finnish: 38 (0.5%)
- Ukrainian: 38 (0.5%)
- Romanian: 29 (0.4%)
- Northern European: 28 (0.4%)
- Czech: 27 (0.4%)
- Russian: 25 (0.3%)
- Turkish: 25 (0.3%)
- Assyrian: 19 (0.3%)
- Jamaican: 17 (0.2%)
- Austrian: 13 (0.2%)
- Hungarian: 12 (0.2%)
- Lithuanian: 11 (0.1%)
- Slovak: 10 (0.1%)
- Swiss: 10 (0.1%)
- Pennsylvania German: 8 (0.1%)
- Canadian: 7 (0.09%)
- British: 7 (0.09%)
- South African: 7 (0.09%)
- Yugoslavian: 6 (0.08%)
Most common places of birth for foreign-born residents (%):
| Payson: | 26.7% (201) |
| Arizona: | 53.4% (500,086) |
| Payson: | 9.6% (72) |
| Arizona: | 1.6% (14,556) |
| Payson: | 7.4% (56) |
| Arizona: | 0.1% (1,319) |
| Payson: | 7.3% (55) |
| Arizona: | 0.2% (1,716) |
| Payson: | 6.5% (49) |
| Arizona: | 4.3% (40,102) |
| Payson: | 5.3% (40) |
| Arizona: | 0.5% (4,338) |
| Payson: | 4.2% (32) |
| Arizona: | 1.5% (14,058) |
| Payson: | 3.5% (26) |
| Arizona: | 0.4% (3,511) |
| Payson: | 3.3% (25) |
| Arizona: | 0.3% (2,667) |
| Payson: | 3.2% (24) |
| Arizona: | 0.3% (2,710) |
| Payson: | 3.1% (23) |
| Arizona: | 3.2% (30,378) |
| Payson: | 2.7% (20) |
| Arizona: | 0.1% (1,308) |
| Payson: | 2.7% (20) |
| Arizona: | 0.7% (6,565) |
| Payson: | 2.7% (20) |
| Arizona: | 0.6% (6,077) |
| Payson: | 2.5% (19) |
| Arizona: | 0.6% (5,893) |
| Payson: | 2.4% (18) |
| Arizona: | 0.2% (2,223) |
| Payson: | 2.3% (17) |
| Arizona: | 0.4% (3,763) |
| Payson: | 1.6% (12) |
| Arizona: | 0.1% (993) |
Place of birth for U.S.-born residents:
- This state: 5,743
- Other state: 10,232
- Northeast: 1,139
- Midwest: 3,217
- South: 1,429
- West: 4,475
82.2% of Payson residents lived in the same house 1 years ago.
Out of people who lived in different houses, 22.1% lived in this county.
Out of people who lived in different counties, 63.7% lived in Arizona.
| Payson: | 82.2% |
| State average: | 86.0% |
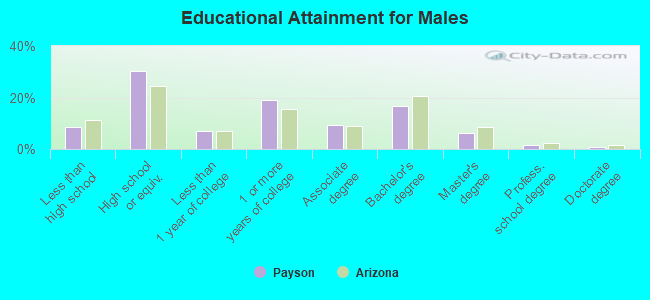
Education attainment for males 25 years and older:
- No schooling: 40
- Nursery to 4th grade: 0
- 5th and 6th grade: 45
- 7th and 8th grade: 0
- 9th grade: 0
- 10th grade: 50
- 11th grade: 168
- 12th grade, no diploma: 234
- High school graduate (or equivalency): 1,901
- Less than 1 year of college: 425
- Some college more than 1 year, no degree: 1,194
- Associate degree: 593
- Bachelor's degree: 1,054
- Master's degree: 391
- Professional school degree: 96
- Doctorate degree: 58
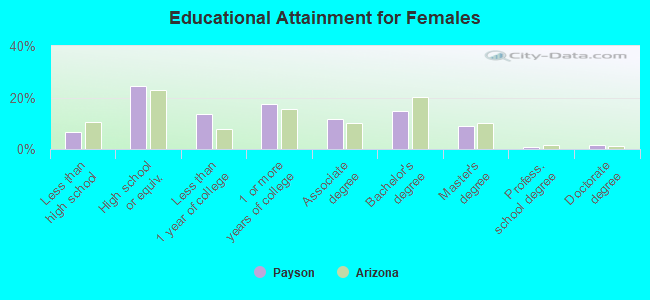
Education attainment for females 25 years and older:
- No schooling: 29
- Nursery to 4th grade: 0
- 5th and 6th grade: 47
- 7th and 8th grade: 68
- 9th grade: 0
- 10th grade: 9
- 11th grade: 271
- 12th grade, no diploma: 41
- High school graduate (or equivalency): 1,747
- Less than 1 year of college: 957
- Some college more than 1 year, no degree: 1,247
- Associate degree: 834
- Bachelor's degree: 1,040
- Master's degree: 632
- Professional school degree: 44
- Doctorate degree: 122
Housing units in structures:
- One, detached: 7,681
- One, attached: 136
- Two: 50
- 3 or 4: 255
- 5 to 9: 183
- 10 to 19: 89
- 20 to 49: 69
- 50 or more: 74
- Mobile homes: 1,444
- Boats, RVs, vans, etc.: 22
Median worth of mobile homes: $213,486
Housing units lacking complete kitchen facilities in 2022: 1.1%
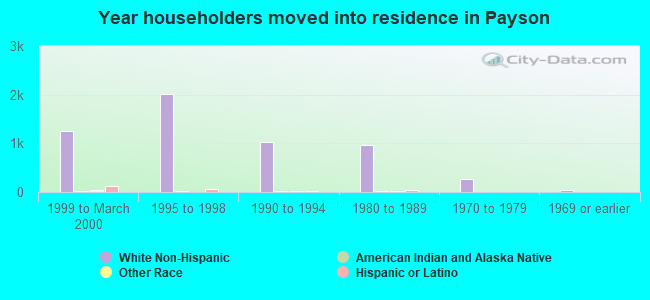
House/condo owner moved in on average 7 years ago
Renter moved in on average 3 years ago
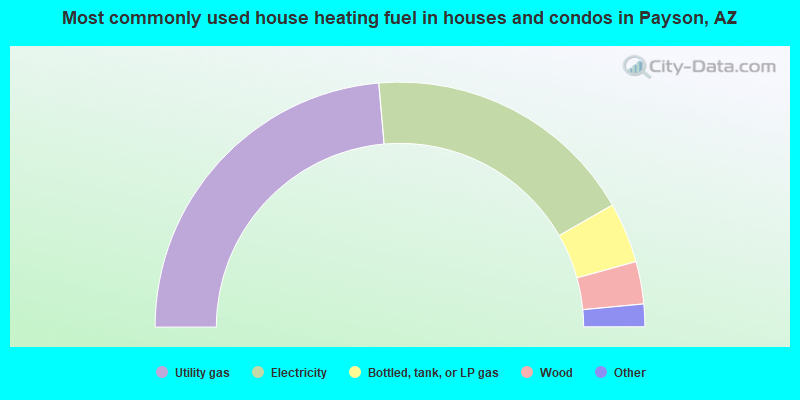
- 47.3%Utility gas
- 36.2%Electricity
- 8.0%Bottled, tank, or LP gas
- 5.6%Wood
- 1.7%Other fuel
- 0.8%Solar energy
- 0.5%No fuel used
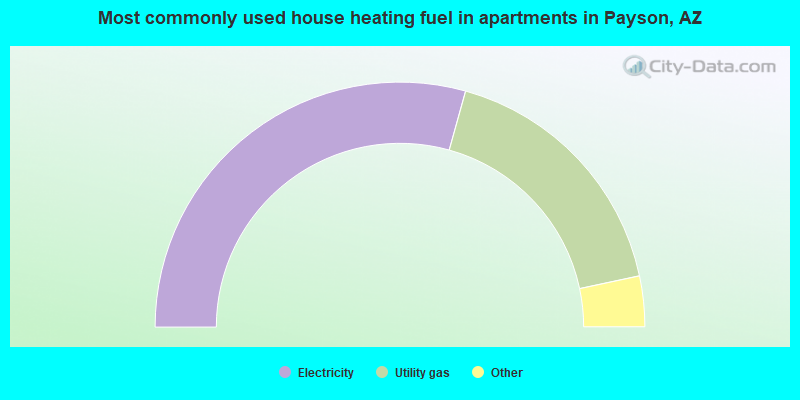
- 58.7%Electricity
- 34.7%Utility gas
- 3.9%Wood
- 1.6%No fuel used
- 1.1%Other fuel
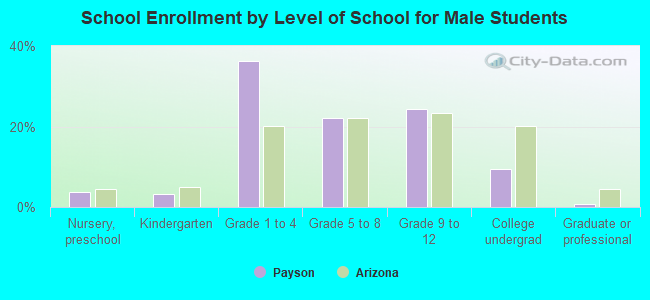
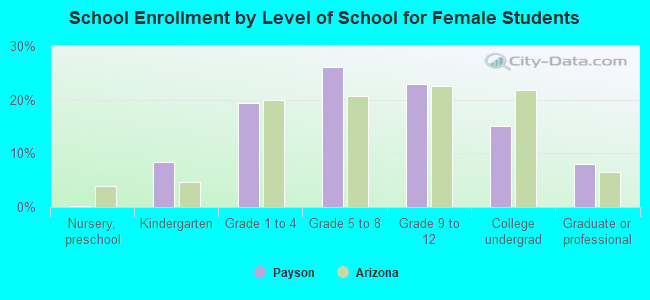
Private vs. public school enrollment:
| Here: | 8.9% |
| Arizona: | 10.4% |
| Here: | 0.0% |
| Arizona: | 8.8% |
| Here: | 20.3% |
| Arizona: | 13.1% |