Paso Robles, CA (California) Houses and Residents
| Paso Robles: | $616,929 |
| California: | $715,900 |
Total population: 42,751 (Urban population: 23,245, Rural population: 17,248 (1,195 farm, 16,053 nonfarm))
Houses: 16,117 (14,370 occupied: 9,491 owner occupied, 4,879 renter occupied)
| % of renters here: | 34% |
| State: | 44% |
Housing density: 16 houses/condos per square mile
Median price asked for vacant for-sale houses and condos in 2022 in this county: $470,979.
Median contract rent in 2022: $1,492 (lower quartile is $1,104, upper quartile is $1,909)
Median rent asked for vacant for-rent units in 2022: $1,984
Median gross rent in Paso Robles, CA in 2022: $1,649
Housing units in Paso Robles with a mortgage: 5,492 (604 second mortgage, 522 home equity loan, 7 both second mortgage and home equity loan)
Houses without a mortgage: 1,280


Household type by relationship:
Households: 252,631- In family households: 196,078 (45,935 male householders, 17,756 female householders)
49,731 spouses, 61,911 children (57,462 natural, 1,697 adopted, 2,752 stepchildren), 4,265 grandchildren, 2,343 brothers or sisters, 2,044 parents, foster children, 3,210 other relatives, 7,014 non-relatives
- In nonfamily households: 56,553 (17,992 male householders (11,443 living alone)), 20,333 female householders (15,330 living alone)), 18,228 nonrelatives
- In group quarters: 17,006 (8,770 institutionalized population)
36,890 married couples with children.
11,285 single-parent households (2,977 men, 8,308 women).
80.1% of residents of Paso Robles speak English at home.
16.9% of residents speak Spanish at home (45% speak English very well, 19% speak English well, 22% speak English not well, 14% don't speak English at all).
1.6% of residents speak other Indo-European language at home (81% speak English very well, 12% speak English well, 6% speak English not well, 1% don't speak English at all).
1.3% of residents speak Asian or Pacific Island language at home (65% speak English very well, 25% speak English well, 10% speak English not well).
0.1% of residents speak other language at home (73% speak English very well, 16% speak English well, 11% speak English not well).
Foreign born population: 6,234 (13.5%)
(41.5% of them are naturalized citizens)
| Here: | 5.8 |
| State: | 6.0 |
| Here: | 4.0 |
| State: | 3.9 |

- Bedrooms in owner-occupied houses and condos in Paso Robles, California
- 66no bedroom
- 3771 bedroom
- 2,1322 bedrooms
- 5,5523 bedrooms
- 1,1854 bedrooms
- 1795+ bedrooms

- Bedrooms in renter-occupied apartments in Paso Robles, California
- 344no bedroom
- 1,0101 bedroom
- 2,2502 bedrooms
- 1,1313 bedrooms
- 1134 bedrooms
- 315+ bedrooms

- Cars and other vehicles available in Paso Robles in owner-occupied houses/condos
- 216no vehicle
- 2,2721 vehicle
- 4,2942 vehicles
- 1,8843 vehicles
- 6194 vehicles
- 2065+ vehicles

- Cars and other vehicles available in Paso Robles in renter-occupied apartments
- 595no vehicle
- 2,0221 vehicle
- 1,6722 vehicles
- 4273 vehicles
- 1144 vehicles
- 495+ vehicles

- Rooms in owner-occupied houses in Paso Robles, California
- 101 room
- 1232 rooms
- 4843 rooms
- 9054 rooms
- 2,6355 rooms
- 2,9556 rooms
- 1,3087 rooms
- 6338 rooms
- 4389+ rooms

- Rooms in renter-occupied apartments in Paso Robles, California
- 2401 room
- 6722 rooms
- 6553 rooms
- 1,5124 rooms
- 1,0925 rooms
- 4946 rooms
- 1107 rooms
- 538 rooms
- 519+ rooms


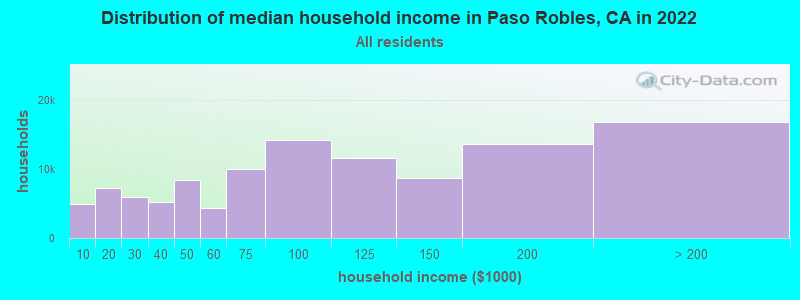
Paso Robles, CA household income distribution

- 4,943Less than $10,000
- 7,212$10,000 to $19,999
- 5,938$20,000 to $29,999
- 5,175$30,000 to $39,999
- 8,476$40,000 to $49,999
- 4,315$50,000 to $59,999
- 10,044$60,000 to $74,999
- 14,290$75,000 to $99,999
- 11,639$100,000 to $124,999
- 8,715$125,000 to $149,999
- 13,662$150,000 to $199,999
- 16,871$200,000 or more
Percentage of workers working in this county: 93.2%
Number of people working at home: 3,436 (16.2% of all workers)
Travel time to work (commute)
- Less than 5 minutes: 733
- 5 to 9 minutes: 2,638
- 10 to 14 minutes: 3,086
- 15 to 19 minutes: 2,408
- 20 to 24 minutes: 1,576
- 25 to 29 minutes: 623
- 30 to 34 minutes: 1,783
- 35 to 39 minutes: 574
- 40 to 44 minutes: 520
- 45 to 59 minutes: 1,349
- 60 to 89 minutes: 710
- 90 or more minutes: 477
Means of transportation to work:
- Drove a car alone: 12,650 (73.2%)
- Carpooled: 3,011 (17.4%)
- Bus or trolley bus: 116 (0.7%)
- Motorcycle: 21 (0.1%)
- Bicycle: 114 (0.7%)
- Walked: 377 (2.2%)
- Other means: 188 (1.1%)
- Worked at home: 800 (4.6%)

- Year of entry for the foreign-born population in Paso Robles, California
- 8361995 to March 2000
- 1,1591990 to 1994
- 1,0381985 to 1989
- 5661980 to 1984
- 4451975 to 1979
- 1941970 to 1974
- 1711965 to 1969
- 511Before 1965
Most common places of birth for foreign-born residents (%):
| Paso Robles: | 68.5% (3,371) |
| California: | 44.3% (3,928,701) |
| Paso Robles: | 3.7% (182) |
| California: | 1.6% (141,181) |
| Paso Robles: | 3.2% (155) |
| California: | 1.5% (133,090) |
| Paso Robles: | 2.6% (128) |
| California: | 3.0% (268,452) |
| Paso Robles: | 2.3% (111) |
| California: | 0.7% (64,411) |
| Paso Robles: | 2.2% (106) |
| California: | 7.5% (664,935) |
| Paso Robles: | 2.0% (99) |
| California: | 1.1% (98,160) |
| Paso Robles: | 1.6% (81) |
| California: | 4.1% (359,673) |
Place of birth for U.S.-born residents:
- This state: 25,469
- Other state: 9,761
- Northeast: 1,846
- Midwest: 3,466
- South: 2,324
- West: 2,125
48% of Paso Robles residents lived in the same house 5 years ago.
Out of people who lived in different houses, 61% lived in this county.
Out of people who lived in different counties, 77% lived in California.
Education attainment for males 25 years and older:
- No schooling: 257
- Nursery to 4th grade: 176
- 5th and 6th grade: 355
- 7th and 8th grade: 311
- 9th grade: 121
- 10th grade: 282
- 11th grade: 249
- 12th grade, no diploma: 509
- High school graduate (or equivalency): 2,825
- Less than 1 year of college: 940
- Some college more than 1 year, no degree: 2,329
- Associate degree: 1,163
- Bachelor's degree: 1,590
- Master's degree: 543
- Professional school degree: 249
- Doctorate degree: 61

Education attainment for females 25 years and older:
- No schooling: 232
- Nursery to 4th grade: 159
- 5th and 6th grade: 305
- 7th and 8th grade: 195
- 9th grade: 191
- 10th grade: 268
- 11th grade: 308
- 12th grade, no diploma: 551
- High school graduate (or equivalency): 3,442
- Less than 1 year of college: 1,446
- Some college more than 1 year, no degree: 2,487
- Associate degree: 1,272
- Bachelor's degree: 1,576
- Master's degree: 379
- Professional school degree: 125
- Doctorate degree: 22


Housing units in structures:
- One, detached: 11,211
- One, attached: 916
- Two: 339
- 3 or 4: 782
- 5 to 9: 503
- 10 to 19: 199
- 20 to 49: 257
- 50 or more: 277
- Mobile homes: 1,610
- Boats, RVs, vans, etc.: 23
Median worth of mobile homes: $504,111
Housing units lacking complete kitchen facilities: 1.3%

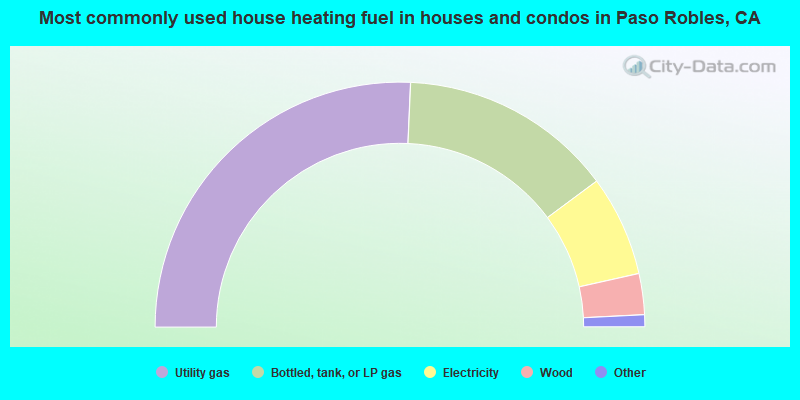
- 51.4%Utility gas
- 28.3%Bottled, tank, or LP gas
- 13.3%Electricity
- 5.4%Wood
- 0.6%Solar energy
- 0.4%Fuel oil, kerosene, etc.
- 0.3%No fuel used
- 0.3%Other fuel
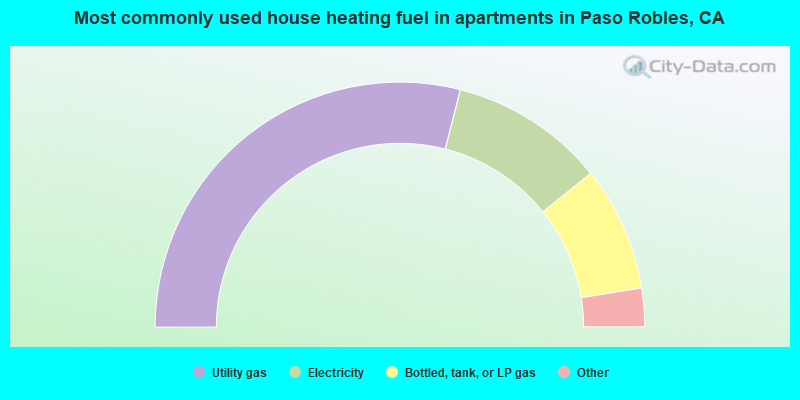
- 58.0%Utility gas
- 20.5%Electricity
- 16.5%Bottled, tank, or LP gas
- 3.6%Wood
- 0.7%No fuel used
- 0.3%Fuel oil, kerosene, etc.
- 0.2%Other fuel
- 0.2%Solar energy
Private vs. public school enrollment:
| Here: | 7.5% |
| California: | 9.9% |
| Here: | 5.6% |
| California: | 7.8% |
| Here: | 6.4% |
| California: | 15.4% |


