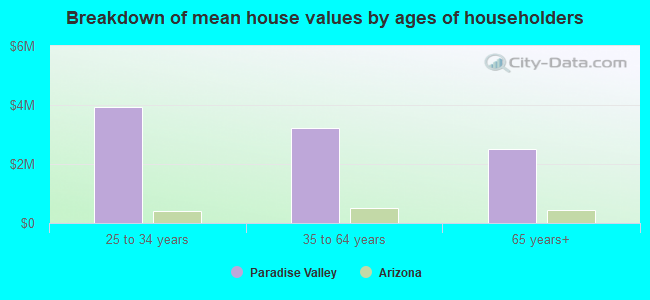
Paradise Valley, AZ (Arizona) Houses and Residents
| Paradise Valley: | $2,513,195 |
| Arizona: | $402,800 |
Total population: 13,663 (Urban population: 13,629, Rural population: 0)
Houses: 5,988 (5,201 occupied: 4,976 owner occupied, 253 renter occupied)
| % of renters here: | 5% |
| State: | 33% |
Housing density: 386 houses/condos per square mile
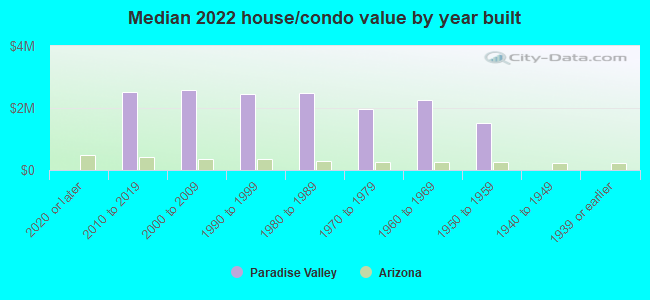
Median price asked for vacant for-sale houses and condos in 2022: $2,462,787.
Median contract rent in 2022: over $2,000
Median rent asked for vacant for-rent units in 2022: $2,540
Median gross rent in Paradise Valley, AZ in 2022: over $2,000
Housing units in Paradise Valley with a mortgage: 2,853 (299 second mortgage, 6 home equity loan, 247 both second mortgage and home equity loan)
Houses without a mortgage: 6
Median household income for houses/condos with a mortgage: $229,358
Median household income for apartments without a mortgage: $231,834
Median monthly housing costs: $3,173
Compare current foreclosures near Paradise Valley, AZ:
| Photo | Address | Area | Beds / Baths | Price | Details |
|---|---|---|---|---|---|

|
#1
E Ironwood Dr
Paradise Valley, AZ 85253
|
5,905 sq. feet
|
6 baths 6 beds |
show details | |

|
#2
N 70th St Unit 107
Paradise Valley, AZ 85253
|
- sq. feet
|
- baths - beds |
show details | |

|
#3
N Palo Cristi Rd
Paradise Valley, AZ 85253
|
12,301 sq. feet
|
- baths - beds |
show details | |

|
#4
E Fanfol Dr
Paradise Valley, AZ 85253
|
3,087 sq. feet
|
- baths - beds |
show details | |

|
#5
E Foothill Dr
Paradise Valley, AZ 85253
|
4,043 sq. feet
|
- baths - beds |
show details | |

|
#6
E Gold Dust Ave Apt 2100
Paradise Valley, AZ 85253
|
- sq. feet
|
- baths - beds |
show details | |

|
#7
E Lincoln Dr
Paradise Valley, AZ 85253
|
- sq. feet
|
- baths - beds |
show details | |

|
#8
E Beryl Ave
Paradise Valley, AZ 85253
|
8,078 sq. feet
|
- baths - beds |
show details | |

|
#9
N Scottsdale Rd
Paradise Valley, AZ 85253
|
1,509 sq. feet
|
- baths - beds |
show details | |

|
#10
E Lincoln 117
Paradise Valley, AZ 85253
|
- sq. feet
|
- baths - beds |
show details |
| Photo | Address | Area | Beds / Baths | Price | Details |
|---|---|---|---|---|---|

|
#11
N 70th St Unit 142
Paradise Valley, AZ 85253
|
1,088 sq. feet
|
- baths - beds |
show details | |

|
#12
N 63rd Pl
Paradise Valley, AZ 85253
|
4,410 sq. feet
|
- baths - beds |
show details | |

|
#13
E Lincoln D 6
Paradise Valley, AZ 85253
|
- sq. feet
|
- baths - beds |
show details | |

|
#14
S Roosevelt St
Tempe, AZ 85281
|
1,916 sq. feet
|
3 baths 3 beds |
show details | |

|
#15
E University Dr Unit 2017
Mesa, AZ 85205
|
932 sq. feet
|
2 baths 2 beds |
show details | |

|
#16
E Playa Del Norte Dr Unit 4020
Tempe, AZ 85281
|
1,208 sq. feet
|
2 baths 2 beds |
show details | |

|
#17
N 19th Ave Unit 1055
Phoenix, AZ 85023
|
927 sq. feet
|
2 baths 2 beds |
show details | |

|
#18
S 48th St Unit 1072
Phoenix, AZ 85044
|
965 sq. feet
|
2 baths 2 beds |
show details | |

|
#19
S Westwood Unit 150
Mesa, AZ 85210
|
792 sq. feet
|
1 baths 2 beds |
show details | |

|
#20
N Hayden Rd Apt 3616
Scottsdale, AZ 85251
|
962 sq. feet
|
1 baths 1 beds |
show details |
| Photo | Address | Area | Beds / Baths | Price | Details |
|---|---|---|---|---|---|

|
#21
E Paradise Village Pkwy N Apt 135
Phoenix, AZ 85032
|
713 sq. feet
|
1 baths 1 beds |
show details | |

|
#22
E Tracy Ln # 7
Phoenix, AZ 85032
|
960 sq. feet
|
1 baths 2 beds |
show details | |

|
#23
E Chandler Blvd Unit 2017
Phoenix, AZ 85048
|
1,575 sq. feet
|
2 baths 3 beds |
show details | |

|
#24
E Devonshire Ave Unit 4014
Phoenix, AZ 85014
|
1,248 sq. feet
|
2 baths 2 beds |
show details | |

|
#25
N 43rd Ave
Glendale, AZ 85301
|
1,408 sq. feet
|
2 baths 3 beds |
show details | |

|
#26
E Keim Dr
Scottsdale, AZ 85250
|
3,597 sq. feet
|
6 baths 4 beds |
show details | |

|
#27
E 6th St
Tempe, AZ 85281
|
987 sq. feet
|
2 baths 2 beds |
show details | |

|
#28
W Dunbar Dr
Tempe, AZ 85282
|
1,940 sq. feet
|
2 baths 4 beds |
show details | |

|
#29
N 36th Ave
Phoenix, AZ 85053
|
2,445 sq. feet
|
3 baths 4 beds |
show details | |

|
#30
S 21st Pl
Phoenix, AZ 85040
|
- sq. feet
|
3 baths 3 beds |
show details |
| Photo | Address | Area | Beds / Baths | Price | Details |
|---|---|---|---|---|---|

|
#31
W Ocotillo Rd
Glendale, AZ 85301
|
- sq. feet
|
1 baths 3 beds |
show details | |

|
#32
W Union Hills Dr Apt 128
Phoenix, AZ 85027
|
1,427 sq. feet
|
3 baths 2 beds |
show details | |

|
#33
N 44th Dr Unit 1185
Glendale, AZ 85301
|
1,089 sq. feet
|
2 baths 2 beds |
show details | |

|
#34
N 38th Ave
Phoenix, AZ 85029
|
1,584 sq. feet
|
2 baths 4 beds |
show details | |

|
#35
W Augusta Ave
Phoenix, AZ 85051
|
- sq. feet
|
2 baths 3 beds |
show details | |

|
#36
W Morten Ave
Glendale, AZ 85301
|
1,326 sq. feet
|
2 baths 3 beds |
show details | |

|
#37
E Avalon Dr
Phoenix, AZ 85018
|
1,598 sq. feet
|
3 baths 3 beds |
show details | |

|
#38
N 18th Ave
Phoenix, AZ 85023
|
1,576 sq. feet
|
2 baths 3 beds |
show details | |

|
#39
N 40th Dr
Phoenix, AZ 85051
|
1,916 sq. feet
|
2 baths 4 beds |
show details | |

|
#40
S Dobson Rd Unit 85
Mesa, AZ 85202
|
784 sq. feet
|
1 baths 2 beds |
show details |
| Photo | Address | Area | Beds / Baths | Price | Details |
|---|---|---|---|---|---|

|
#41
W Claremont St
Phoenix, AZ 85019
|
1,290 sq. feet
|
2 baths 3 beds |
show details | |

|
#42
E Nancy Ln
Phoenix, AZ 85042
|
975 sq. feet
|
1 baths 3 beds |
show details | |

|
#43
N Stapley Dr Unit 81
Mesa, AZ 85203
|
1,650 sq. feet
|
3 baths 3 beds |
show details | |

|
#44
W San Juan Ave
Phoenix, AZ 85019
|
1,147 sq. feet
|
2 baths 3 beds |
show details | |

|
#45
W Michelle Dr
Phoenix, AZ 85023
|
1,036 sq. feet
|
2 baths 3 beds |
show details | |

|
#46
W Elm St
Phoenix, AZ 85019
|
1,302 sq. feet
|
2 baths 3 beds |
show details | |

|
#47
W Gardenia Ave
Glendale, AZ 85301
|
1,606 sq. feet
|
2 baths 3 beds |
show details | |

|
#48
E Melody Dr
Phoenix, AZ 85042
|
4,484 sq. feet
|
4 baths 4 beds |
show details | |

|
#49
N 30th Dr
Phoenix, AZ 85009
|
1,262 sq. feet
|
2 baths 4 beds |
show details | |

|
Check over 1 million property listings on Foreclosure.com!
|
browse all offers | |||


 | 2023 Phoenix Area Home Prices (337 replies) |
| In 2022, Zillow Predicts That Phoenix housing market will climb ANOTHER 20%?! (709 replies) |
| Gated Community in Moon Valley with City Views or Paradise Valley? (2 replies) |
| Home prices falling? (94 replies) |
| Mid Century modern homes in Phoenix area? (17 replies) |
| Please help me find apartments to look at - moving to PHX :) (4 replies) |

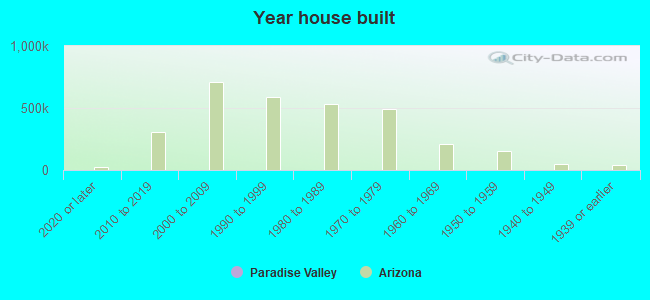
Median year apartment built: 1981
Household type by relationship:
Households: 13,017- Male householders: 2,896 (396 living alone), Female householders: 2,286 (406 living alone)
3,609 spouses (3,592 opposite-sex spouses), 240 unmarried partners, (230 opposite-sex unmarried partners), 3,223 children (3,070 natural, 33 adopted, 119 stepchildren), 170 grandchildren, 107 brothers or sisters, 68 parents, 0 foster children, 165 other relatives, 190 non-relatives
- In group quarters: 57
Size of family households: 2,356 2-persons, 631 3-persons, 844 4-persons, 270 5-persons, 83 6-persons, 41 7-or-more-persons.
Size of nonfamily households: 806 1-person, 152 2-persons, 19 3-persons.
1,827 married couples with children.
311 single-parent households (282 men, 29 women).
87.2% of residents of Paradise Valley speak English at home.
6.3% of residents speak Spanish at home (92% speak English very well, 6% speak English well, 2% speak English not well).
4.2% of residents speak other Indo-European language at home (95% speak English very well, 5% speak English well).
2.0% of residents speak Asian or Pacific Island language at home (63% speak English very well, 14% speak English well, 23% speak English not well).
0.3% of residents speak other language at home (100% speak English very well).
Foreign born population: 1,750 (13.4%)
(73.5% of them are naturalized citizens)
| Here: | 10.0 |
| State: | 6.0 |
| Here: | 6.7 |
| State: | 4.1 |
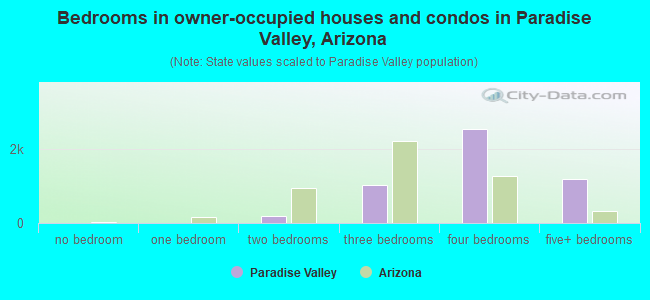
- Bedrooms in owner-occupied houses and condos in Paradise Valley, Arizona
- 0no bedroom
- 101 bedroom
- 1912 bedrooms
- 1,0233 bedrooms
- 2,5544 bedrooms
- 1,1985+ bedrooms
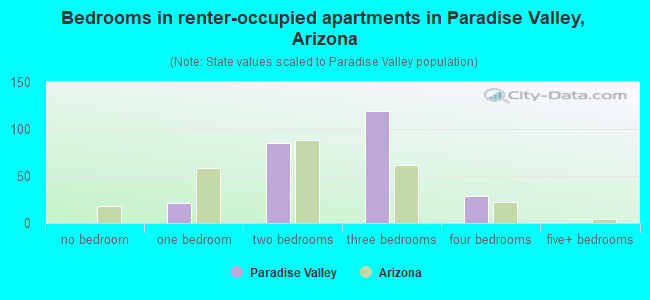
- Bedrooms in renter-occupied apartments in Paradise Valley, Arizona
- 0no bedroom
- 211 bedroom
- 852 bedrooms
- 1193 bedrooms
- 294 bedrooms
- 05+ bedrooms
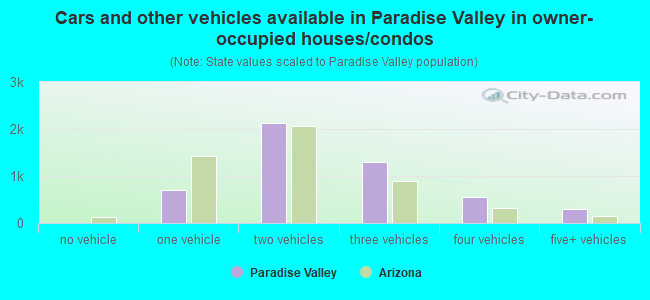
- Cars and other vehicles available in Paradise Valley in owner-occupied houses/condos
- 0no vehicle
- 7051 vehicle
- 2,1312 vehicles
- 1,3023 vehicles
- 5504 vehicles
- 2885+ vehicles
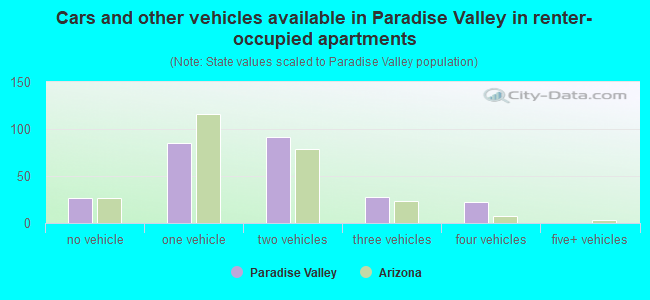
- Cars and other vehicles available in Paradise Valley in renter-occupied apartments
- 27no vehicle
- 851 vehicle
- 922 vehicles
- 283 vehicles
- 224 vehicles
- 05+ vehicles

- Rooms in owner-occupied houses in Paradise Valley, Arizona
- 01 room
- 02 rooms
- 03 rooms
- 254 rooms
- 2645 rooms
- 3706 rooms
- 7257 rooms
- 1,0608 rooms
- 2,5329+ rooms
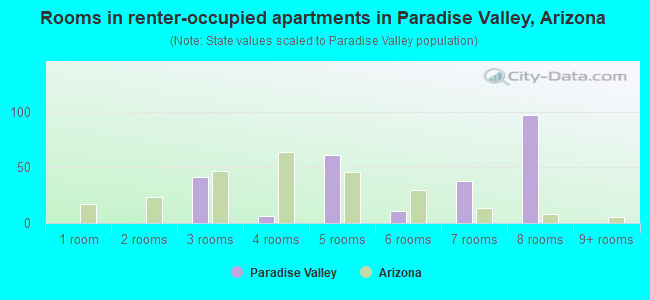
- Rooms in renter-occupied apartments in Paradise Valley, Arizona
- 01 room
- 02 rooms
- 413 rooms
- 64 rooms
- 615 rooms
- 106 rooms
- 377 rooms
- 978 rooms
- 09+ rooms
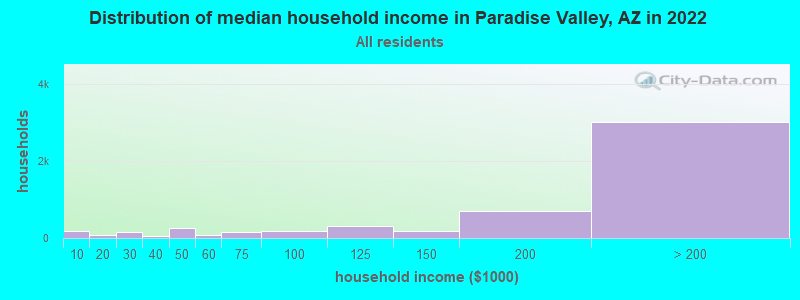
Paradise Valley, AZ household income distribution

- 178Less than $10,000
- 88$10,000 to $19,999
- 156$20,000 to $29,999
- 60$30,000 to $39,999
- 266$40,000 to $49,999
- 84$50,000 to $59,999
- 156$60,000 to $74,999
- 182$75,000 to $99,999
- 310$100,000 to $124,999
- 188$125,000 to $149,999
- 693$150,000 to $199,999
- 3,019$200,000 or more
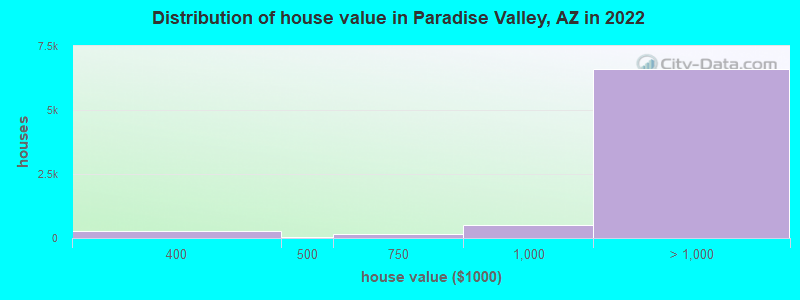
Home value of owner - occupied houses in 2022 in Paradise Valley, AZ
-
- 18Less than $10,000
- 11$10,000 to $14,999
- 10$70,000 to $79,999
- 6$100,000 to $124,999
- 3$125,000 to $149,999
- 3$150,000 to $174,999
- 24$200,000 to $249,999
- 14$250,000 to $299,999
- 263$300,000 to $399,999
- 23$400,000 to $499,999
- 138$500,000 to $749,999
- 524$750,000 to $999,999
- 1,105$1,000,000 to $1,499,999
- 905$1,500,000 to $1,999,999
- 4,604$2,000,000 or more
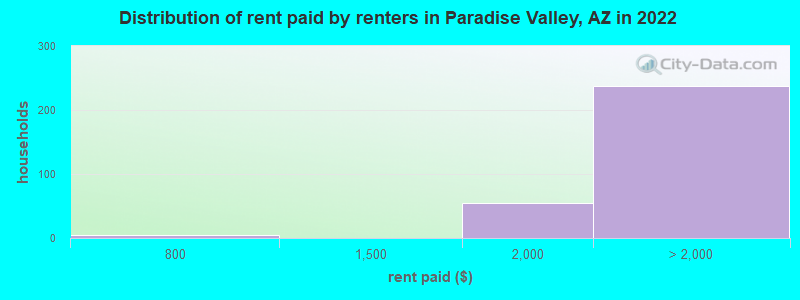
Rent paid by renters in 2022 in Paradise Valley, AZ
-
- 3$700 to $749
- 55$1,500 to $1,999
- 70$3,000 to $3,499
- 101$3,500 or more
- 65No cash rent
Percentage of workers working in this county: 96.8%
Number of people working at home: 1,847 (33.2% of all workers)
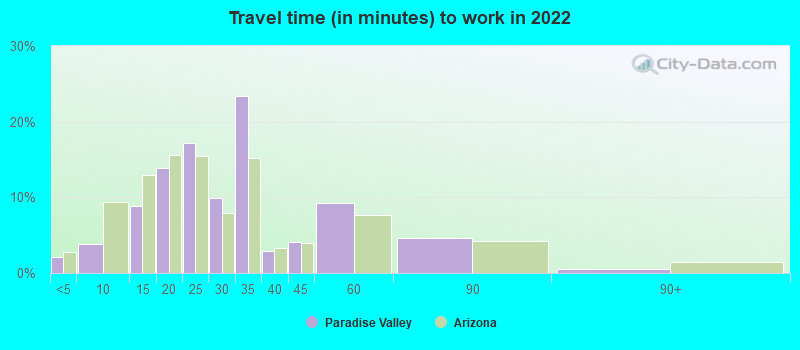
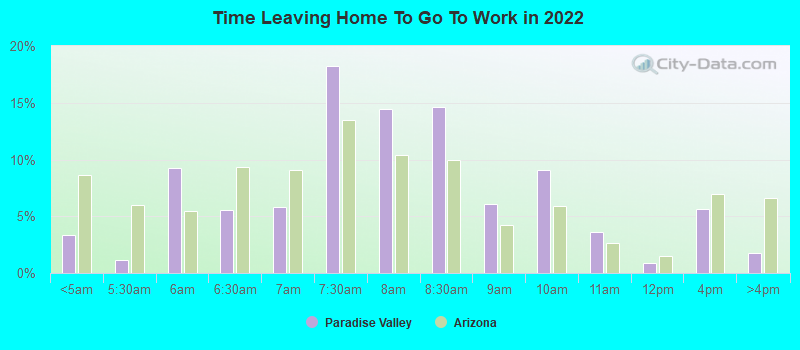
Travel time to work (commute)
- Less than 5 minutes: 86
- 5 to 9 minutes: 348
- 10 to 14 minutes: 670
- 15 to 19 minutes: 711
- 20 to 24 minutes: 574
- 25 to 29 minutes: 616
- 30 to 34 minutes: 737
- 35 to 39 minutes: 82
- 40 to 44 minutes: 68
- 45 to 59 minutes: 26
- 60 to 89 minutes: 30
- 90 or more minutes: 39
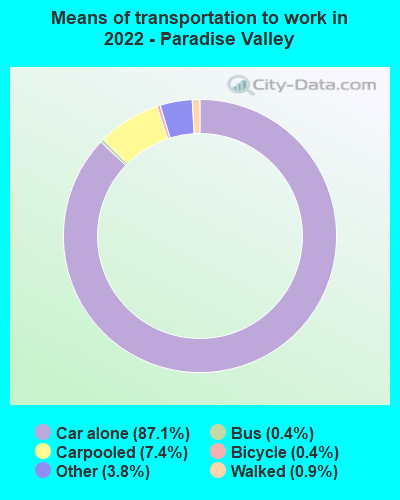
Means of transportation to work:
- Drove a car alone: 4,423 (64.5%)
- Carpooled: 400 (5.8%)
- Bus: 14 (0.2%)
- Taxi: 239 (3.5%)
- Bicycle: 19 (0.3%)
- Walked: 47 (0.7%)
- Worked at home: 1,847 (26.9%)
- Unemployment by race in 2022
- Unemployment rate for White non-Hispanic residents
- 1.1%Males
- 4.6%Females
- Unemployment rate for Hispanic or Latino residents
- 0.3%Males
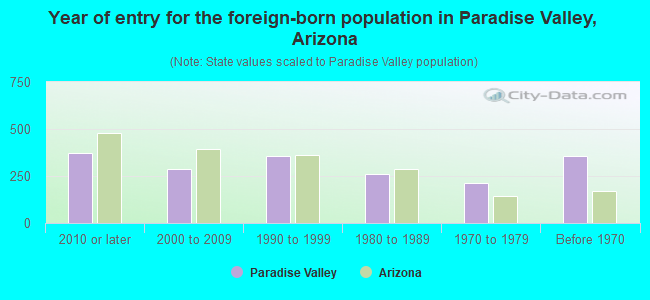
- Year of entry for the foreign-born population in Paradise Valley, Arizona
- 3722010 or later
- 2872000 to 2009
- 3551990 to 1999
- 2591980 to 1989
- 2141970 to 1979
- 354Before 1970
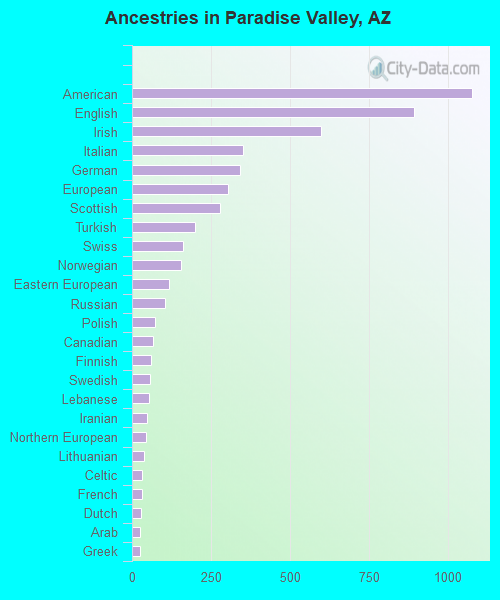
First ancestries reported:
- American: 1,077 (16.0%)
- English: 892 (13.3%)
- Irish: 598 (8.9%)
- Italian: 352 (5.2%)
- German: 342 (5.1%)
- European: 305 (4.5%)
- Scottish: 279 (4.1%)
- Turkish: 198 (2.9%)
- Swiss: 162 (2.4%)
- Norwegian: 156 (2.3%)
- Eastern European: 118 (1.8%)
- Russian: 104 (1.5%)
- Polish: 74 (1.1%)
- Canadian: 67 (1.0%)
- Finnish: 61 (0.9%)
- Swedish: 56 (0.8%)
- Lebanese: 54 (0.8%)
- Iranian: 46 (0.7%)
- Northern European: 43 (0.6%)
- Lithuanian: 38 (0.6%)
- Celtic: 33 (0.5%)
- French: 32 (0.5%)
- Dutch: 27 (0.4%)
- Arab: 26 (0.4%)
- Greek: 26 (0.4%)
- South African: 24 (0.4%)
- Serbian: 21 (0.3%)
- Israeli: 20 (0.3%)
- French Canadian: 19 (0.3%)
- Scotch-Irish: 19 (0.3%)
- Croatian: 14 (0.2%)
- British: 14 (0.2%)
- Cypriot: 12 (0.2%)
- Egyptian: 10 (0.1%)
- Romanian: 8 (0.1%)
- Czech: 8 (0.1%)
- Slovak: 8 (0.1%)
- Austrian: 7 (0.1%)
- Ukrainian: 6 (0.09%)
- Latvian: 4 (0.06%)
- Luxembourger: 4 (0.06%)
Most common places of birth for foreign-born residents (%):
| Paradise Valley: | 16.2% (283) |
| Arizona: | 53.4% (500,086) |
| Paradise Valley: | 15.3% (268) |
| Arizona: | 0.2% (1,702) |
| Paradise Valley: | 13.5% (236) |
| Arizona: | 4.3% (40,102) |
| Paradise Valley: | 12.5% (219) |
| Arizona: | 0.1% (993) |
| Paradise Valley: | 6.3% (110) |
| Arizona: | 4.5% (41,719) |
| Paradise Valley: | 5.4% (94) |
| Arizona: | 0.7% (6,565) |
| Paradise Valley: | 4.0% (70) |
| Arizona: | 0.1% (1,279) |
| Paradise Valley: | 2.6% (45) |
| Arizona: | 3.2% (30,378) |
| Paradise Valley: | 2.5% (44) |
| Arizona: | 0.3% (2,667) |
| Paradise Valley: | 2.4% (42) |
| Arizona: | 0.2% (1,831) |
| Paradise Valley: | 2.4% (42) |
| Arizona: | 1.6% (14,556) |
| Paradise Valley: | 2.3% (40) |
| Arizona: | 0.5% (4,961) |
| Paradise Valley: | 2.2% (39) |
| Arizona: | 0.6% (5,893) |
| Paradise Valley: | 2.1% (37) |
| Arizona: | 1.1% (9,889) |
| Paradise Valley: | 2.1% (36) |
| Arizona: | 0.2% (1,439) |
| Paradise Valley: | 2.1% (36) |
| Arizona: | 0.4% (3,365) |
| Paradise Valley: | 1.6% (28) |
| Arizona: | 1.5% (14,058) |
Place of birth for U.S.-born residents:
- This state: 3,361
- Other state: 7,506
- Northeast: 1,893
- Midwest: 3,118
- South: 961
- West: 1,420
88.5% of Paradise Valley residents lived in the same house 1 years ago.
Out of people who lived in different houses, 43.6% lived in this county.
Out of people who lived in different counties, 11.5% lived in Arizona.
| Paradise Valley: | 88.5% |
| State average: | 86.0% |
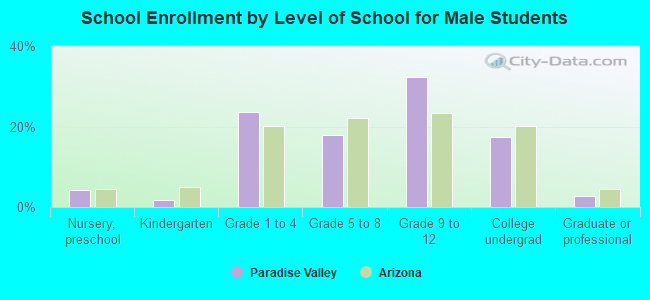
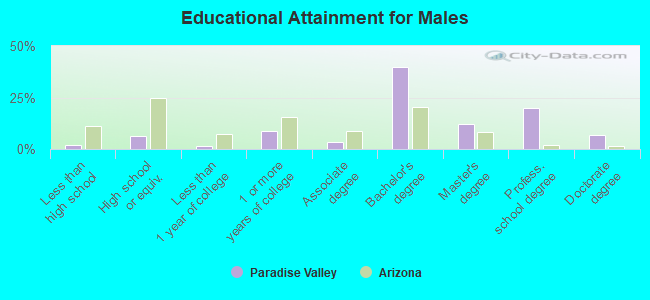
Education attainment for males 25 years and older:
- No schooling: 14
- Nursery to 4th grade: 0
- 5th and 6th grade: 0
- 7th and 8th grade: 0
- 9th grade: 10
- 10th grade: 26
- 11th grade: 0
- 12th grade, no diploma: 45
- High school graduate (or equivalency): 333
- Less than 1 year of college: 78
- Some college more than 1 year, no degree: 453
- Associate degree: 170
- Bachelor's degree: 2,088
- Master's degree: 632
- Professional school degree: 1,060
- Doctorate degree: 354
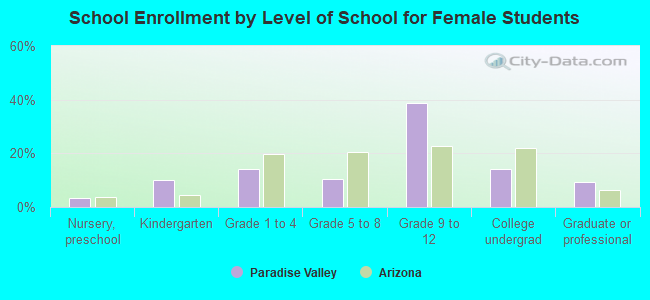
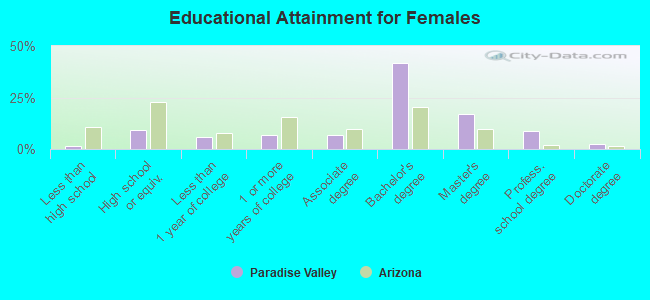
Education attainment for females 25 years and older:
- No schooling: 44
- Nursery to 4th grade: 9
- 5th and 6th grade: 0
- 7th and 8th grade: 6
- 9th grade: 0
- 10th grade: 7
- 11th grade: 2
- 12th grade, no diploma: 0
- High school graduate (or equivalency): 449
- Less than 1 year of college: 293
- Some college more than 1 year, no degree: 343
- Associate degree: 340
- Bachelor's degree: 2,066
- Master's degree: 848
- Professional school degree: 440
- Doctorate degree: 112


Housing units in structures:
- One, detached: 5,848
- One, attached: 92
- Two: 22
- 3 or 4: 8
- 10 to 19: 6
- Mobile homes: 10
Housing units lacking complete kitchen facilities in 2022: 1.2%
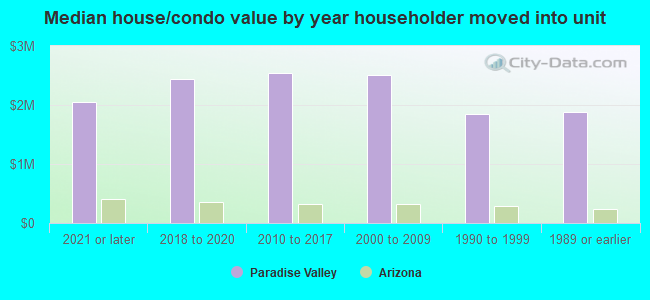
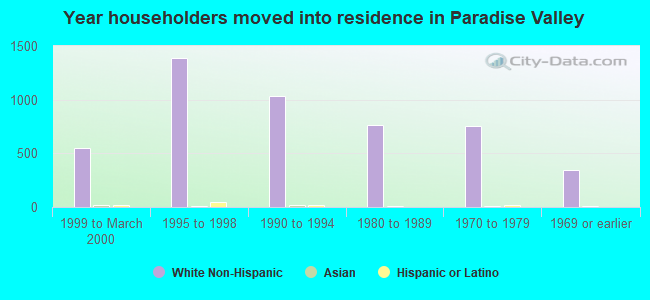
House/condo owner moved in on average 14 years ago
Renter moved in on average 4 years ago
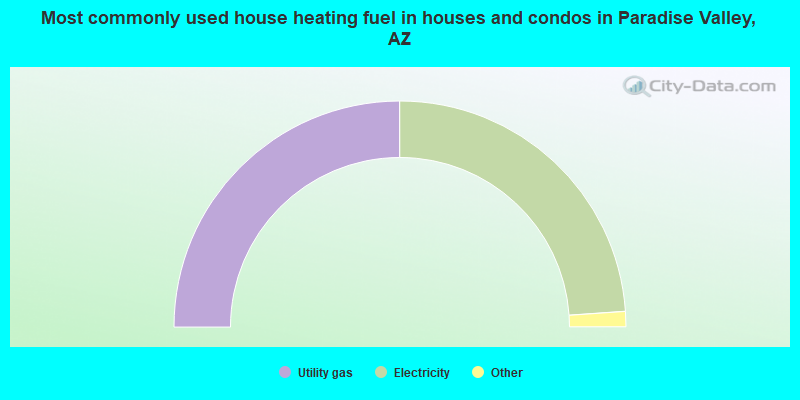
- 50.0%Utility gas
- 47.9%Electricity
- 1.4%Solar energy
- 0.4%Fuel oil, kerosene, etc.
- 0.2%Other fuel
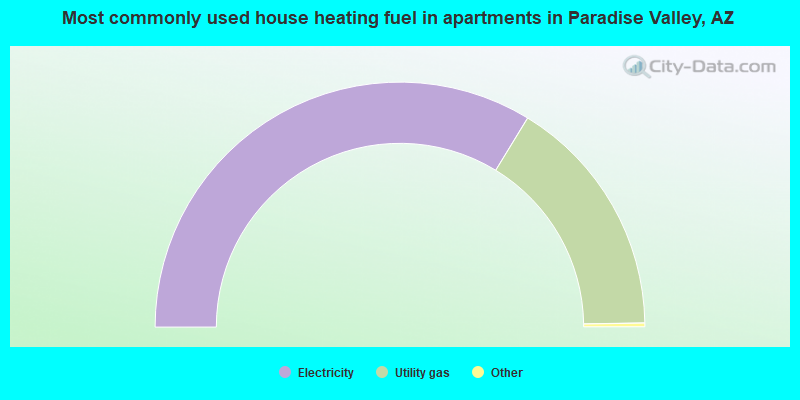
- 67.8%Electricity
- 32.2%Utility gas
Private vs. public school enrollment:
| Here: | 40.8% |
| Arizona: | 10.4% |
| Here: | 30.8% |
| Arizona: | 8.8% |
| Here: | 51.2% |
| Arizona: | 13.1% |