Papago, AZ (Arizona) Houses and Residents
| Papago: | $106,285 |
| Arizona: | $402,800 |
Total population: 8,799 (Urban population: 0, Rural population: 7,492 (77 farm, 7,415 nonfarm))
Houses: 2,457 (1,997 occupied: 1,351 owner occupied, 646 renter occupied)
| % of renters here: | 32% |
| State: | 33% |
Housing density: 1 houses/condos per square mile
Median price asked for vacant for-sale houses and condos in 2022 in this county: $287,979.
Median contract rent in 2022: $288 (lower quartile is $197, upper quartile is $621)
Median rent asked for vacant for-rent units in 2022: $523
Median gross rent in Papago, AZ in 2022: $544
Housing units in Papago with a mortgage: 210 (0 second mortgage, 0 home equity loan, 0 both second mortgage and home equity loan)
Houses without a mortgage: 904


Household type by relationship:
Households: 956,124- In family households: 768,799 (166,055 male householders, 77,112 female householders)
172,857 spouses, 262,621 children (241,454 natural, 7,750 adopted, 13,417 stepchildren), 25,096 grandchildren, 10,634 brothers or sisters, 9,582 parents, foster children, 12,552 other relatives, 25,522 non-relatives
- In nonfamily households: 187,325 (70,125 male householders (52,289 living alone)), 75,368 female householders (61,272 living alone)), 41,832 nonrelatives
- In group quarters: 24,139 (12,178 institutionalized population)
127,168 married couples with children.
55,310 single-parent households (13,106 men, 42,204 women).
46.0% of residents of Papago speak English at home.
1.7% of residents speak Spanish at home (74% speak English very well, 26% speak English well).
0.2% of residents speak other Indo-European language at home (27% speak English very well, 36% speak English well, 36% speak English not well).
0.1% of residents speak Asian or Pacific Island language at home (100% speak English well).
52.1% of residents speak other language at home (49% speak English very well, 40% speak English well, 9% speak English not well, 2% don't speak English at all).
Foreign born population: 98 (1.0%)
(73.5% of them are naturalized citizens)
| Here: | 3.6 |
| State: | 6.0 |
| Here: | 4.0 |
| State: | 4.1 |

- Bedrooms in owner-occupied houses and condos in Papago, Arizona
- 160no bedroom
- 3111 bedroom
- 3192 bedrooms
- 4133 bedrooms
- 1164 bedrooms
- 325+ bedrooms

- Bedrooms in renter-occupied apartments in Papago, Arizona
- 37no bedroom
- 1861 bedroom
- 1702 bedrooms
- 1623 bedrooms
- 684 bedrooms
- 235+ bedrooms

- Cars and other vehicles available in Papago in owner-occupied houses/condos
- 444no vehicle
- 5851 vehicle
- 2282 vehicles
- 663 vehicles
- 174 vehicles
- 115+ vehicles

- Cars and other vehicles available in Papago in renter-occupied apartments
- 244no vehicle
- 2691 vehicle
- 1222 vehicles
- 53 vehicles
- 04 vehicles
- 65+ vehicles

- Rooms in owner-occupied houses in Papago, Arizona
- 1061 room
- 1832 rooms
- 2943 rooms
- 3044 rooms
- 2595 rooms
- 1216 rooms
- 537 rooms
- 198 rooms
- 129+ rooms

- Rooms in renter-occupied apartments in Papago, Arizona
- 281 room
- 1192 rooms
- 1273 rooms
- 1164 rooms
- 1355 rooms
- 776 rooms
- 397 rooms
- 58 rooms
- 09+ rooms


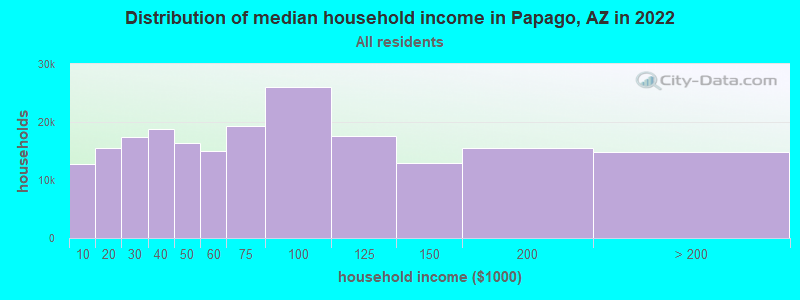
Papago, AZ household income distribution

- 12,753Less than $10,000
- 15,535$10,000 to $19,999
- 17,329$20,000 to $29,999
- 18,865$30,000 to $39,999
- 16,456$40,000 to $49,999
- 14,937$50,000 to $59,999
- 19,257$60,000 to $74,999
- 26,095$75,000 to $99,999
- 17,625$100,000 to $124,999
- 12,878$125,000 to $149,999
- 15,580$150,000 to $199,999
- 14,895$200,000 or more
Percentage of workers working in this county: 91.8%
Number of people working at home: 249 (14.6% of all workers)
Travel time to work (commute)
- Less than 5 minutes: 186
- 5 to 9 minutes: 274
- 10 to 14 minutes: 180
- 15 to 19 minutes: 99
- 20 to 24 minutes: 79
- 25 to 29 minutes: 15
- 30 to 34 minutes: 172
- 35 to 39 minutes: 20
- 40 to 44 minutes: 17
- 45 to 59 minutes: 66
- 60 to 89 minutes: 78
- 90 or more minutes: 98
Means of transportation to work:
- Drove a car alone: 729 (54.8%)
- Carpooled: 319 (24.0%)
- Bus or trolley bus: 11 (0.8%)
- Streetcar or trolley car: 9 (0.7%)
- Walked: 170 (12.8%)
- Other means: 46 (3.5%)
- Worked at home: 47 (3.5%)


- Year of entry for the foreign-born population in Papago, Arizona
- 101995 to March 2000
- 171990 to 1994
- 131985 to 1989
- 01980 to 1984
- 61975 to 1979
- 51970 to 1974
- 161965 to 1969
- 12Before 1965
Most common places of birth for foreign-born residents (%):
| Papago: | 54.4% (43) |
| Arizona: | 66.4% (436,022) |
| Papago: | 10.1% (8) |
| Arizona: | 0.1% (585) |
| Papago: | 7.6% (6) |
| Arizona: | 0.3% (1,708) |
| Papago: | 6.3% (5) |
| Arizona: | 1.8% (11,916) |
| Papago: | 6.3% (5) |
| Arizona: | 0.1% (450) |
| Papago: | 6.3% (5) |
| Arizona: | 4.0% (26,323) |
| Papago: | 5.1% (4) |
| Arizona: | 1.4% (9,134) |
| Papago: | 3.8% (3) |
| Arizona: | 0.3% (1,928) |
Place of birth for U.S.-born residents:
- This state: 7,055
- Other state: 337
- Northeast: 21
- Midwest: 72
- South: 43
- West: 201
76% of Papago residents lived in the same house 5 years ago.
Out of people who lived in different houses, 72% lived in this county.
Out of people who lived in different counties, 63% lived in Arizona.
Education attainment for males 25 years and older:
- No schooling: 59
- Nursery to 4th grade: 17
- 5th and 6th grade: 53
- 7th and 8th grade: 129
- 9th grade: 64
- 10th grade: 93
- 11th grade: 169
- 12th grade, no diploma: 116
- High school graduate (or equivalency): 805
- Less than 1 year of college: 33
- Some college more than 1 year, no degree: 118
- Associate degree: 37
- Bachelor's degree: 44
- Master's degree: 12
- Professional school degree: 4
- Doctorate degree: 10

Education attainment for females 25 years and older:
- No schooling: 58
- Nursery to 4th grade: 53
- 5th and 6th grade: 43
- 7th and 8th grade: 119
- 9th grade: 92
- 10th grade: 116
- 11th grade: 180
- 12th grade, no diploma: 79
- High school graduate (or equivalency): 738
- Less than 1 year of college: 117
- Some college more than 1 year, no degree: 194
- Associate degree: 96
- Bachelor's degree: 75
- Master's degree: 78
- Professional school degree: 0
- Doctorate degree: 0


Housing units in structures:
- One, detached: 1,857
- One, attached: 169
- Two: 79
- 3 or 4: 55
- 5 to 9: 53
- 50 or more: 11
- Mobile homes: 233
Median worth of mobile homes: $62,237
Housing units lacking complete kitchen facilities: 24.8%

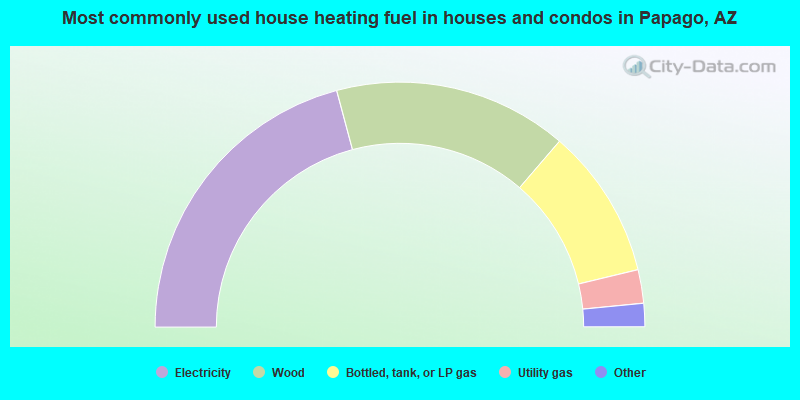
- 41.7%Electricity
- 30.9%Wood
- 19.9%Bottled, tank, or LP gas
- 4.4%Utility gas
- 2.5%No fuel used
- 0.6%Fuel oil, kerosene, etc.
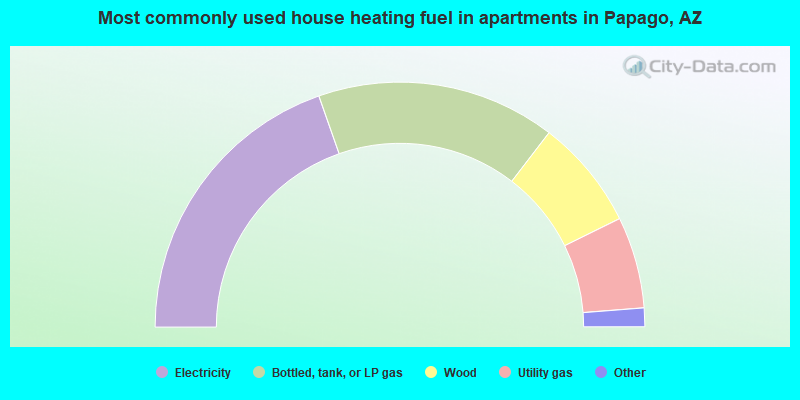
- 39.3%Electricity
- 31.6%Bottled, tank, or LP gas
- 14.6%Wood
- 12.1%Utility gas
- 1.9%No fuel used
- 0.6%Other fuel
Private vs. public school enrollment:
| Here: | 1.9% |
| Arizona: | 6.1% |
| Here: | 3.7% |
| Arizona: | 6.1% |
| Here: | 3.9% |
| Arizona: | 13.2% |


