Housing density: 1,396 houses/condos per square mile
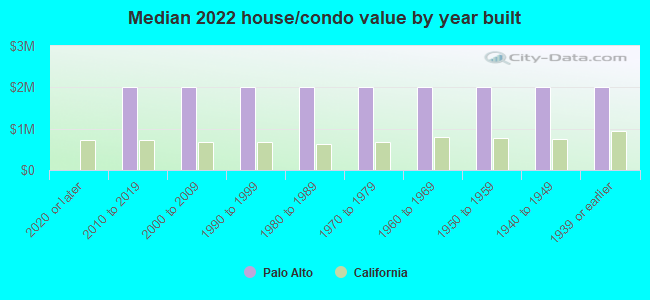
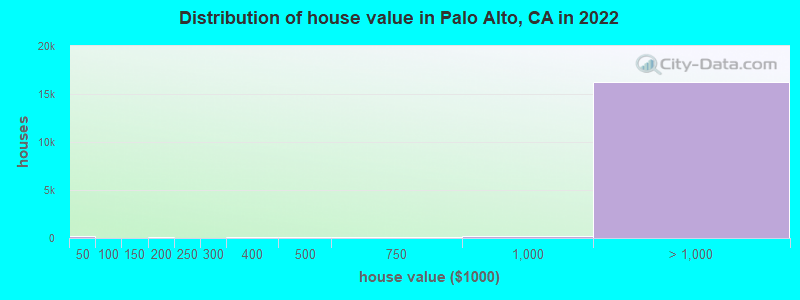
Median price asked for vacant for-sale houses and condos in 2022: $4,391,318.
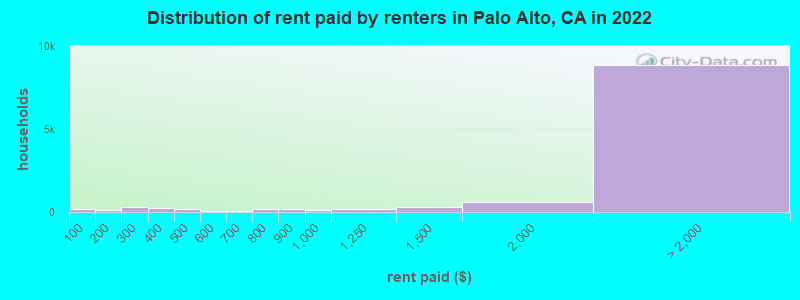
Median contract rent in 2022: over $2,000 (lower quartile is over $2,000, upper quartile is over $2,000)
Median rent asked for vacant for-rent units in 2022: $6,638
Median gross rent in Palo Alto, CA in 2022: over $2,000
Housing units in Palo Alto with a mortgage: 8,297 (1,774 second mortgage, 0 home equity loan, 1,609 both second mortgage and home equity loan) Houses without a mortgage: 0
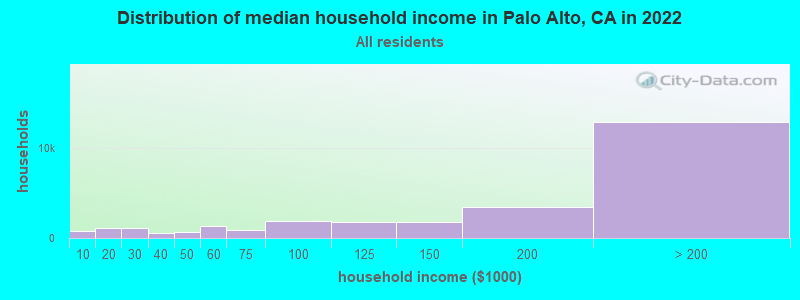
Median household income for houses/condos with a mortgage: $250,001
Median household income for apartments without a mortgage: $153,416
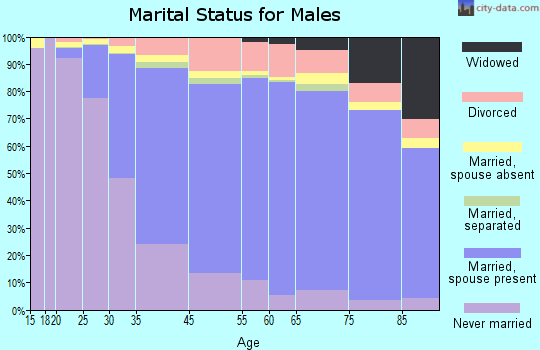
11,966 married couples with children.
1,890 single-parent households (685 men, 1,205 women).
60.0% of residents of Palo Alto speak English at home.
4.6% of residents speak Spanish at home (62% speak English very well, 21% speak English well, 17% speak English not well).
12.0% of residents speak other Indo-European language at home (87% speak English very well, 8% speak English well, 4% speak English not well, 1% don't speak English at all).
22.2% of residents speak Asian or Pacific Island language at home (69% speak English very well, 21% speak English well, 9% speak English not well, 2% don't speak English at all).
1.3% of residents speak other language at home (95% speak English very well, 2% speak English well, 1% speak English not well, 2% don't speak English at all).
Foreign born population: 20,855 (31.6%)
(56.2% of them are naturalized citizens)
Percentage of workers working in this county: 85.6% Number of people working at home: 12,068 (36.7% of all workers)
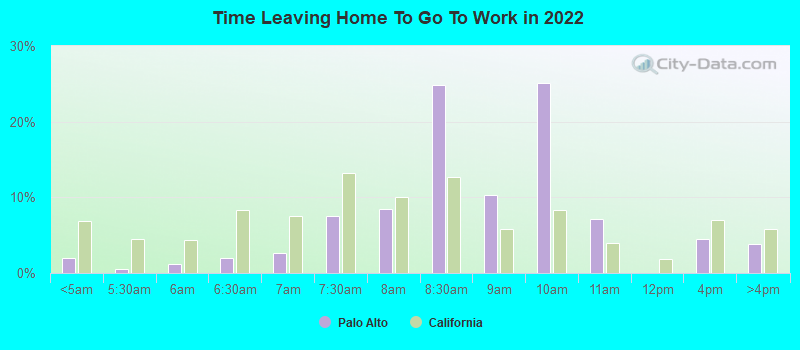
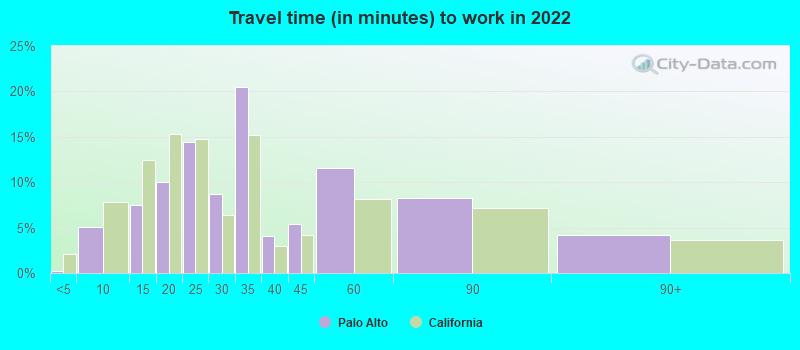
Travel time to work (commute)
Less than 5 minutes: 79
5 to 9 minutes: 1,822
10 to 14 minutes: 3,392
15 to 19 minutes: 5,344
20 to 24 minutes: 3,993
25 to 29 minutes: 2,199
30 to 34 minutes: 2,856
35 to 39 minutes: 108
40 to 44 minutes: 1,283
45 to 59 minutes: 829
60 to 89 minutes: 687
90 or more minutes: 160
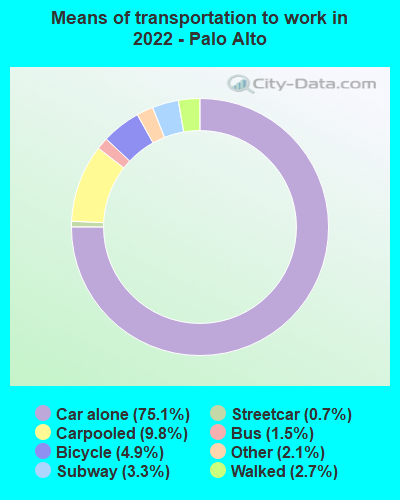
Means of transportation to work:
Drove a car alone: 51,760 (64.7%)
Carpooled: 6,759 (8.5%)
Bus: 1,044 (1.3%)
Subway or elevated rail: 456 (0.6%)
Long-distance train or commuter rail: 2,258 (2.8%)
Taxi: 1,416 (1.8%)
Bicycle: 3,375 (4.2%)
Walked: 1,884 (2.4%)
Worked at home: 11,011 (13.8%)
Unemployment by race in 2022
Unemployment rate for White non-Hispanic residents
2.1%Males
2.2%Females
Unemployment rate for Black residents
5.1%Females
Unemployment rate for American Indian and Alaska Native residents
94.6%Males
Unemployment rate for Asian residents
2.5%Males
2.6%Females
Unemployment rate for two or more race residents
4.7%Males
3.6%Females
Unemployment rate for Hispanic or Latino residents
1.2%Males
0.9%Females
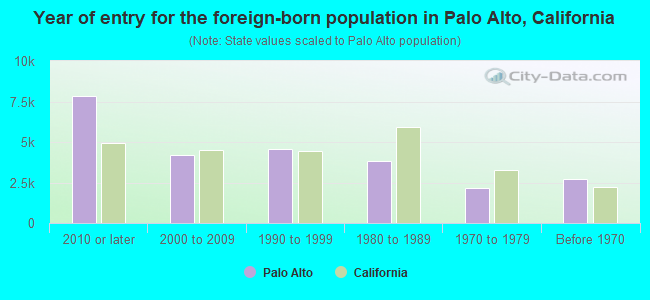
Year of entry for the foreign-born population in Palo Alto, California
7,8442010 or later
4,1782000 to 2009
4,5471990 to 1999
3,8181980 to 1989
2,1841970 to 1979
2,745Before 1970
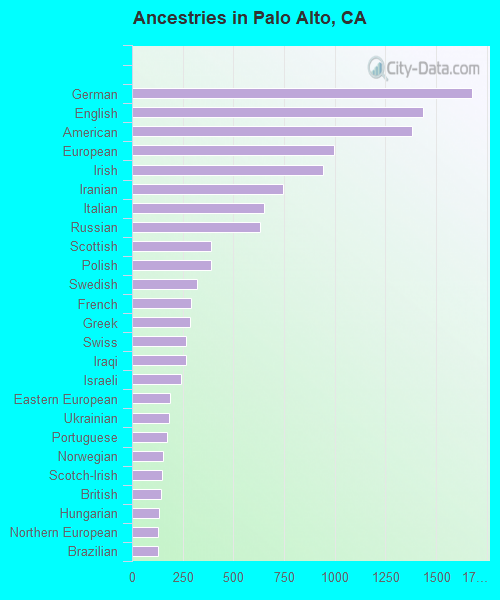
First ancestries reported:
German: 1,677 (4.4%)
English: 1,435 (3.8%)
American: 1,382 (3.7%)
European: 997 (2.6%)
Irish: 940 (2.5%)
Iranian: 746 (2.0%)
Italian: 649 (1.7%)
Russian: 633 (1.7%)
Scottish: 391 (1.0%)
Polish: 390 (1.0%)
Swedish: 319 (0.8%)
French: 293 (0.8%)
Greek: 287 (0.8%)
Swiss: 267 (0.7%)
Iraqi: 266 (0.7%)
Israeli: 243 (0.6%)
Eastern European: 185 (0.5%)
Ukrainian: 182 (0.5%)
Portuguese: 174 (0.5%)
Norwegian: 153 (0.4%)
Scotch-Irish: 148 (0.4%)
British: 143 (0.4%)
Hungarian: 132 (0.3%)
Northern European: 128 (0.3%)
Brazilian: 128 (0.3%)
Turkish: 106 (0.3%)
Lithuanian: 95 (0.3%)
Dutch: 90 (0.2%)
Danish: 81 (0.2%)
Romanian: 78 (0.2%)
Slovak: 64 (0.2%)
Czech: 58 (0.2%)
Scandinavian: 47 (0.1%)
South African: 40 (0.1%)
Jordanian: 38 (0.1%)
Australian: 36 (0.10%)
Bulgarian: 33 (0.09%)
French Canadian: 32 (0.08%)
Serbian: 31 (0.08%)
Icelander: 29 (0.08%)
Celtic: 28 (0.07%)
Canadian: 28 (0.07%)
Finnish: 25 (0.07%)
Ghanaian: 21 (0.06%)
Yugoslavian: 21 (0.06%)
Haitian: 20 (0.05%)
Egyptian: 17 (0.04%)
Welsh: 17 (0.04%)
Arab: 16 (0.04%)
Belgian: 15 (0.04%)
Austrian: 15 (0.04%)
Estonian: 15 (0.04%)
Slovene: 14 (0.04%)
Latvian: 13 (0.03%)
Basque: 10 (0.03%)
Assyrian: 10 (0.03%)
Moroccan: 9 (0.02%)
Lebanese: 9 (0.02%)
African: 9 (0.02%)
Czechoslovakian: 7 (0.02%)
Armenian: 7 (0.02%)
Jamaican: 7 (0.02%)
Syrian: 6 (0.02%)
Slavic: 5 (0.01%)
Croatian: 3 (0.01%)
Most common places of birth for foreign-born residents (%):
China, excluding Hong Kong and Taiwan
Palo Alto:
22.0% (5,133)
California:
6.6% (684,672)
India
Palo Alto:
11.7% (2,740)
California:
5.2% (539,184)
Taiwan
Palo Alto:
6.4% (1,499)
California:
1.7% (176,274)
Korea
Palo Alto:
5.5% (1,275)
California:
3.0% (315,248)
Germany
Palo Alto:
4.1% (945)
California:
0.7% (73,304)
Canada
Palo Alto:
3.8% (894)
California:
1.2% (127,477)
Hong Kong
Palo Alto:
3.7% (869)
California:
1.0% (105,215)
Russia
Palo Alto:
3.3% (777)
California:
0.7% (71,932)
Iran
Palo Alto:
2.9% (681)
California:
2.0% (206,004)
Mexico
Palo Alto:
2.6% (598)
California:
37.2% (3,881,193)
Japan
Palo Alto:
2.4% (556)
California:
1.0% (103,575)
Philippines
Palo Alto:
1.8% (409)
California:
7.8% (818,297)
United Kingdom, excluding England and Scotland
Palo Alto:
1.6% (371)
California:
0.6% (60,582)
France
Palo Alto:
1.6% (370)
California:
0.4% (40,224)
Israel
Palo Alto:
1.5% (360)
California:
0.3% (33,029)
Place of birth for U.S.-born residents:
This state: 24,016
Other state: 18,688
Northeast: 6,665
Midwest: 5,907
South: 2,636
West: 3,480
82.4% of Palo Alto residents lived in the same house 1 years ago. Out of people who lived in different houses, 37.7% lived in this county. Out of people who lived in different counties, 69.2% lived in California.
Palo Alto:
82.4%
State average:
88.9%
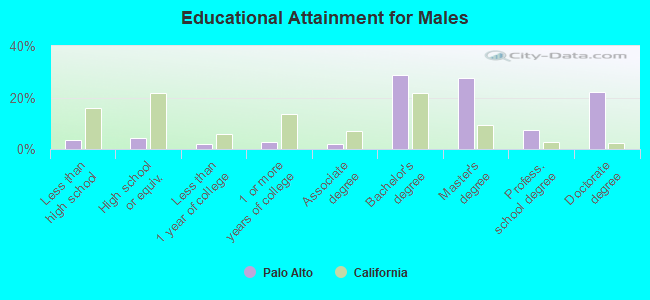
Education attainment for males 25 years and older:
No schooling: 15
Nursery to 4th grade: 0
5th and 6th grade: 0
7th and 8th grade: 606
9th grade: 0
10th grade: 83
11th grade: 0
12th grade, no diploma: 144
High school graduate (or equivalency): 1,069
Less than 1 year of college: 465
Some college more than 1 year, no degree: 661
Associate degree: 466
Bachelor's degree: 6,916
Master's degree: 6,679
Professional school degree: 1,785
Doctorate degree: 5,335
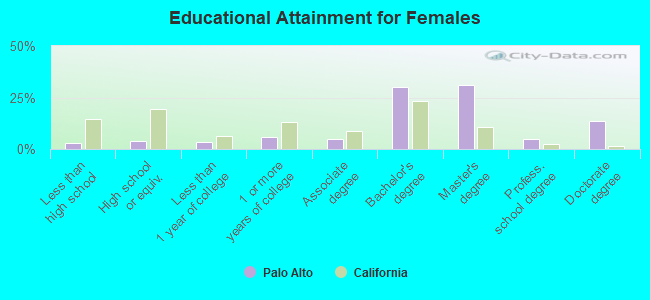
Education attainment for females 25 years and older:
No schooling: 89
Nursery to 4th grade: 0
5th and 6th grade: 432
7th and 8th grade: 21
9th grade: 0
10th grade: 0
11th grade: 157
12th grade, no diploma: 79
High school graduate (or equivalency): 996
Less than 1 year of college: 835
Some college more than 1 year, no degree: 1,492
Associate degree: 1,273
Bachelor's degree: 7,794
Master's degree: 8,023
Professional school degree: 1,261
Doctorate degree: 3,495
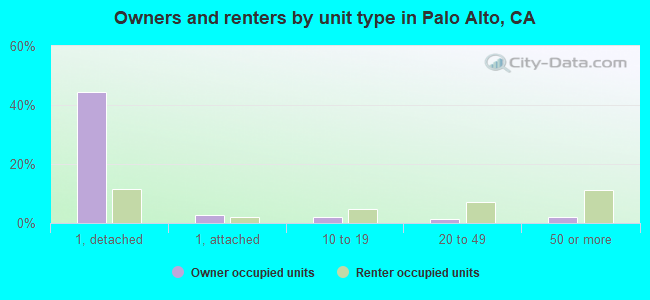
Housing units in structures:
One, detached: 18,706
One, attached: 2,729
Two: 388
3 or 4: 1,155
5 to 9: 1,533
10 to 19: 1,330
20 to 49: 3,134
50 or more: 3,978
Mobile homes: 95
Housing units lacking complete plumbing facilities in 2022: 1.0%
Housing units lacking complete kitchen facilities in 2022: 1.5%
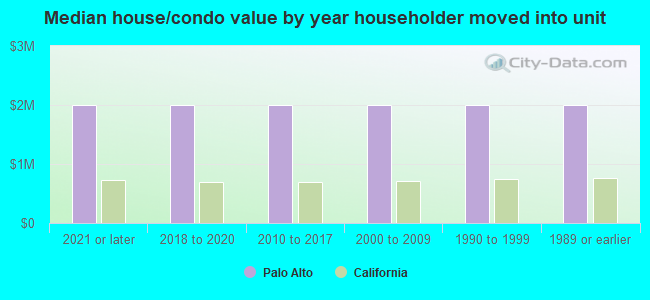
House/condo owner moved in on average 21 years ago