Palm Springs, FL (Florida) Houses and Residents
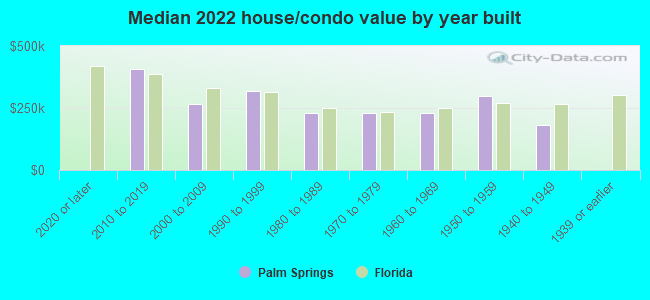
Estimated median house or condo value in 2022: $254,835 (it was $65,700 in 2000 )
Palm Springs:
$254,835Florida:
$354,100
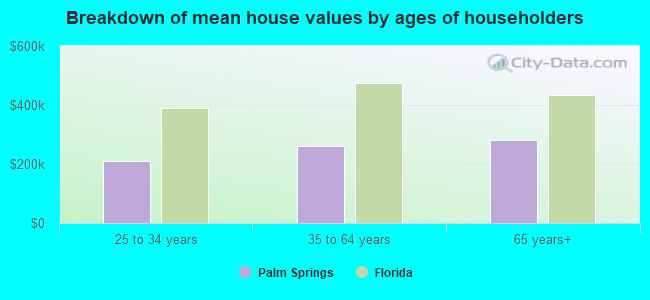
Lower value quartile - upper value quartile: $136,611 - $387,625Mean price in 2022: Detached houses: $324,585 Here:
$324,585State:
$500,941
Townhouses or other attached units: $201,110 Here:
$201,110State:
$370,869
In 2-unit structures: $180,998 Here:
$180,998State:
$423,188
In 3-to-4-unit structures: $230,076 Here:
$230,076State:
$309,944
In 5-or-more-unit structures: $112,538 Here:
$112,538State:
$447,145
Mobile homes: $25,186 Here:
$25,186State:
$113,202
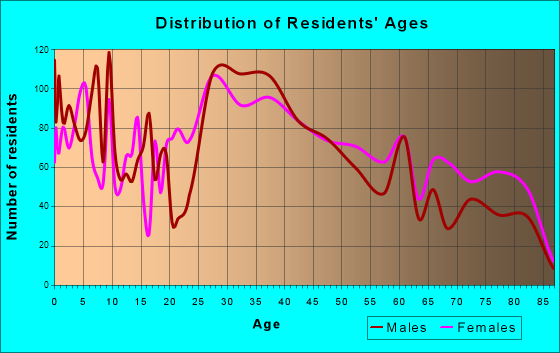
Total population: 21,728 (Urban population: 11,822, Rural population: 0)
Houses: 10,193 (8,955 occupied: 4,067 owner occupied, 4,998 renter occupied )
% of renters here:
55%State:
33%
Housing density: 6,326 houses/condos per square mile
Median price asked for vacant for-sale houses and condos in 2022: $218,639.
Median contract rent in 2022: $1,372 (lower quartile is $1,063, upper quartile is $1,736)
Median rent asked for vacant for-rent units in 2022: $1,879
Median gross rent in Palm Springs, FL in 2022: $1,498
Housing units in Palm Springs with a mortgage: 2,462 (173 second mortgage, 0 home equity loan, 147 both second mortgage and home equity loan )Houses without a mortgage: 49
Median household income for houses/condos with a mortgage: $78,004
Median household income for apartments without a mortgage: $44,995
Median monthly housing costs: $1,354
Data:
Median house or condo value ($)
Median house or condo value ($ change since 2000)
Median house or condo value ($) - White
Median house or condo value ($) - Black or African American
Median house or condo value ($) - Asian
Median house or condo value ($) - Hispanic or Latino
Median house or condo value ($) - American Indian and Alaska Native
Median house or condo value ($) - Multirace
Median house or condo value ($) - Other Race
Median price asked for mobile homes ($)
Household density (households per square mile)
Mean house or condo value by units in structure - 1, detached ($)
Mean house or condo value by units in structure - 1, attached ($)
Mean house or condo value by units in structure - 2 ($)
Mean house or condo value by units in structure by units in structure - 3 or 4 ($)
Mean house or condo value by units in structure - 5 or more ($)
Mean house or condo value by units in structure - Boat, RV, van, etc. ($)
Mean house or condo value by units in structure - Mobile home ($)
Median contract rent ($)
Median contract rent - Lower quartile ($)
Median contract rent - Upper quartile ($)
Median gross rent ($)
Urban houses (%)
Rural houses (%)
Houses occupied (%)
Houses occupied (% change since 2000)
Houses owner occupied (%)
Houses owner occupied (% change since 2000)
Houses renter occupied (%)
Houses renter occupied (% change since 2000)
Vacant housing units - For rent (%)
Vacant housing units - For rent (% change since 2000)
Vacant housing units - For sale only (%)
Vacant housing units - For sale only (% change since 2000)
Vacant housing units - Rented or sold, not occupied (%)
Vacant housing units - Rented or sold, not occupied (% change since 2000)
Vacant housing units - For seasonal, recreational, or occasional use (%)
Vacant housing units - For seasonal, recreational, or occasional use (% change since 2000)
Vacant housing units - For migrant workers (%)
Vacant housing units - For migrant workers (% change since 2000)
Vacant housing units - Other vacant (%)
Vacant housing units - Other vacant (% change since 2000)
Median monthly housing costs ($)
Median household income for houses/condos with a mortgage ($)
Median household income for houses/condos without a mortgage ($)
Median household income ($)
Median household income ($) - White
Median household income ($) - Black or African American
Median household income ($) - Asian
Median household income ($) - Hispanic or Latino
Median household income ($) - American Indian and Alaska Native
Median household income ($) - Multirace
Median household income ($) - Other Race
Mortgage status - with mortgage (%)
Mortgage status - with second mortgage (%)
Mortgage status - with home equity loan (%)
Mortgage status - with both second mortgage and home equity loan (%)
Mortgage status - without a mortgage (%)
Median year house/condo built
Median year apartment built
Household type by relationship - Male householder living alone (%)
Household type by relationship - Male householder not living alone (%)
Household type by relationship - Female householder living alone (%)
Household type by relationship - Female householder not living alone (%)
Household type by relationship - Opposite-Sex spouse (%)
Household type by relationship - Same-Sex spouse (%)
Household type by relationship - Opposite-Sex unmarried partner (%)
Household type by relationship - Same-Sex unmarried partner (%)
Household type by relationship - In group quarters (%)
Size of family households - 2-person household (%)
Size of family households - 3-person household (%)
Size of family households - 4-person household (%)
Size of family households - 5-person household (%)
Size of family households - 6-person household (%)
Size of family households - 7-or-more-person household (%)
Size of nonfamily households - 1-person household (%)
Size of nonfamily households - 2-person household (%)
Size of nonfamily households - 3-person household (%)
Size of nonfamily households - 4-person household (%)
Size of nonfamily households - 5-person household (%)
Size of nonfamily households - 6-person household (%)
Size of nonfamily households - 7-or-moreperson household (%)
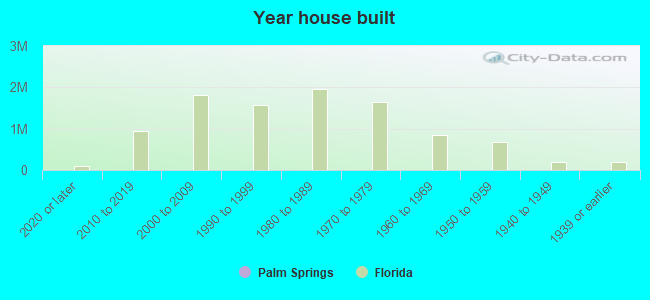
Year house built - Built 2010 or later (%)
Year house built - Built 2000 to 2009 (%)
Year house built - Built 1990 to 1999 (%)
Year house built - Built 1980 to 1989 (%)
Year house built - Built 1970 to 1979 (%)
Year house built - Built 1960 to 1969 (%)
Year house built - Built 1950 to 1959 (%)
Year house built - Built 1940 to 1949 (%)
Year house built - Built 1939 or earlier (%)
Median number of rooms in houses and condos
Median number of rooms in apartments
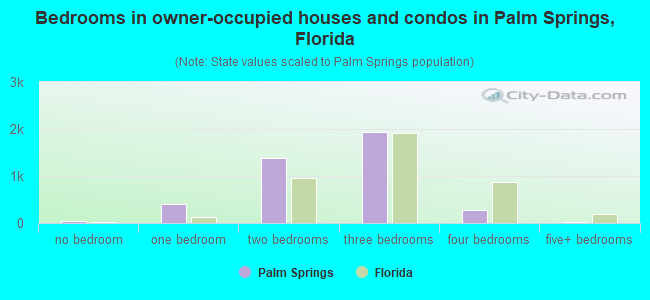
Median number of bedrooms in owner occupied houses
Mean number of bedrooms in owner occupied houses
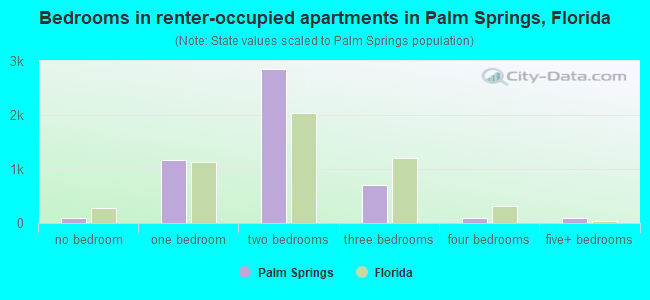
Median number of bedrooms in renter occupied houses
Mean number of bedrooms in renter occupied houses
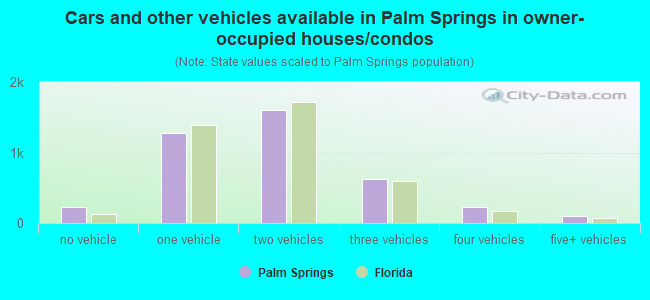
Median number of vehichles in owner occupied houses
Mean number of vehichles in owner occupied houses
Median number of vehichles in renter occupied houses
Mean number of vehichles in renter occupied houses
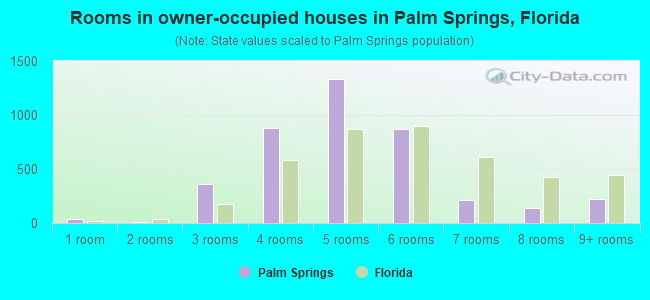
Rooms in owner-occupied houses - 1 room (%)
Rooms in owner-occupied houses - 2 rooms (%)
Rooms in owner-occupied houses - 3 rooms (%)
Rooms in owner-occupied houses - 4 rooms (%)
Rooms in owner-occupied houses - 5 rooms (%)
Rooms in owner-occupied houses - 6 rooms (%)
Rooms in owner-occupied houses - 7 rooms (%)
Rooms in owner-occupied houses - 8 rooms (%)
Rooms in owner-occupied houses - 9+ rooms (%)
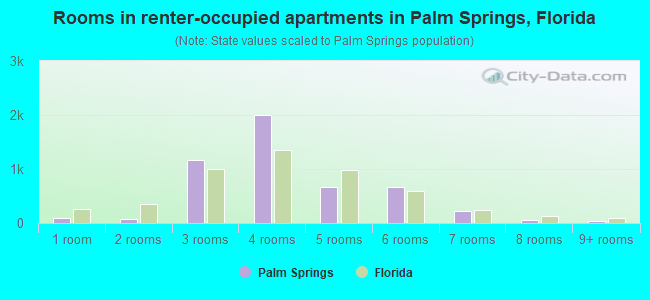
Rooms in renter-occupied houses - 1 room (%)
Rooms in renter-occupied houses - 2 rooms (%)
Rooms in renter-occupied houses - 3 rooms (%)
Rooms in renter-occupied houses - 4 rooms (%)
Rooms in renter-occupied houses - 5 rooms (%)
Rooms in renter-occupied houses - 6 rooms (%)
Rooms in renter-occupied houses - 7 rooms (%)
Rooms in renter-occupied houses - 8 rooms (%)
Rooms in renter-occupied houses - 9+ rooms (%)
Bedrooms in owner-occupied houses - no bedrooms (%)
Bedrooms in owner-occupied houses - 1 bedroom (%)
Bedrooms in owner-occupied houses - 2 bedrooms (%)
Bedrooms in owner-occupied houses - 3 bedrooms (%)
Bedrooms in owner-occupied houses - 4 bedrooms (%)
Bedrooms in owner-occupied houses - 5+ bedrooms (%)
Bedrooms in renter-occupied houses - no bedrooms (%)
Bedrooms in renter-occupied houses - 1 bedroom (%)
Bedrooms in renter-occupied houses - 2 bedrooms (%)
Bedrooms in renter-occupied houses - 3 bedrooms (%)
Bedrooms in renter-occupied houses - 4 bedrooms (%)
Bedrooms in renter-occupied houses - 5+ bedrooms (%)
Vehicles available in owner-occupied houses - no vehicle available (%)
Vehicles available in owner-occupied houses - 1 vehicle available(%)
Vehicles available in owner-occupied houses - 2 Vehicles available (%)
Vehicles available in owner-occupied houses - 3 Vehicles available (%)
Vehicles available in owner-occupied houses - 4 Vehicles available (%)
Vehicles available in owner-occupied houses - 5+ Vehicles available (%)
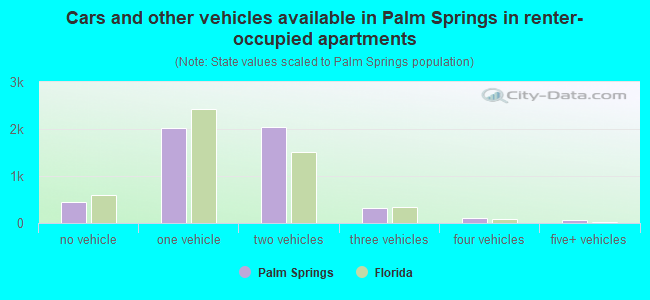
Vehicles available in renter-occupied houses - no vehicle available (%)
Vehicles available in renter-occupied houses - 1 vehicle available (%)
Vehicles available in renter-occupied houses - 2 Vehicles available (%)
Vehicles available in renter-occupied houses - 3 Vehicles available (%)
Vehicles available in renter-occupied houses - 4 Vehicles available (%)
Vehicles available in renter-occupied houses - 5+ Vehicles available (%)
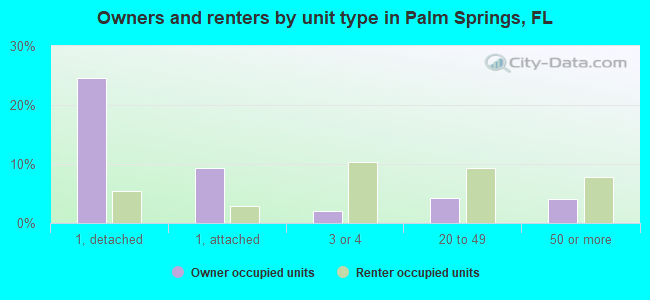
Housing units in structures - 1, detached (%)
Housing units in structures - 1, attached (%)
Housing units in structures - 2 (%)
Housing units in structures - 3 or 4 (%)
Housing units in structures - 5 to 9 (%)
Housing units in structures - 10 to 19 (%)
Housing units in structures - 20 to 49 (%)
Housing units in structures - 50 or more (%)
Housing units in structures - Mobile home (%)
Housing units in structures - Boat, RV, van, etc. (%)
Housing units in structures - Owners - 1, detached (%)
Housing units in structures - Owners - 1, attached (%)
Housing units in structures - Owners - 2 (%)
Housing units in structures - Owners - 3 or 4 (%)
Housing units in structures - Owners - 5 to 9 (%)
Housing units in structures - Owners - 10 to 19 (%)
Housing units in structures - Owners - 20 to 49 (%)
Housing units in structures - Owners - 50 or more (%)
Housing units in structures - Owners - Mobile home (%)
Housing units in structures - Owners - Boat, RV, van, etc. (%)
Housing units in structures - Renters - 1, detached (%)
Housing units in structures - Renters - 1, attached (%)
Housing units in structures - Renters - 2 (%)
Housing units in structures - Renters - 3 or 4 (%)
Housing units in structures - Renters - 5 to 9 (%)
Housing units in structures - Renters - 10 to 19 (%)
Housing units in structures - Renters - 20 to 49 (%)
Housing units in structures - Renters - 50 or more (%)
Housing units in structures - Renters - Mobile home (%)
Housing units in structures - Renters - Boat, RV, van, etc. (%)
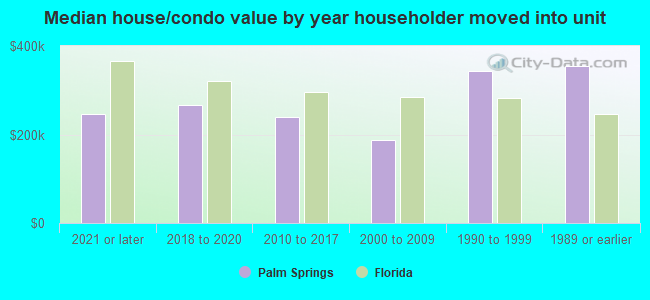
House/condo owner moved in on average (years ago)
Renter moved in on average (years ago)
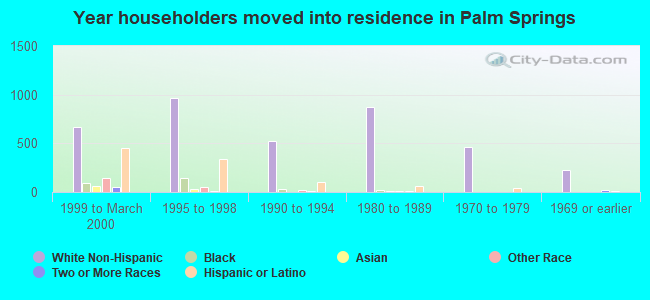
Year householder moved into unit - Moved in 1999 to March 2000 (%)
Year householder moved into unit - Moved in 1999 to March 2000 (%) - White
Year householder moved into unit - Moved in 1999 to March 2000 (%) - Black or African American
Year householder moved into unit - Moved in 1999 to March 2000 (%) - Asian
Year householder moved into unit - Moved in 1999 to March 2000 (%) - Hispanic or Latino
Year householder moved into unit - Moved in 1999 to March 2000 (%) - American Indian and Alaska Native
Year householder moved into unit - Moved in 1999 to March 2000 (%) - Multirace
Year householder moved into unit - Moved in 1999 to March 2000 (%) - Other Race
Year householder moved into unit - Moved in 1995 to 1998 (%)
Year householder moved into unit - Moved in 1995 to 1998 (%) - White
Year householder moved into unit - Moved in 1995 to 1998 (%) - Black or African American
Year householder moved into unit - Moved in 1995 to 1998 (%) - Asian
Year householder moved into unit - Moved in 1995 to 1998 (%) - Hispanic or Latino
Year householder moved into unit - Moved in 1995 to 1998 (%) - American Indian and Alaska Native
Year householder moved into unit - Moved in 1995 to 1998 (%) - Multirace
Year householder moved into unit - Moved in 1995 to 1998 (%) - Other Race
Year householder moved into unit - Moved in 1990 to 1994 (%)
Year householder moved into unit - Moved in 1990 to 1994 (%) - White
Year householder moved into unit - Moved in 1990 to 1994 (%) - Black or African American
Year householder moved into unit - Moved in 1990 to 1994 (%) - Asian
Year householder moved into unit - Moved in 1990 to 1994 (%) - Hispanic or Latino
Year householder moved into unit - Moved in 1990 to 1994 (%) - American Indian and Alaska Native
Year householder moved into unit - Moved in 1990 to 1994 (%) - Multirace
Year householder moved into unit - Moved in 1990 to 1994 (%) - Other Race
Year householder moved into unit - Moved in 1980 to 1989 (%)
Year householder moved into unit - Moved in 1980 to 1989 (%) - White
Year householder moved into unit - Moved in 1980 to 1989 (%) - Black or African American
Year householder moved into unit - Moved in 1980 to 1989 (%) - Asian
Year householder moved into unit - Moved in 1980 to 1989 (%) - Hispanic or Latino
Year householder moved into unit - Moved in 1980 to 1989 (%) - American Indian and Alaska Native
Year householder moved into unit - Moved in 1980 to 1989 (%) - Multirace
Year householder moved into unit - Moved in 1980 to 1989 (%) - Other Race
Year householder moved into unit - Moved in 1970 to 1979 (%)
Year householder moved into unit - Moved in 1970 to 1979 (%) - White
Year householder moved into unit - Moved in 1970 to 1979 (%) - Black or African American
Year householder moved into unit - Moved in 1970 to 1979 (%) - Asian
Year householder moved into unit - Moved in 1970 to 1979 (%) - Hispanic or Latino
Year householder moved into unit - Moved in 1970 to 1979 (%) - American Indian and Alaska Native
Year householder moved into unit - Moved in 1970 to 1979 (%) - Multirace
Year householder moved into unit - Moved in 1970 to 1979 (%) - Other Race
Year householder moved into unit - Moved in 1969 or earlier (%)
Year householder moved into unit - Moved in 1969 or earlier (%) - White
Year householder moved into unit - Moved in 1969 or earlier (%) - Black or African American
Year householder moved into unit - Moved in 1969 or earlier (%) - Asian
Year householder moved into unit - Moved in 1969 or earlier (%) - Hispanic or Latino
Year householder moved into unit - Moved in 1969 or earlier (%) - American Indian and Alaska Native
Year householder moved into unit - Moved in 1969 or earlier (%) - Multirace
Year householder moved into unit - Moved in 1969 or earlier (%) - Other Race
Housing units lacking complete plumbing facilities (%)
Housing units lacking complete kitchen facilities (%)
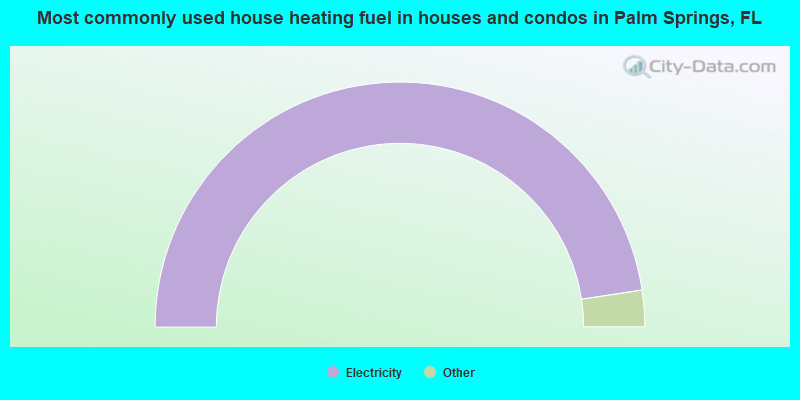
House heating fuel used in houses and condos - Utility gas (%)
House heating fuel used in houses and condos - Bottled, tank, or LP gas (%)
House heating fuel used in houses and condos - Electricity (%)
House heating fuel used in houses and condos - Fuel oil, kerosene, etc. (%)
House heating fuel used in houses and condos - Coal or coke (%)
House heating fuel used in houses and condos - Wood (%)
House heating fuel used in houses and condos - Solar energy (%)
House heating fuel used in houses and condos - Other fuel (%)
House heating fuel used in houses and condos - No fuel used (%)
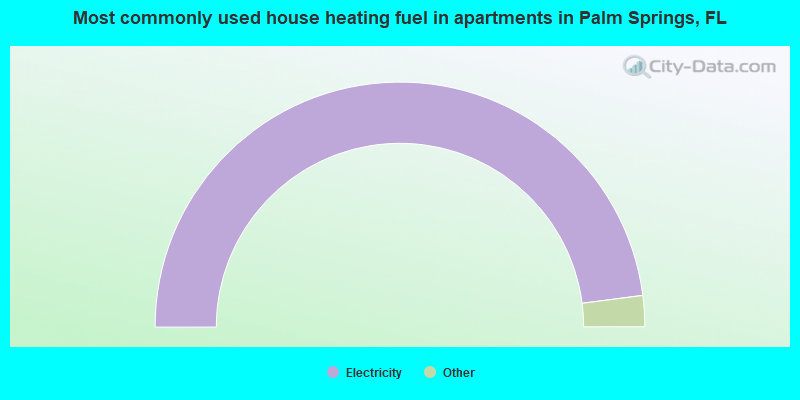
House heating fuel used in apartments - Utility gas (%)
House heating fuel used in apartments - Bottled, tank, or LP gas (%)
House heating fuel used in apartments - Electricity (%)
House heating fuel used in apartments - Fuel oil, kerosene, etc. (%)
House heating fuel used in apartments - Coal or coke (%)
House heating fuel used in apartments - Wood (%)
House heating fuel used in apartments - Solar energy (%)
House heating fuel used in apartments - Other fuel (%)
House heating fuel used in apartments - No fuel used (%)
Median year house/condo built: 1976Median year apartment built: 1977Household type by relationship:
Households: 27,114
Male householders: 4,244 (716 living alone ), Female householders: 4,695 (1,176 living alone )3,441 spouses (3,439 opposite-sex spouses ), 1,093 unmarried partners , (1,077 opposite-sex unmarried partners ), 8,876 children (8,539 natural , 41 adopted , 295 stepchildren ), 599 grandchildren , 821 brothers or sisters , 826 parents , 0 foster children , 1,313 other relatives , 1,048 non-relatives In group quarters: 154
Size of family households: 2,205 2-persons , 1,671 3-persons , 1,220 4-persons , 767 5-persons , 250 6-persons , 229 7-or-more-persons .
Size of nonfamily households: 1,946 1-person , 671 2-persons , 44 3-persons , 20 4-persons , 46 5-persons .
2,989 married couples with children. single-parent households (616 men , 1,833 women ).
28.6% of residents of Palm Springs speak English at home. of residents speak Spanish at home (39% speak English very well , 17% speak English well , 26% speak English not well , 17% don't speak English at all ).of residents speak other Indo-European language at home (53% speak English very well , 31% speak English well , 14% speak English not well , 2% don't speak English at all ).of residents speak Asian or Pacific Island language at home (56% speak English very well , 37% speak English well , 7% speak English not well ).of residents speak other language at home (21% speak English very well , 40% speak English not well , 39% don't speak English at all ).
Foreign born population: 13,872 (51.2%)of them are naturalized citizens )
Median number of rooms in houses and condos:
Median number of rooms in apartments
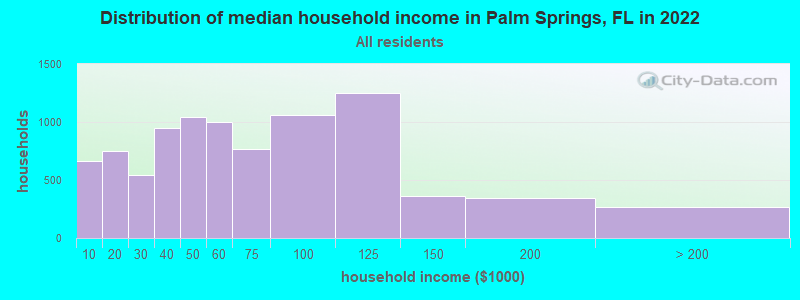
Palm Springs, FL household income distribution 660 Less than $10,000753 $10,000 to $19,999546 $20,000 to $29,999950 $30,000 to $39,9991,042 $40,000 to $49,9991,004 $50,000 to $59,999767 $60,000 to $74,9991,058 $75,000 to $99,9991,250 $100,000 to $124,999360 $125,000 to $149,999345 $150,000 to $199,999265 $200,000 or more
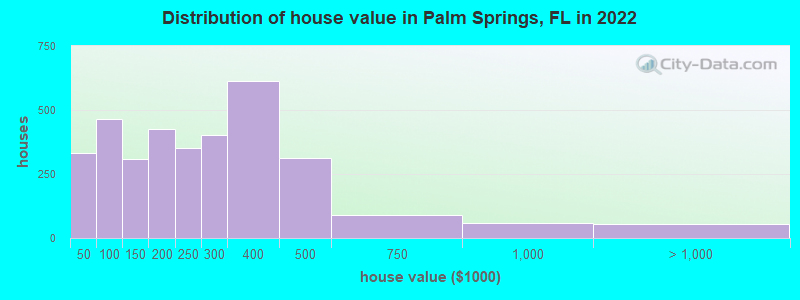
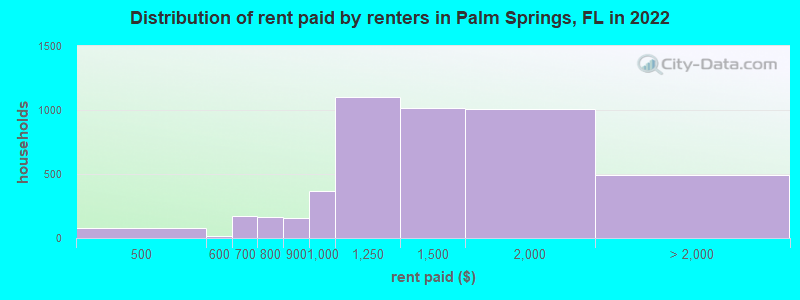
Home value of owner - occupied houses in 2022 in Palm Springs, FL 90 $10,000 to $14,99926 $15,000 to $19,99915 $25,000 to $29,99994 $35,000 to $39,999104 $40,000 to $49,99979 $50,000 to $59,99919 $60,000 to $69,99957 $70,000 to $79,999109 $80,000 to $89,99994 $90,000 to $99,999241 $100,000 to $124,99965 $125,000 to $149,999174 $150,000 to $174,999251 $175,000 to $199,999349 $200,000 to $249,999403 $250,000 to $299,999611 $300,000 to $399,999314 $400,000 to $499,99989 $500,000 to $749,99959 $750,000 to $999,99929 $1,000,000 to $1,499,99924 $1,500,000 to $1,999,999Rent paid by renters in 2022 in Palm Springs, FL 5 $250 to $29930 $400 to $44944 $450 to $4998 $500 to $5498 $550 to $599156 $600 to $64912 $650 to $69926 $700 to $749137 $750 to $799156 $800 to $899365 $900 to $9991,100 $1,000 to $1,2491,018 $1,250 to $1,4991,007 $1,500 to $1,999243 $2,000 to $2,49914 $2,500 to $2,99937 $3,000 to $3,49955 $3,500 or more140 No cash rent
Percentage of workers working in this county: 92.5%Number of people working at home: 780 (5.5% of all workers )
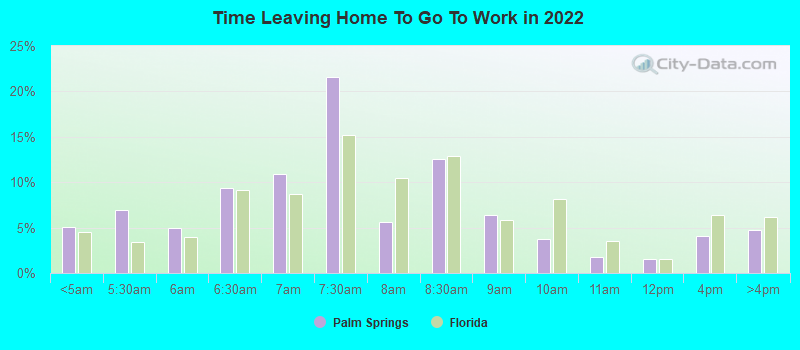
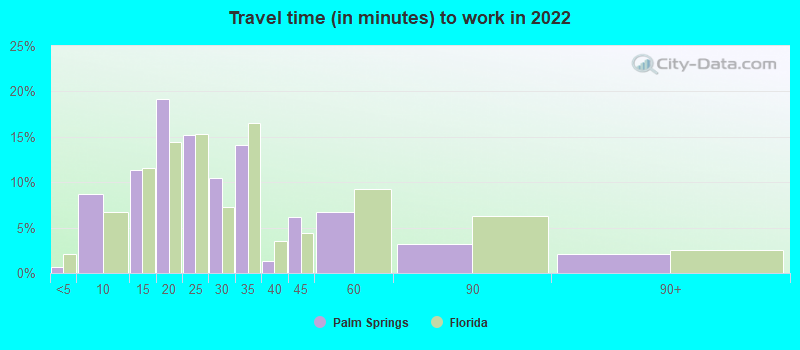
Travel time to work (commute)
Less than 5 minutes: 945 to 9 minutes: 64510 to 14 minutes: 1,14815 to 19 minutes: 1,88920 to 24 minutes: 2,11525 to 29 minutes: 1,62030 to 34 minutes: 2,59235 to 39 minutes: 51840 to 44 minutes: 42045 to 59 minutes: 92260 to 89 minutes: 59290 or more minutes: 505
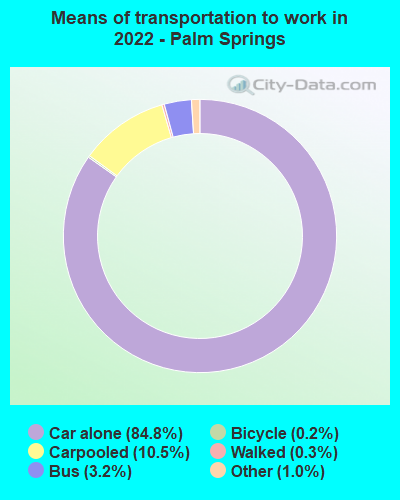
Means of transportation to work:
Drove a car alone: 8,036 (77.4%)Carpooled: 939 (9.0%)Bus : 220 (2.1%)Taxi: 119 (1.1%)Bicycle: 18 (0.2%)Walked: 34 (0.3%)Worked at home: 780 (7.5%)
Unemployment by race in 2022
Unemployment rate for White non-Hispanic residents 2.6% Males15.7% FemalesUnemployment rate for Black residents 2.6% Males13.6% FemalesUnemployment rate for Asian residents 3.4% MalesUnemployment rate for other race residents 3.3% Males1.7% FemalesUnemployment rate for two or more race residents 6.8% Males0.5% FemalesUnemployment rate for Hispanic or Latino residents 3.6% Males3.2% Females
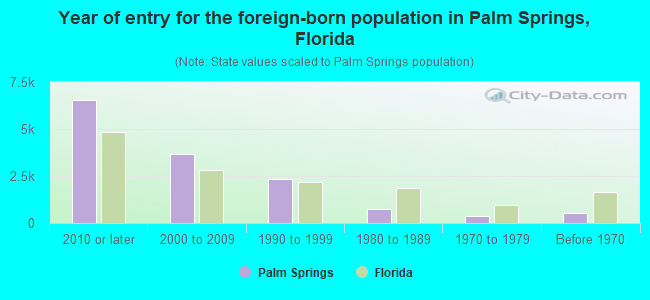
Year of entry for the foreign-born population in Palm Springs, Florida
6,568 2010 or later 3,657 2000 to 2009 2,366 1990 to 1999 730 1980 to 1989 369 1970 to 1979 557 Before 1970
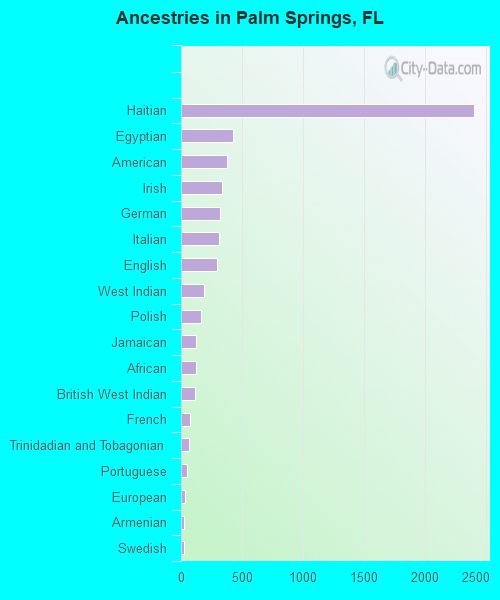
First ancestries reported:
Haitian: 2,406 (12.1%)
Egyptian: 430 (2.2%)
American: 377 (1.9%)
Irish: 338 (1.7%)
German: 322 (1.6%)
Italian: 309 (1.5%)
English: 292 (1.5%)
West Indian: 190 (1.0%)
Polish: 160 (0.8%)
Jamaican: 123 (0.6%)
African: 119 (0.6%)
British West Indian: 114 (0.6%)
French: 75 (0.4%)
Trinidadian and Tobagonian: 66 (0.3%)
Portuguese: 47 (0.2%)
European: 36 (0.2%)
Armenian: 25 (0.1%)
Swedish: 25 (0.1%)
Slovak: 20 (0.1%)
Eastern European: 14 (0.07%)
Romanian: 14 (0.07%)
Dutch: 13 (0.07%)
Scottish: 12 (0.06%)
French Canadian: 11 (0.06%)
Russian: 11 (0.06%)
Nigerian: 9 (0.05%)
Ukrainian: 9 (0.05%)
Arab: 6 (0.03%)
Iranian: 6 (0.03%)
Guyanese: 5 (0.03%)
Bahamian: 5 (0.03%)
Lithuanian: 5 (0.03%)
Macedonian: 4 (0.02%)
British: 3 (0.02%) Most common places of birth for foreign-born residents (%): Cuba Palm Springs:
29.5% (4,090)Florida:
22.0% (1,006,576)
Haiti Palm Springs:
13.5% (1,869)Florida:
7.5% (342,375)
Guatemala Palm Springs:
11.9% (1,648)Florida:
2.1% (97,632)
Nicaragua Palm Springs:
7.5% (1,034)Florida:
2.3% (105,066)
Mexico Palm Springs:
6.3% (875)Florida:
5.6% (257,152)
Honduras Palm Springs:
5.2% (726)Florida:
2.3% (107,160)
Colombia Palm Springs:
4.5% (623)Florida:
6.5% (298,669)
Dominican Republic Palm Springs:
3.5% (492)Florida:
3.0% (137,727)
El Salvador Palm Springs:
3.3% (455)Florida:
1.1% (49,838)
Peru Palm Springs:
2.7% (380)Florida:
2.1% (96,693)
Bangladesh Palm Springs:
2.5% (343)Florida:
0.3% (13,053)
Ecuador Palm Springs:
1.9% (261)Florida:
1.2% (54,585)
Egypt Palm Springs:
1.8% (252)Florida:
0.3% (13,998)
Place of birth for U.S.-born residents:
This state: 7,872Other state: 4,152Northeast: 1,661Midwest: 845South: 1,274West: 345 86.2% of Palm Springs residents lived in the same house 1 years ago.
Out of people who lived in different houses, 42.6% lived in this county.
Out of people who lived in different counties, 68.5% lived in Florida.
Palm Springs:
86.2%State average:
86.3%
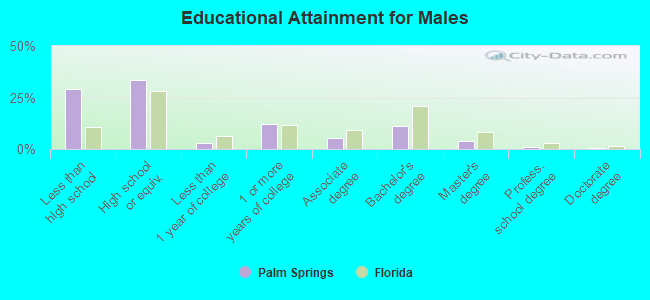
Education attainment for males 25 years and older:
No schooling: 749Nursery to 4th grade: 1465th and 6th grade: 6657th and 8th grade: 1279th grade: 36010th grade: 14911th grade: 12512th grade, no diploma: 395High school graduate (or equivalency): 3,101Less than 1 year of college: 292Some college more than 1 year, no degree: 1,116Associate degree: 509Bachelor's degree: 1,036Master's degree: 382Professional school degree: 79Doctorate degree: 31
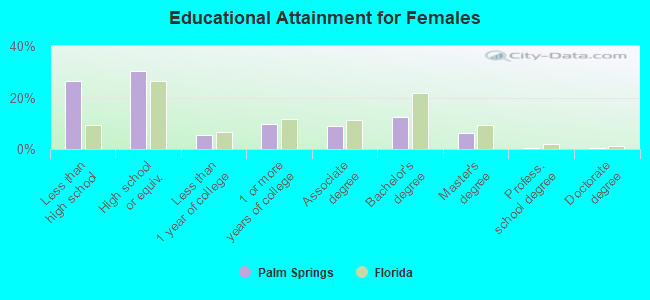
Education attainment for females 25 years and older:
No schooling: 293Nursery to 4th grade: 1975th and 6th grade: 3627th and 8th grade: 2779th grade: 21810th grade: 21111th grade: 14812th grade, no diploma: 597High school graduate (or equivalency): 2,674Less than 1 year of college: 475Some college more than 1 year, no degree: 867Associate degree: 777Bachelor's degree: 1,089Master's degree: 531Professional school degree: 18Doctorate degree: 44
Housing units in structures:
One, detached: 2,913One, attached: 1,398Two: 7033 or 4: 8725 to 9: 58810 to 19: 74520 to 49: 1,24550 or more: 1,421Mobile homes: 305Housing units lacking complete plumbing facilities in 2022: 0.4%Housing units lacking complete kitchen facilities in 2022: 1.3%House/condo owner moved in on average 8 years ago
Renter moved in on average 2 years ago
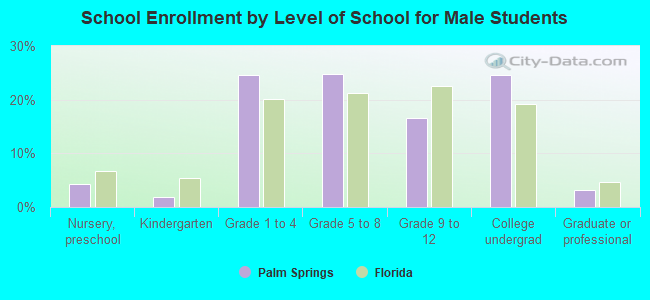
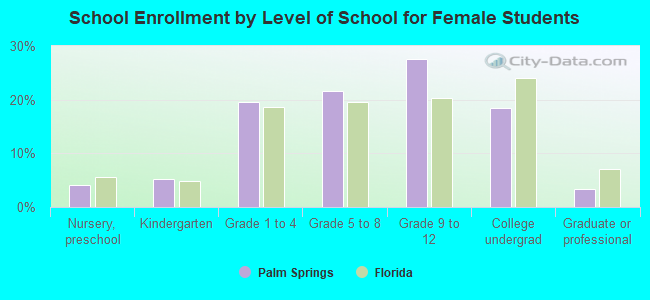
Private vs. public school enrollment:
Students in private schools in grades 1 to 8 (elementary and middle school): 315 Students in private schools in grades 9 to 12 (high school): 89 Students in private undergraduate colleges: 203