Housing density: 1,537 houses/condos per square mile
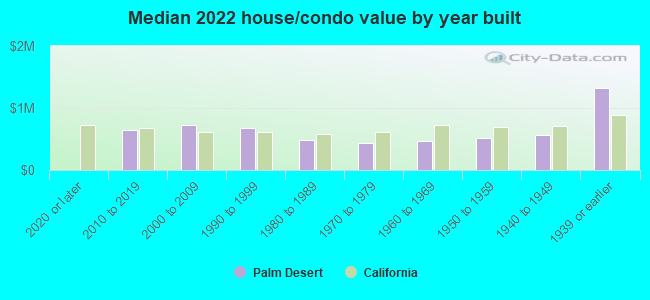
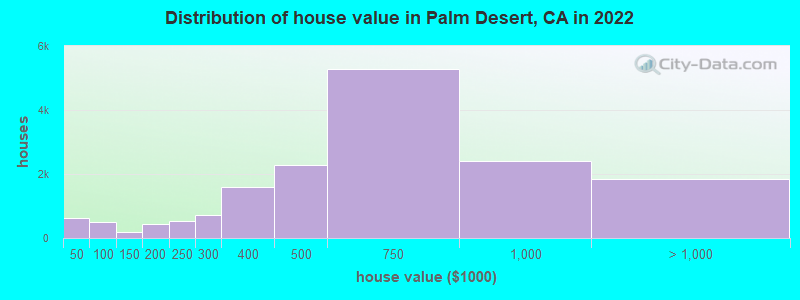
Median price asked for vacant for-sale houses and condos in 2022: $840,523.
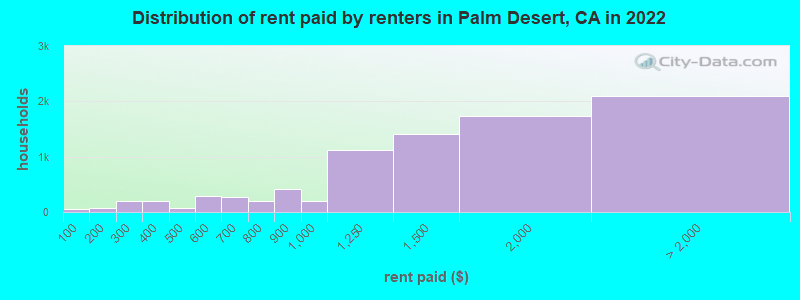
Median contract rent in 2022: $1,440 (lower quartile is $1,022, upper quartile is $1,937)
Median rent asked for vacant for-rent units in 2022: $3,316
Median gross rent in Palm Desert, CA in 2022: $1,611
Housing units in Palm Desert with a mortgage: 8,628 (705 second mortgage, 26 home equity loan, 543 both second mortgage and home equity loan) Houses without a mortgage: 101
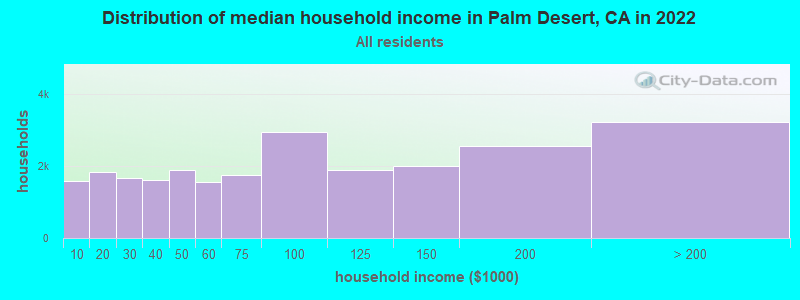
Median household income for houses/condos with a mortgage: $117,970
Median household income for apartments without a mortgage: $70,585
3,828 married couples with children.
2,916 single-parent households (634 men, 2,282 women).
76.4% of residents of Palm Desert speak English at home.
17.3% of residents speak Spanish at home (77% speak English very well, 12% speak English well, 9% speak English not well, 2% don't speak English at all).
3.0% of residents speak other Indo-European language at home (83% speak English very well, 11% speak English well, 6% speak English not well).
3.2% of residents speak Asian or Pacific Island language at home (55% speak English very well, 34% speak English well, 8% speak English not well, 4% don't speak English at all).
0.7% of residents speak other language at home (58% speak English very well, 39% speak English well, 4% don't speak English at all).
Foreign born population: 8,879 (17.0%)
(62.3% of them are naturalized citizens)
Percentage of workers working in this county: 94.6% Number of people working at home: 3,620 (16.9% of all workers)
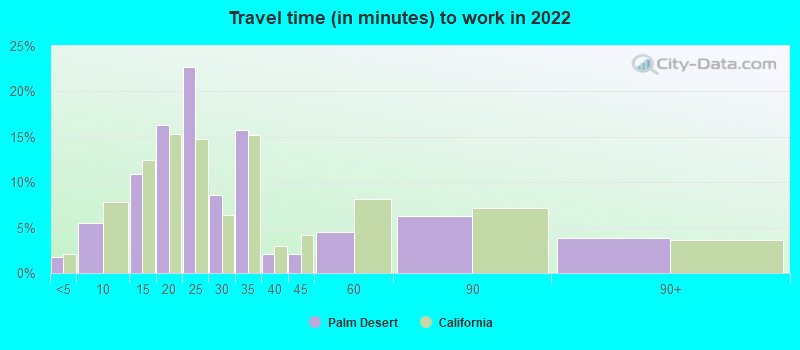
Travel time to work (commute)
Less than 5 minutes: 520
5 to 9 minutes: 1,943
10 to 14 minutes: 3,230
15 to 19 minutes: 4,233
20 to 24 minutes: 3,661
25 to 29 minutes: 783
30 to 34 minutes: 1,791
35 to 39 minutes: 393
40 to 44 minutes: 102
45 to 59 minutes: 464
60 to 89 minutes: 361
90 or more minutes: 541
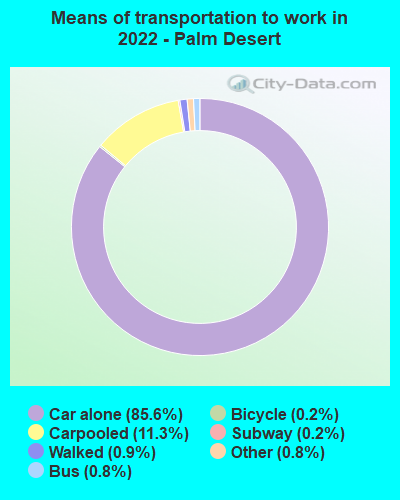
Means of transportation to work:
Drove a car alone: 29,398 (75.9%)
Carpooled: 4,218 (10.9%)
Bus: 261 (0.7%)
Subway or elevated rail: 3 (0.0%)
Long-distance train or commuter rail: 53 (0.1%)
Ferryboat: 8 (0.0%)
Taxi: 297 (0.8%)
Bicycle: 109 (0.3%)
Walked: 303 (0.8%)
Worked at home: 3,620 (9.3%)
Unemployment by race in 2022
Unemployment rate for White non-Hispanic residents
4.1%Males
6.3%Females
Unemployment rate for Black residents
11.9%Males
13.2%Females
Unemployment rate for American Indian and Alaska Native residents
9.4%Females
Unemployment rate for Asian residents
1.9%Males
14.8%Females
Unemployment rate for other race residents
10.9%Males
0.2%Females
Unemployment rate for two or more race residents
1.5%Males
2.9%Females
Unemployment rate for Hispanic or Latino residents
6.9%Males
1.7%Females
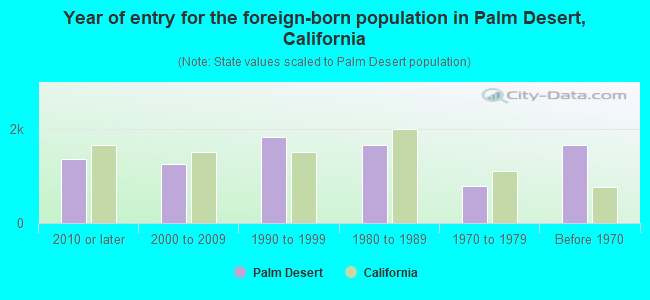
Year of entry for the foreign-born population in Palm Desert, California
1,3702010 or later
1,2612000 to 2009
1,8291990 to 1999
1,6651980 to 1989
7791970 to 1979
1,669Before 1970
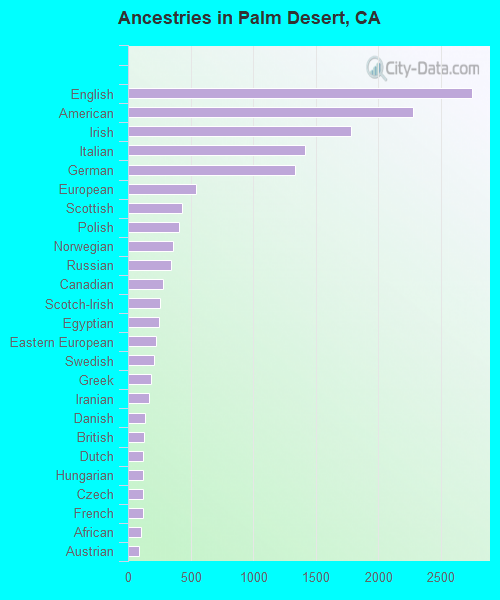
First ancestries reported:
English: 2,747 (9.6%)
American: 2,279 (8.0%)
Irish: 1,781 (6.2%)
Italian: 1,413 (4.9%)
German: 1,335 (4.7%)
European: 543 (1.9%)
Scottish: 433 (1.5%)
Polish: 409 (1.4%)
Norwegian: 358 (1.3%)
Russian: 340 (1.2%)
Canadian: 276 (1.0%)
Scotch-Irish: 252 (0.9%)
Egyptian: 246 (0.9%)
Eastern European: 222 (0.8%)
Swedish: 207 (0.7%)
Greek: 181 (0.6%)
Iranian: 167 (0.6%)
Danish: 134 (0.5%)
British: 128 (0.4%)
Dutch: 123 (0.4%)
Hungarian: 118 (0.4%)
Czech: 117 (0.4%)
French: 117 (0.4%)
African: 104 (0.4%)
Austrian: 86 (0.3%)
Scandinavian: 85 (0.3%)
Yugoslavian: 81 (0.3%)
Bulgarian: 80 (0.3%)
Turkish: 72 (0.3%)
Ukrainian: 68 (0.2%)
Romanian: 66 (0.2%)
Albanian: 55 (0.2%)
French Canadian: 50 (0.2%)
Trinidadian and Tobagonian: 48 (0.2%)
Croatian: 47 (0.2%)
Welsh: 44 (0.2%)
Finnish: 40 (0.1%)
Armenian: 38 (0.1%)
Jordanian: 35 (0.1%)
Portuguese: 31 (0.1%)
Swiss: 29 (0.1%)
Palestinian: 27 (0.09%)
Macedonian: 23 (0.08%)
Northern European: 20 (0.07%)
Belgian: 19 (0.07%)
West Indian: 19 (0.07%)
Brazilian: 16 (0.06%)
Lithuanian: 15 (0.05%)
Lebanese: 12 (0.04%)
Slavic: 12 (0.04%)
Australian: 11 (0.04%)
Cypriot: 9 (0.03%)
Serbian: 9 (0.03%)
Latvian: 8 (0.03%)
Slovene: 7 (0.02%)
Basque: 5 (0.02%)
Czechoslovakian: 3 (0.01%)
Slovak: 2 (0.01%)
Most common places of birth for foreign-born residents (%):
Mexico
Palm Desert:
33.8% (3,004)
California:
37.2% (3,881,193)
Canada
Palm Desert:
14.7% (1,307)
California:
1.2% (127,477)
Philippines
Palm Desert:
5.1% (451)
California:
7.8% (818,297)
England
Palm Desert:
2.5% (219)
California:
0.6% (57,953)
India
Palm Desert:
2.3% (201)
California:
5.2% (539,184)
United Kingdom, excluding England and Scotland
Palm Desert:
2.3% (200)
California:
0.6% (60,582)
Egypt
Palm Desert:
2.2% (196)
California:
0.4% (42,718)
Germany
Palm Desert:
2.0% (182)
California:
0.7% (73,304)
Vietnam
Palm Desert:
1.8% (164)
California:
4.9% (512,335)
China, excluding Hong Kong and Taiwan
Palm Desert:
1.8% (156)
California:
6.6% (684,672)
Cuba
Palm Desert:
1.8% (156)
California:
0.3% (30,441)
Peru
Palm Desert:
1.7% (155)
California:
0.7% (74,025)
Iran
Palm Desert:
1.5% (136)
California:
2.0% (206,004)
Place of birth for U.S.-born residents:
This state: 24,560
Other state: 17,235
Northeast: 4,359
Midwest: 6,203
South: 2,919
West: 3,800
86.5% of Palm Desert residents lived in the same house 1 years ago. Out of people who lived in different houses, 33.5% lived in this county. Out of people who lived in different counties, 54.2% lived in California.
Palm Desert:
86.5%
State average:
88.9%
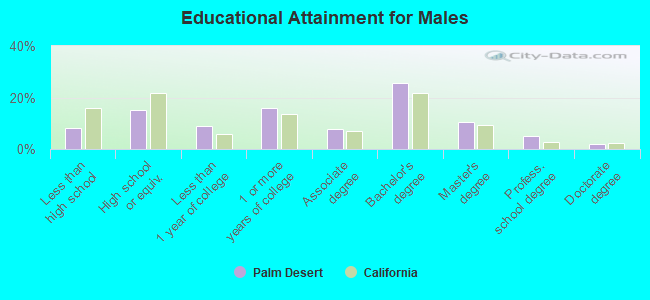
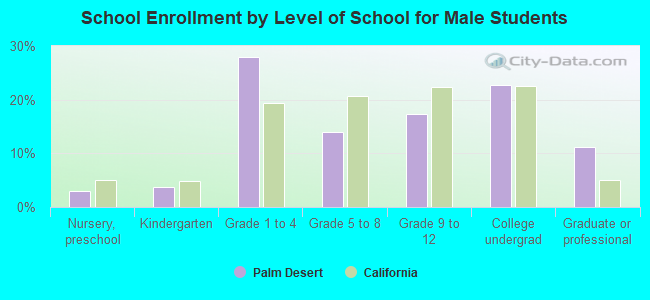
Education attainment for males 25 years and older:
No schooling: 337
Nursery to 4th grade: 36
5th and 6th grade: 213
7th and 8th grade: 149
9th grade: 90
10th grade: 214
11th grade: 29
12th grade, no diploma: 573
High school graduate (or equivalency): 3,028
Less than 1 year of college: 1,790
Some college more than 1 year, no degree: 3,190
Associate degree: 1,579
Bachelor's degree: 5,092
Master's degree: 2,117
Professional school degree: 989
Doctorate degree: 410
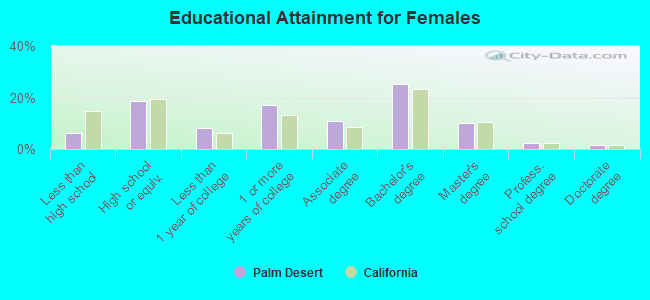
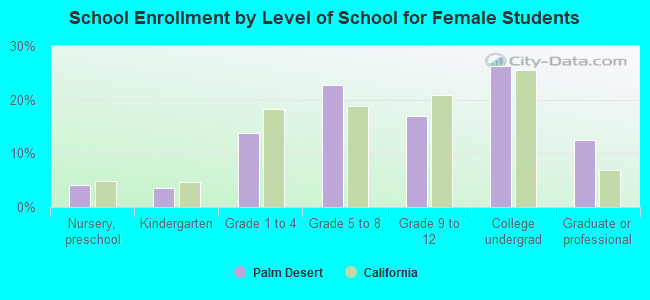
Education attainment for females 25 years and older:
No schooling: 241
Nursery to 4th grade: 37
5th and 6th grade: 82
7th and 8th grade: 131
9th grade: 92
10th grade: 119
11th grade: 158
12th grade, no diploma: 529
High school graduate (or equivalency): 4,198
Less than 1 year of college: 1,820
Some college more than 1 year, no degree: 3,877
Associate degree: 2,410
Bachelor's degree: 5,711
Master's degree: 2,230
Professional school degree: 525
Doctorate degree: 325
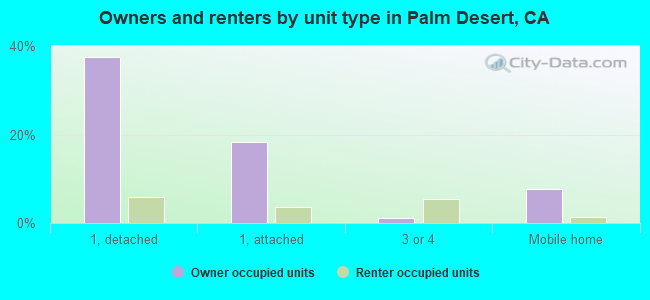
Housing units in structures:
One, detached: 14,524
One, attached: 10,078
Two: 1,143
3 or 4: 2,084
5 to 9: 1,687
10 to 19: 1,767
20 to 49: 714
50 or more: 2,137
Mobile homes: 3,312
Boats, RVs, vans, etc.: 13
Median worth of mobile homes: $285,301
Housing units lacking complete plumbing facilities in 2022: 0.1%
Housing units lacking complete kitchen facilities in 2022: 1.1%