Pace, FL (Florida) Houses and Residents
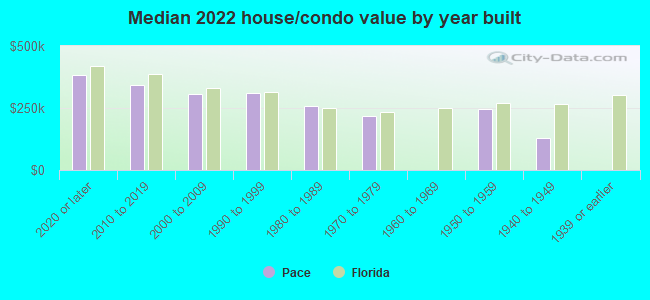
Estimated median house or condo value in 2022: $289,306 (it was $82,500 in 2000 )
Pace:
$289,306Florida:
$354,100
Lower value quartile - upper value quartile: $195,861 - $394,543Mean price in 2022: Detached houses: $253,271 Here:
$253,271State:
$500,941
Townhouses or other attached units: $211,075 Here:
$211,075State:
$370,869
In 5-or-more-unit structures: $240,572 Here:
$240,572State:
$447,145
Mobile homes: $116,990 Here:
$116,990State:
$113,202
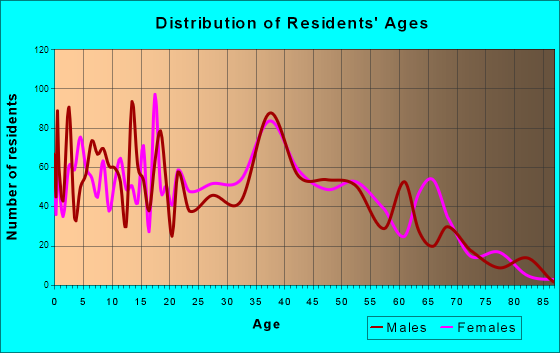
Total population: 20,039 (Urban population: 6,922, Rural population: 634 (all nonfarm) )
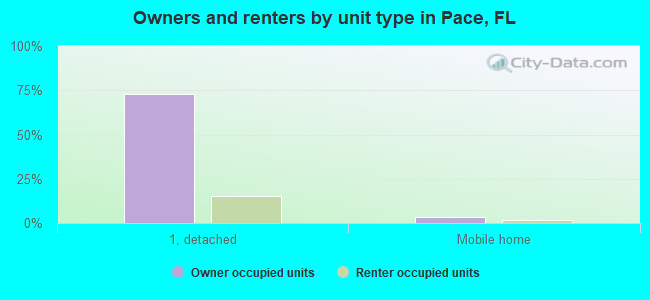
Houses: 9,903 (9,451 occupied: 7,975 owner occupied, 1,552 renter occupied )
% of renters here:
16%State:
33%
Housing density: 1,056 houses/condos per square mile
Median price asked for vacant for-sale houses and condos in 2022 in this county: $301,839.
Median contract rent in 2022: $938 (lower quartile is $591, upper quartile is $1,598)
Median rent asked for vacant for-rent units in 2022: $2,055
Median gross rent in Pace, FL in 2022: $1,226
Housing units in Pace with a mortgage: 5,083 (335 second mortgage, 0 home equity loan, 294 both second mortgage and home equity loan )Houses without a mortgage: 136
Median household income for houses/condos with a mortgage: $98,739
Median household income for apartments without a mortgage: $71,519
Median monthly housing costs: $1,182
Data:
Median house or condo value ($)
Median house or condo value ($ change since 2000)
Median house or condo value ($) - White
Median house or condo value ($) - Black or African American
Median house or condo value ($) - Asian
Median house or condo value ($) - Hispanic or Latino
Median house or condo value ($) - American Indian and Alaska Native
Median house or condo value ($) - Multirace
Median house or condo value ($) - Other Race
Median price asked for mobile homes ($)
Household density (households per square mile)
Mean house or condo value by units in structure - 1, detached ($)
Mean house or condo value by units in structure - 1, attached ($)
Mean house or condo value by units in structure - 2 ($)
Mean house or condo value by units in structure by units in structure - 3 or 4 ($)
Mean house or condo value by units in structure - 5 or more ($)
Mean house or condo value by units in structure - Boat, RV, van, etc. ($)
Mean house or condo value by units in structure - Mobile home ($)
Median contract rent ($)
Median contract rent - Lower quartile ($)
Median contract rent - Upper quartile ($)
Median gross rent ($)
Urban houses (%)
Rural houses (%)
Houses occupied (%)
Houses occupied (% change since 2000)
Houses owner occupied (%)
Houses owner occupied (% change since 2000)
Houses renter occupied (%)
Houses renter occupied (% change since 2000)
Vacant housing units - For rent (%)
Vacant housing units - For rent (% change since 2000)
Vacant housing units - For sale only (%)
Vacant housing units - For sale only (% change since 2000)
Vacant housing units - Rented or sold, not occupied (%)
Vacant housing units - Rented or sold, not occupied (% change since 2000)
Vacant housing units - For seasonal, recreational, or occasional use (%)
Vacant housing units - For seasonal, recreational, or occasional use (% change since 2000)
Vacant housing units - For migrant workers (%)
Vacant housing units - For migrant workers (% change since 2000)
Vacant housing units - Other vacant (%)
Vacant housing units - Other vacant (% change since 2000)
Median monthly housing costs ($)
Median household income for houses/condos with a mortgage ($)
Median household income for houses/condos without a mortgage ($)
Median household income ($)
Median household income ($) - White
Median household income ($) - Black or African American
Median household income ($) - Asian
Median household income ($) - Hispanic or Latino
Median household income ($) - American Indian and Alaska Native
Median household income ($) - Multirace
Median household income ($) - Other Race
Mortgage status - with mortgage (%)
Mortgage status - with second mortgage (%)
Mortgage status - with home equity loan (%)
Mortgage status - with both second mortgage and home equity loan (%)
Mortgage status - without a mortgage (%)
Median year house/condo built
Median year apartment built
Household type by relationship - Male householder living alone (%)
Household type by relationship - Male householder not living alone (%)
Household type by relationship - Female householder living alone (%)
Household type by relationship - Female householder not living alone (%)
Household type by relationship - Opposite-Sex spouse (%)
Household type by relationship - Same-Sex spouse (%)
Household type by relationship - Opposite-Sex unmarried partner (%)
Household type by relationship - Same-Sex unmarried partner (%)
Household type by relationship - In group quarters (%)
Size of family households - 2-person household (%)
Size of family households - 3-person household (%)
Size of family households - 4-person household (%)
Size of family households - 5-person household (%)
Size of family households - 6-person household (%)
Size of family households - 7-or-more-person household (%)
Size of nonfamily households - 1-person household (%)
Size of nonfamily households - 2-person household (%)
Size of nonfamily households - 3-person household (%)
Size of nonfamily households - 4-person household (%)
Size of nonfamily households - 5-person household (%)
Size of nonfamily households - 6-person household (%)
Size of nonfamily households - 7-or-moreperson household (%)
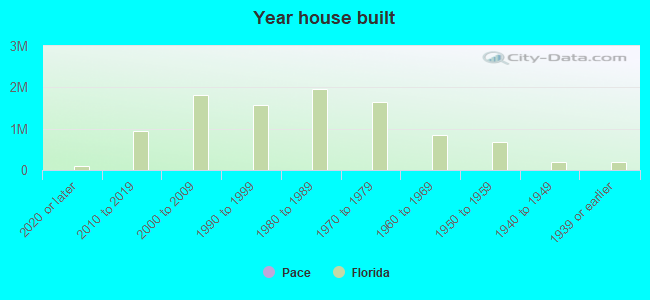
Year house built - Built 2010 or later (%)
Year house built - Built 2000 to 2009 (%)
Year house built - Built 1990 to 1999 (%)
Year house built - Built 1980 to 1989 (%)
Year house built - Built 1970 to 1979 (%)
Year house built - Built 1960 to 1969 (%)
Year house built - Built 1950 to 1959 (%)
Year house built - Built 1940 to 1949 (%)
Year house built - Built 1939 or earlier (%)
Median number of rooms in houses and condos
Median number of rooms in apartments
Median number of bedrooms in owner occupied houses
Mean number of bedrooms in owner occupied houses
Median number of bedrooms in renter occupied houses
Mean number of bedrooms in renter occupied houses
Median number of vehichles in owner occupied houses
Mean number of vehichles in owner occupied houses
Median number of vehichles in renter occupied houses
Mean number of vehichles in renter occupied houses
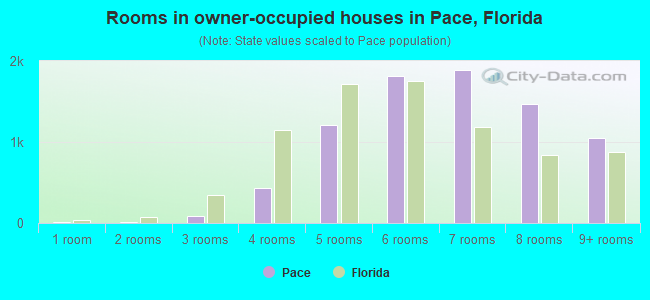
Rooms in owner-occupied houses - 1 room (%)
Rooms in owner-occupied houses - 2 rooms (%)
Rooms in owner-occupied houses - 3 rooms (%)
Rooms in owner-occupied houses - 4 rooms (%)
Rooms in owner-occupied houses - 5 rooms (%)
Rooms in owner-occupied houses - 6 rooms (%)
Rooms in owner-occupied houses - 7 rooms (%)
Rooms in owner-occupied houses - 8 rooms (%)
Rooms in owner-occupied houses - 9+ rooms (%)
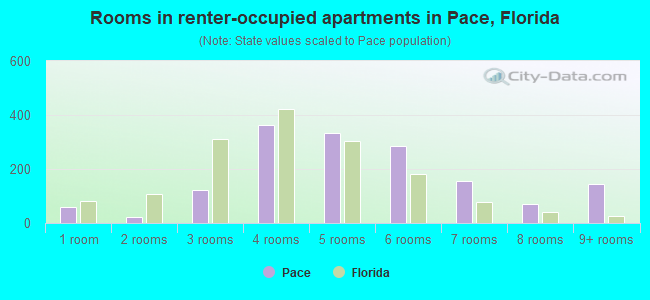
Rooms in renter-occupied houses - 1 room (%)
Rooms in renter-occupied houses - 2 rooms (%)
Rooms in renter-occupied houses - 3 rooms (%)
Rooms in renter-occupied houses - 4 rooms (%)
Rooms in renter-occupied houses - 5 rooms (%)
Rooms in renter-occupied houses - 6 rooms (%)
Rooms in renter-occupied houses - 7 rooms (%)
Rooms in renter-occupied houses - 8 rooms (%)
Rooms in renter-occupied houses - 9+ rooms (%)
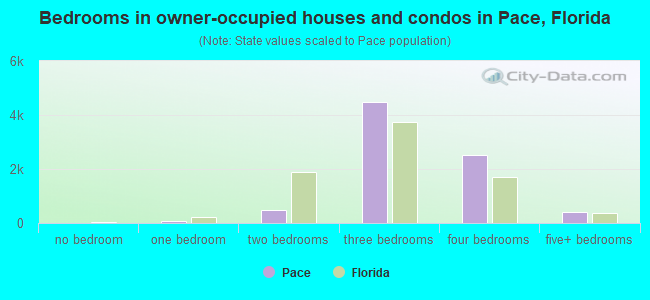
Bedrooms in owner-occupied houses - no bedrooms (%)
Bedrooms in owner-occupied houses - 1 bedroom (%)
Bedrooms in owner-occupied houses - 2 bedrooms (%)
Bedrooms in owner-occupied houses - 3 bedrooms (%)
Bedrooms in owner-occupied houses - 4 bedrooms (%)
Bedrooms in owner-occupied houses - 5+ bedrooms (%)
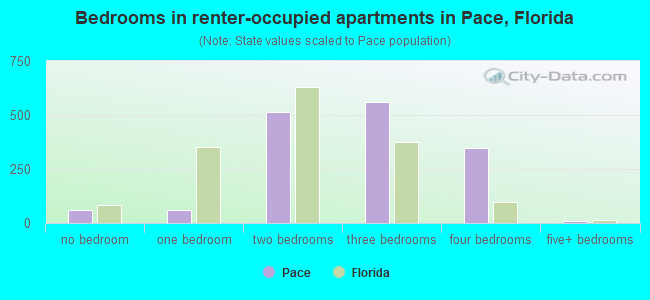
Bedrooms in renter-occupied houses - no bedrooms (%)
Bedrooms in renter-occupied houses - 1 bedroom (%)
Bedrooms in renter-occupied houses - 2 bedrooms (%)
Bedrooms in renter-occupied houses - 3 bedrooms (%)
Bedrooms in renter-occupied houses - 4 bedrooms (%)
Bedrooms in renter-occupied houses - 5+ bedrooms (%)
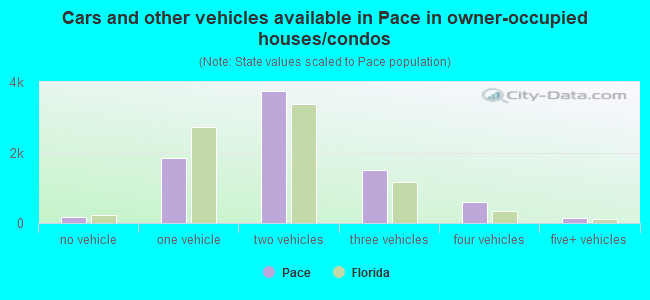
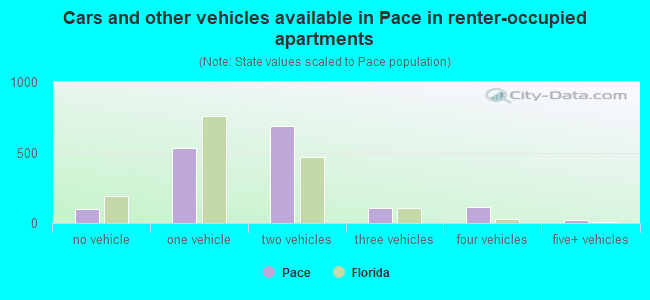
Vehicles available in owner-occupied houses - no vehicle available (%)
Vehicles available in owner-occupied houses - 1 vehicle available(%)
Vehicles available in owner-occupied houses - 2 Vehicles available (%)
Vehicles available in owner-occupied houses - 3 Vehicles available (%)
Vehicles available in owner-occupied houses - 4 Vehicles available (%)
Vehicles available in owner-occupied houses - 5+ Vehicles available (%)
Vehicles available in renter-occupied houses - no vehicle available (%)
Vehicles available in renter-occupied houses - 1 vehicle available (%)
Vehicles available in renter-occupied houses - 2 Vehicles available (%)
Vehicles available in renter-occupied houses - 3 Vehicles available (%)
Vehicles available in renter-occupied houses - 4 Vehicles available (%)
Vehicles available in renter-occupied houses - 5+ Vehicles available (%)
Housing units in structures - 1, detached (%)
Housing units in structures - 1, attached (%)
Housing units in structures - 2 (%)
Housing units in structures - 3 or 4 (%)
Housing units in structures - 5 to 9 (%)
Housing units in structures - 10 to 19 (%)
Housing units in structures - 20 to 49 (%)
Housing units in structures - 50 or more (%)
Housing units in structures - Mobile home (%)
Housing units in structures - Boat, RV, van, etc. (%)
Housing units in structures - Owners - 1, detached (%)
Housing units in structures - Owners - 1, attached (%)
Housing units in structures - Owners - 2 (%)
Housing units in structures - Owners - 3 or 4 (%)
Housing units in structures - Owners - 5 to 9 (%)
Housing units in structures - Owners - 10 to 19 (%)
Housing units in structures - Owners - 20 to 49 (%)
Housing units in structures - Owners - 50 or more (%)
Housing units in structures - Owners - Mobile home (%)
Housing units in structures - Owners - Boat, RV, van, etc. (%)
Housing units in structures - Renters - 1, detached (%)
Housing units in structures - Renters - 1, attached (%)
Housing units in structures - Renters - 2 (%)
Housing units in structures - Renters - 3 or 4 (%)
Housing units in structures - Renters - 5 to 9 (%)
Housing units in structures - Renters - 10 to 19 (%)
Housing units in structures - Renters - 20 to 49 (%)
Housing units in structures - Renters - 50 or more (%)
Housing units in structures - Renters - Mobile home (%)
Housing units in structures - Renters - Boat, RV, van, etc. (%)
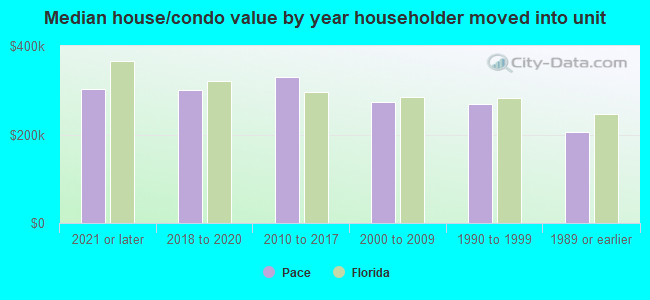
House/condo owner moved in on average (years ago)
Renter moved in on average (years ago)
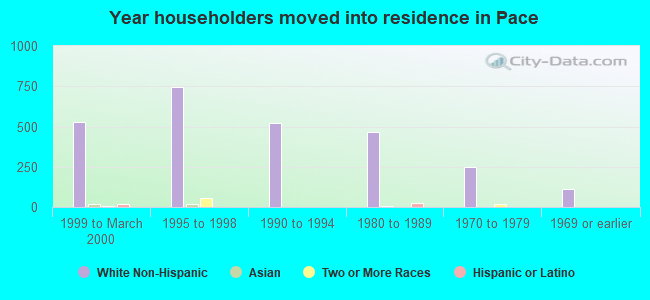
Year householder moved into unit - Moved in 1999 to March 2000 (%)
Year householder moved into unit - Moved in 1999 to March 2000 (%) - White
Year householder moved into unit - Moved in 1999 to March 2000 (%) - Black or African American
Year householder moved into unit - Moved in 1999 to March 2000 (%) - Asian
Year householder moved into unit - Moved in 1999 to March 2000 (%) - Hispanic or Latino
Year householder moved into unit - Moved in 1999 to March 2000 (%) - American Indian and Alaska Native
Year householder moved into unit - Moved in 1999 to March 2000 (%) - Multirace
Year householder moved into unit - Moved in 1999 to March 2000 (%) - Other Race
Year householder moved into unit - Moved in 1995 to 1998 (%)
Year householder moved into unit - Moved in 1995 to 1998 (%) - White
Year householder moved into unit - Moved in 1995 to 1998 (%) - Black or African American
Year householder moved into unit - Moved in 1995 to 1998 (%) - Asian
Year householder moved into unit - Moved in 1995 to 1998 (%) - Hispanic or Latino
Year householder moved into unit - Moved in 1995 to 1998 (%) - American Indian and Alaska Native
Year householder moved into unit - Moved in 1995 to 1998 (%) - Multirace
Year householder moved into unit - Moved in 1995 to 1998 (%) - Other Race
Year householder moved into unit - Moved in 1990 to 1994 (%)
Year householder moved into unit - Moved in 1990 to 1994 (%) - White
Year householder moved into unit - Moved in 1990 to 1994 (%) - Black or African American
Year householder moved into unit - Moved in 1990 to 1994 (%) - Asian
Year householder moved into unit - Moved in 1990 to 1994 (%) - Hispanic or Latino
Year householder moved into unit - Moved in 1990 to 1994 (%) - American Indian and Alaska Native
Year householder moved into unit - Moved in 1990 to 1994 (%) - Multirace
Year householder moved into unit - Moved in 1990 to 1994 (%) - Other Race
Year householder moved into unit - Moved in 1980 to 1989 (%)
Year householder moved into unit - Moved in 1980 to 1989 (%) - White
Year householder moved into unit - Moved in 1980 to 1989 (%) - Black or African American
Year householder moved into unit - Moved in 1980 to 1989 (%) - Asian
Year householder moved into unit - Moved in 1980 to 1989 (%) - Hispanic or Latino
Year householder moved into unit - Moved in 1980 to 1989 (%) - American Indian and Alaska Native
Year householder moved into unit - Moved in 1980 to 1989 (%) - Multirace
Year householder moved into unit - Moved in 1980 to 1989 (%) - Other Race
Year householder moved into unit - Moved in 1970 to 1979 (%)
Year householder moved into unit - Moved in 1970 to 1979 (%) - White
Year householder moved into unit - Moved in 1970 to 1979 (%) - Black or African American
Year householder moved into unit - Moved in 1970 to 1979 (%) - Asian
Year householder moved into unit - Moved in 1970 to 1979 (%) - Hispanic or Latino
Year householder moved into unit - Moved in 1970 to 1979 (%) - American Indian and Alaska Native
Year householder moved into unit - Moved in 1970 to 1979 (%) - Multirace
Year householder moved into unit - Moved in 1970 to 1979 (%) - Other Race
Year householder moved into unit - Moved in 1969 or earlier (%)
Year householder moved into unit - Moved in 1969 or earlier (%) - White
Year householder moved into unit - Moved in 1969 or earlier (%) - Black or African American
Year householder moved into unit - Moved in 1969 or earlier (%) - Asian
Year householder moved into unit - Moved in 1969 or earlier (%) - Hispanic or Latino
Year householder moved into unit - Moved in 1969 or earlier (%) - American Indian and Alaska Native
Year householder moved into unit - Moved in 1969 or earlier (%) - Multirace
Year householder moved into unit - Moved in 1969 or earlier (%) - Other Race
Housing units lacking complete plumbing facilities (%)
Housing units lacking complete kitchen facilities (%)
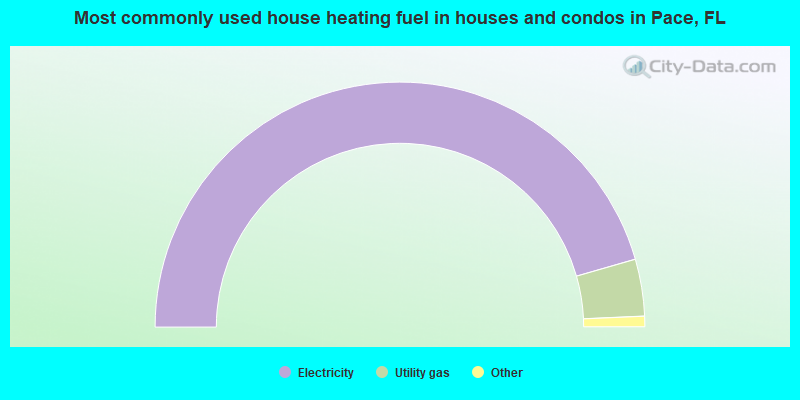
House heating fuel used in houses and condos - Utility gas (%)
House heating fuel used in houses and condos - Bottled, tank, or LP gas (%)
House heating fuel used in houses and condos - Electricity (%)
House heating fuel used in houses and condos - Fuel oil, kerosene, etc. (%)
House heating fuel used in houses and condos - Coal or coke (%)
House heating fuel used in houses and condos - Wood (%)
House heating fuel used in houses and condos - Solar energy (%)
House heating fuel used in houses and condos - Other fuel (%)
House heating fuel used in houses and condos - No fuel used (%)
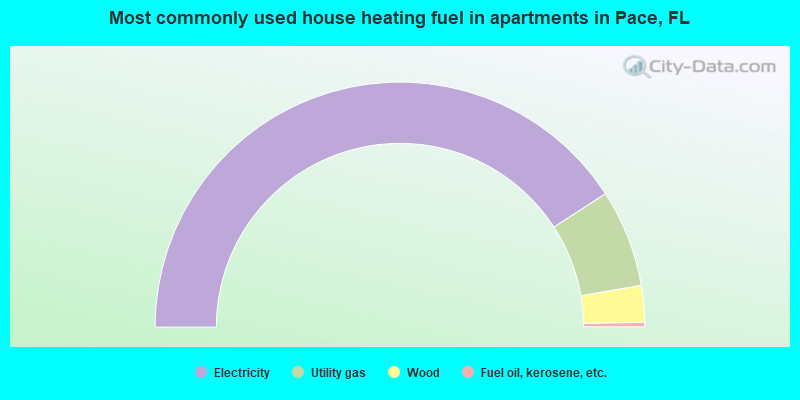
House heating fuel used in apartments - Utility gas (%)
House heating fuel used in apartments - Bottled, tank, or LP gas (%)
House heating fuel used in apartments - Electricity (%)
House heating fuel used in apartments - Fuel oil, kerosene, etc. (%)
House heating fuel used in apartments - Coal or coke (%)
House heating fuel used in apartments - Wood (%)
House heating fuel used in apartments - Solar energy (%)
House heating fuel used in apartments - Other fuel (%)
House heating fuel used in apartments - No fuel used (%)
Latest news about housing in Pace, FL collected exclusively by city-data.com from local newspapers, TV, and radio stations
Median year house/condo built: 1996Median year apartment built: 1990Household type by relationship:
Households: 26,915
Male householders: 5,118 (753 living alone ), Female householders: 4,330 (884 living alone )5,562 spouses (5,545 opposite-sex spouses ), 655 unmarried partners , (636 opposite-sex unmarried partners ), 8,417 children (7,299 natural , 292 adopted , 825 stepchildren ), 942 grandchildren , 206 brothers or sisters , 469 parents , 17 foster children , 396 other relatives , 786 non-relatives In group quarters: 11
Size of family households: 2,524 2-persons , 1,833 3-persons , 1,715 4-persons , 486 5-persons , 766 6-persons , 177 7-or-more-persons .
Size of nonfamily households: 1,828 1-person , 308 2-persons , 45 3-persons .
4,861 married couples with children. single-parent households (266 men , 1,357 women ).
93.9% of residents of Pace speak English at home. of residents speak Spanish at home (61% speak English very well , 25% speak English well , 14% speak English not well ).of residents speak other Indo-European language at home (100% speak English very well ).of residents speak Asian or Pacific Island language at home (72% speak English very well , 13% speak English well , 15% speak English not well ).of residents speak other language at home (100% speak English very well ).
Foreign born population: 1,073 (4.0%)of them are naturalized citizens )
Median number of rooms in houses and condos:
Median number of rooms in apartments
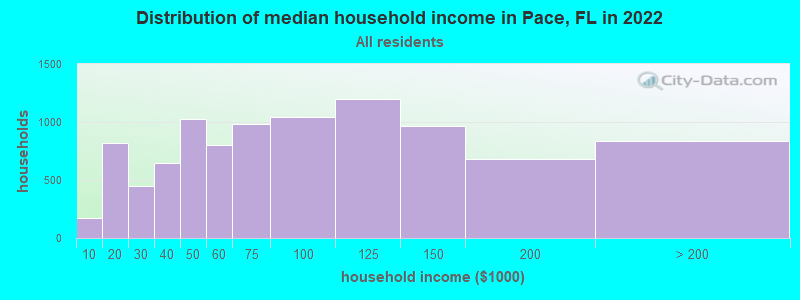
Pace, FL household income distribution 173 Less than $10,000821 $10,000 to $19,999444 $20,000 to $29,999646 $30,000 to $39,9991,030 $40,000 to $49,999803 $50,000 to $59,999984 $60,000 to $74,9991,042 $75,000 to $99,9991,202 $100,000 to $124,999962 $125,000 to $149,999678 $150,000 to $199,999834 $200,000 or more
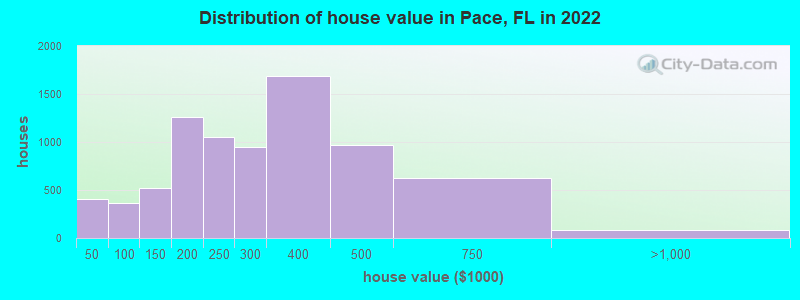
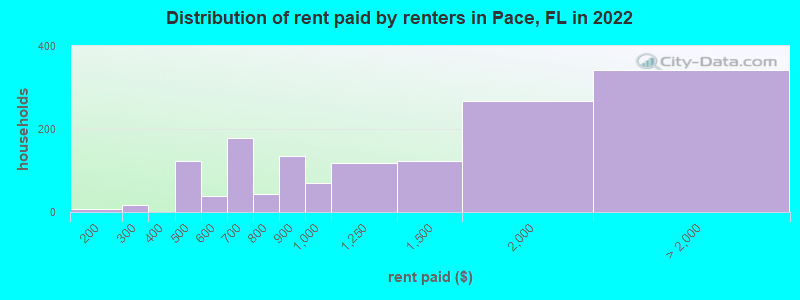
Home value of owner - occupied houses in 2022 in Pace, FL 139 Less than $10,00015 $10,000 to $14,99915 $15,000 to $19,99964 $20,000 to $24,999128 $25,000 to $29,99911 $35,000 to $39,99927 $40,000 to $49,99916 $50,000 to $59,99921 $70,000 to $79,99925 $80,000 to $89,999268 $90,000 to $99,999363 $100,000 to $124,999158 $125,000 to $149,999741 $150,000 to $174,999516 $175,000 to $199,9991,053 $200,000 to $249,999948 $250,000 to $299,9991,684 $300,000 to $399,999967 $400,000 to $499,999622 $500,000 to $749,99976 $750,000 to $999,9993 $2,000,000 or moreRent paid by renters in 2022 in Pace, FL 7 $150 to $19917 $200 to $24932 $400 to $44988 $450 to $49938 $550 to $59988 $600 to $64991 $650 to $69938 $700 to $7496 $750 to $799134 $800 to $89968 $900 to $999118 $1,000 to $1,249122 $1,250 to $1,499268 $1,500 to $1,99989 $2,000 to $2,499252 No cash rent
Percentage of workers working in this county: 53.2%Number of people working at home: 1,436 (12.8% of all workers )
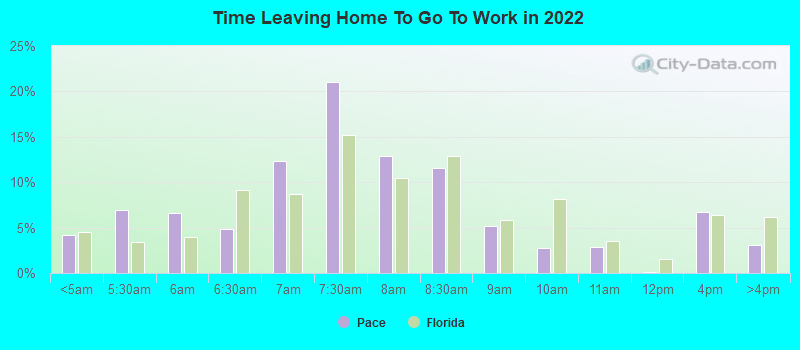
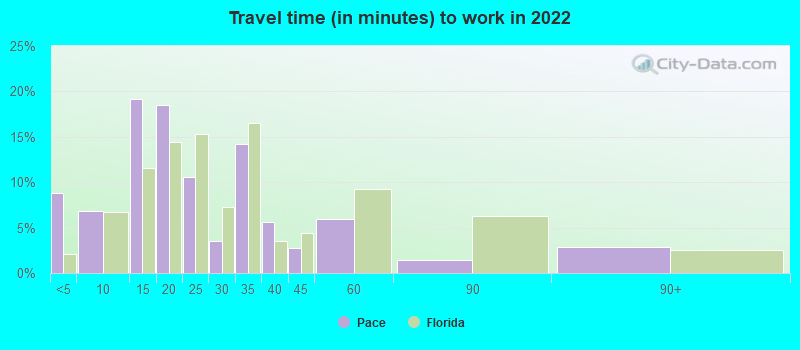
Travel time to work (commute)
Less than 5 minutes: 5165 to 9 minutes: 44610 to 14 minutes: 71215 to 19 minutes: 1,33520 to 24 minutes: 1,63325 to 29 minutes: 97330 to 34 minutes: 2,00735 to 39 minutes: 31040 to 44 minutes: 67445 to 59 minutes: 1,20460 to 89 minutes: 54590 or more minutes: 149
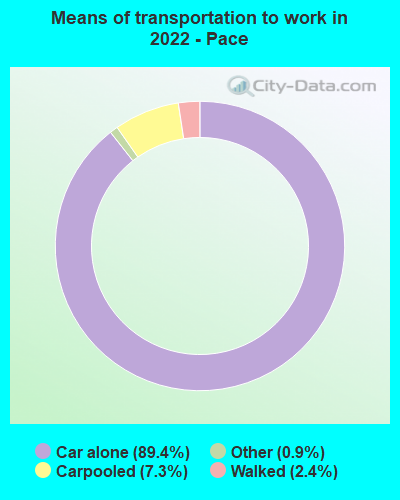
Means of transportation to work:
Drove a car alone: 5,116 (71.7%)Carpooled: 441 (6.2%)Taxi: 60 (0.8%)Walked: 147 (2.1%)Worked at home: 1,436 (20.1%)
Unemployment by race in 2022
Unemployment rate for White non-Hispanic residents 2.9% Males1.2% FemalesUnemployment rate for Black residents 16.7% FemalesUnemployment rate for Asian residents 4.6% FemalesUnemployment rate for two or more race residents 4.7% FemalesUnemployment rate for Hispanic or Latino residents 8.8% Males7.6% Females
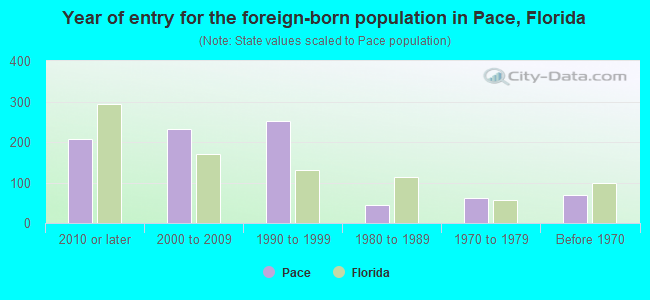
Year of entry for the foreign-born population in Pace, Florida
208 2010 or later 231 2000 to 2009 253 1990 to 1999 44 1980 to 1989 61 1970 to 1979 70 Before 1970
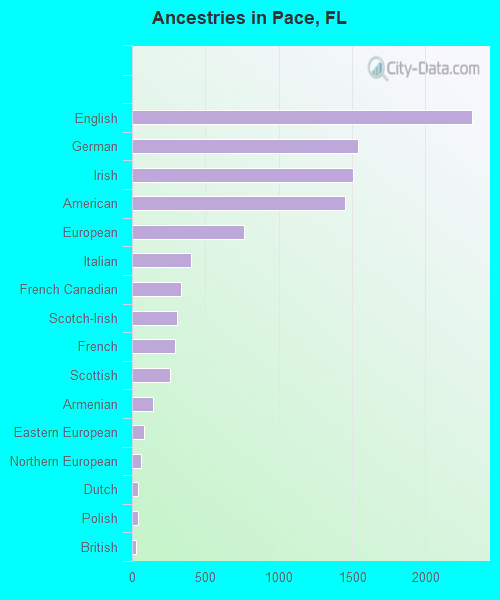
First ancestries reported:
English: 2,318 (17.3%)
German: 1,538 (11.5%)
Irish: 1,507 (11.3%)
American: 1,449 (10.8%)
European: 762 (5.7%)
Italian: 399 (3.0%)
French Canadian: 332 (2.5%)
Scotch-Irish: 310 (2.3%)
French: 295 (2.2%)
Scottish: 256 (1.9%)
Armenian: 145 (1.1%)
Eastern European: 82 (0.6%)
Northern European: 58 (0.4%)
Dutch: 44 (0.3%)
Polish: 44 (0.3%)
British: 27 (0.2%)
Scandinavian: 19 (0.1%)
Swedish: 16 (0.1%)
Welsh: 16 (0.1%)
South African: 14 (0.1%)
Cajun: 13 (0.10%)
Czech: 13 (0.10%)
Canadian: 12 (0.09%)
Greek: 10 (0.07%)
Pennsylvania German: 10 (0.07%)
Czechoslovakian: 9 (0.07%)
Norwegian: 9 (0.07%)
Danish: 8 (0.06%) Most common places of birth for foreign-born residents (%): Philippines Pace:
26.6% (331)Florida:
1.8% (84,403)
England Pace:
8.5% (106)Florida:
0.8% (37,723)
Mexico Pace:
8.4% (104)Florida:
5.6% (257,152)
Other Eastern Africa Pace:
7.4% (92)Florida:
0.1% (2,818)
Sweden Pace:
4.2% (52)Florida:
0.1% (4,700)
United Kingdom, excluding England and Scotland Pace:
4.1% (51)Florida:
0.7% (34,227)
Lebanon Pace:
3.3% (41)Florida:
0.2% (8,352)
Syria Pace:
3.2% (40)Florida:
0.2% (7,299)
Argentina Pace:
3.2% (40)Florida:
1.3% (57,263)
Peru Pace:
2.9% (36)Florida:
2.1% (96,693)
China, excluding Hong Kong and Taiwan Pace:
2.8% (35)Florida:
1.2% (56,071)
Pakistan Pace:
2.7% (33)Florida:
0.3% (13,569)
Ireland Pace:
2.0% (25)Florida:
0.2% (9,421)
Dominica Pace:
2.0% (25)Florida:
0.1% (5,375)
Italy Pace:
1.9% (24)Florida:
0.7% (30,755)
Canada Pace:
1.8% (23)Florida:
2.4% (109,132)
Nigeria Pace:
1.6% (20)Florida:
0.2% (10,443)
Vietnam Pace:
1.5% (19)Florida:
1.3% (60,604)
Germany Pace:
1.5% (19)Florida:
1.2% (54,272)
Honduras Pace:
1.5% (19)Florida:
2.3% (107,160)
Nicaragua Pace:
1.5% (19)Florida:
2.3% (105,066)
Place of birth for U.S.-born residents:
This state: 12,054Other state: 13,535Northeast: 2,041Midwest: 2,045South: 7,818West: 1,721 88.1% of Pace residents lived in the same house 1 years ago.
Out of people who lived in different houses, 30.0% lived in this county.
Out of people who lived in different counties, 32.0% lived in Florida.
Pace:
88.1%State average:
86.3%
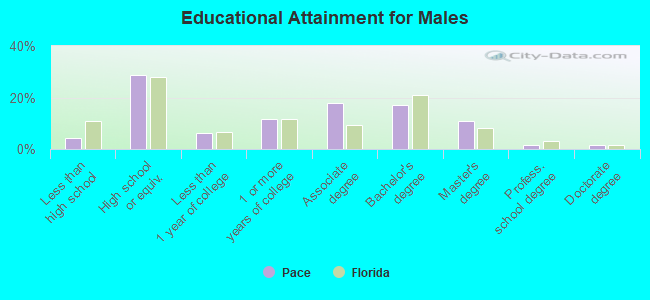
Education attainment for males 25 years and older:
No schooling: 64Nursery to 4th grade: 05th and 6th grade: 427th and 8th grade: 269th grade: 7710th grade: 3511th grade: 7112th grade, no diploma: 70High school graduate (or equivalency): 2,526Less than 1 year of college: 542Some college more than 1 year, no degree: 1,048Associate degree: 1,576Bachelor's degree: 1,522Master's degree: 967Professional school degree: 144Doctorate degree: 139
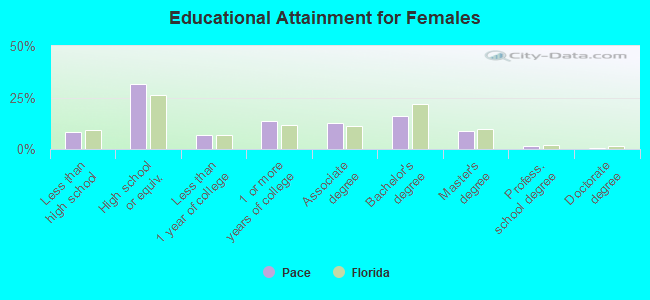
Education attainment for females 25 years and older:
No schooling: 114Nursery to 4th grade: 05th and 6th grade: 917th and 8th grade: 139th grade: 1210th grade: 25111th grade: 21012th grade, no diploma: 95High school graduate (or equivalency): 2,982Less than 1 year of college: 638Some college more than 1 year, no degree: 1,293Associate degree: 1,186Bachelor's degree: 1,498Master's degree: 833Professional school degree: 130Doctorate degree: 54
Housing units in structures:
One, detached: 8,752One, attached: 183 or 4: 625 to 9: 15910 to 19: 950 or more: 29Mobile homes: 848Boats, RVs, vans, etc.: 20Median worth of mobile homes: $103,133
Housing units lacking complete plumbing facilities in 2022: 1.1%Housing units lacking complete kitchen facilities in 2022: 2.4%House/condo owner moved in on average 9 years ago
Renter moved in on average 3 years ago
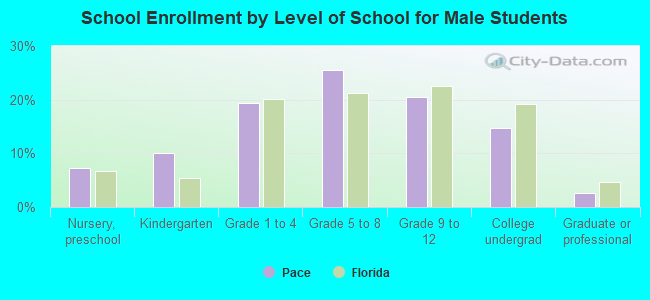
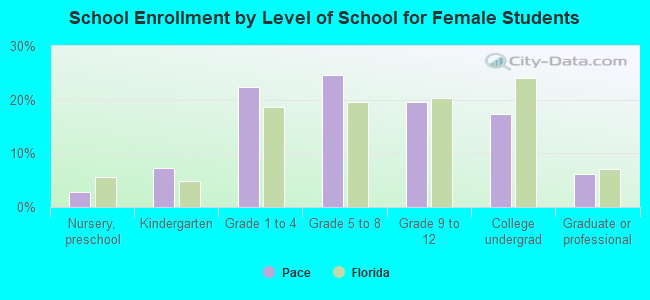
Private vs. public school enrollment:
Students in private schools in grades 1 to 8 (elementary and middle school): 767 Students in private schools in grades 9 to 12 (high school): 123 Students in private undergraduate colleges: 94