Oxnard, CA (California) Houses and Residents
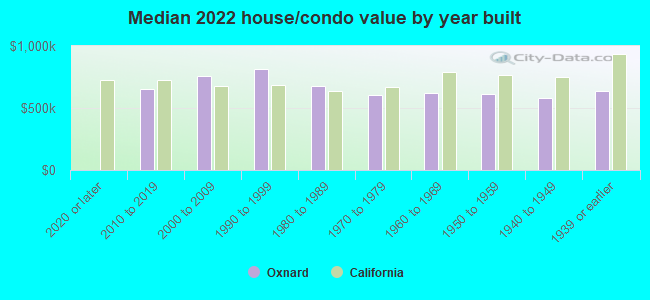
| Oxnard: | $651,900 |
| California: | $715,900 |
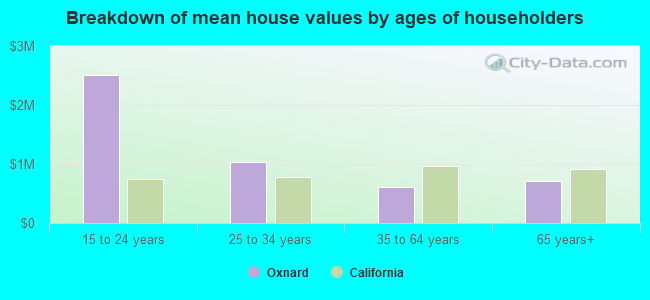
Mean price in 2022:
Detached houses: $726,118
Here: $726,118 State: $988,808 Townhouses or other attached units: $564,466
Here: $564,466 State: $838,546 In 2-unit structures: $489,430
Here: $489,430 State: $1,138,100 In 3-to-4-unit structures: $489,004
Here: $489,004 State: $824,253 In 5-or-more-unit structures: $484,986
Here: $484,986 State: $730,996 Mobile homes: $190,545
Here: $190,545 State: $184,506 Occupied boats, RVs, vans, etc.: $5,583
Here: $5,583 State: $204,957
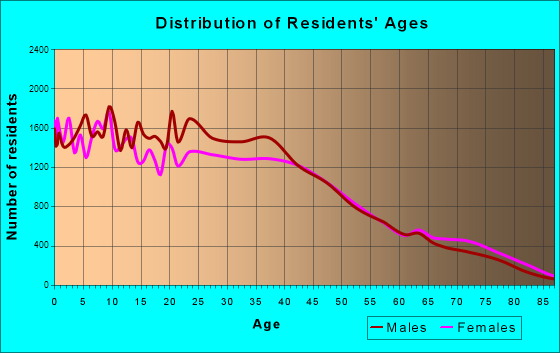
Total population: 205,437 (Urban population: 170,585, Rural population: 10 (all nonfarm))
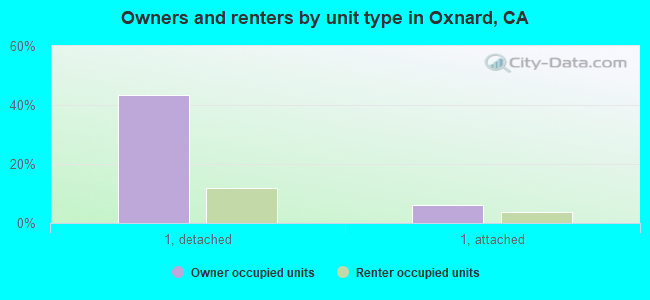
Houses: 57,632 (54,511 occupied: 28,367 owner occupied, 26,144 renter occupied)
| % of renters here: | 48% |
| State: | 44% |
Housing density: 2,277 houses/condos per square mile
Median price asked for vacant for-sale houses and condos in 2022: $1,290,407.
Median contract rent in 2022: $1,876 (lower quartile is $1,327, upper quartile is over $2,000)
Median rent asked for vacant for-rent units in 2022: $1,464
Median gross rent in Oxnard, CA in 2022: $1,945
Housing units in Oxnard with a mortgage: 18,578 (1,294 second mortgage, 0 home equity loan, 1,000 both second mortgage and home equity loan)
Houses without a mortgage: 262
Median household income for houses/condos with a mortgage: $123,153
Median household income for apartments without a mortgage: $92,166
Median monthly housing costs: $1,907
Compare current foreclosures in Oxnard, CA:
| Photo | Address | Area | Beds / Baths | Price | Details |
|---|---|---|---|---|---|

|
#1
Islander Walk
Oxnard, CA 93035
|
1,283 sq. feet
|
2 baths 2 beds |
show details | |

|
#2
Kern St
Oxnard, CA 93033
|
1,233 sq. feet
|
2 baths 4 beds |
show details | |

|
#3
Lookout Dr
Oxnard, CA 93035
|
1,950 sq. feet
|
2 baths 4 beds |
show details | |

|
#4
Canal St
Oxnard, CA 93035
|
2,504 sq. feet
|
3 baths 3 beds |
show details | |

|
#5
Callas Dr
Oxnard, CA 93035
|
2,469 sq. feet
|
3 baths 5 beds |
show details | |

|
#6
Kumquat Pl
Oxnard, CA 93036
|
1,860 sq. feet
|
2 baths 5 beds |
show details | |

|
#7
Ribera Dr
Oxnard, CA 93030
|
2,419 sq. feet
|
3 baths 4 beds |
show details | |

|
#8
N Hayes Ave
Oxnard, CA 93030
|
1,044 sq. feet
|
1 baths 3 beds |
show details | |

|
#9
Entrada Dr
Oxnard, CA 93036
|
1,807 sq. feet
|
2 baths 4 beds |
show details | |

|
#10
Green River St
Oxnard, CA 93036
|
1,556 sq. feet
|
2 baths 4 beds |
show details |
| Photo | Address | Area | Beds / Baths | Price | Details |
|---|---|---|---|---|---|

|
#11
Sanford St
Oxnard, CA 93033
|
1,170 sq. feet
|
2 baths 3 beds |
show details | |

|
#12
W Robert Ave
Oxnard, CA 93030
|
1,838 sq. feet
|
2 baths 4 beds |
show details | |

|
#13
Redwood St
Oxnard, CA 93033
|
1,252 sq. feet
|
2 baths 3 beds |
show details | |

|
#14
Juneberry Pl
Oxnard, CA 93036
|
1,240 sq. feet
|
2 baths 3 beds |
show details | |

|
#15
Upper Bay Dr
Oxnard, CA 93036
|
2,333 sq. feet
|
2 baths 4 beds |
show details | |

|
#16
S B St
Oxnard, CA 93033
|
1,614 sq. feet
|
2 baths 3 beds |
show details | |

|
#17
Berkshire St
Oxnard, CA 93033
|
1,418 sq. feet
|
2 baths 3 beds |
show details | |

|
#18
S G St # 321
Oxnard, CA 93030
|
1,008 sq. feet
|
1 baths 3 beds |
show details | |

|
#19
Jackson St
Oxnard, CA 93033
|
1,170 sq. feet
|
1 baths 3 beds |
show details | |

|
#20
Tradewinds Dr
Oxnard, CA 93035
|
1,734 sq. feet
|
2 baths 2 beds |
show details |
| Photo | Address | Area | Beds / Baths | Price | Details |
|---|---|---|---|---|---|

|
#21
E Hemlock St
Oxnard, CA 93033
|
1,888 sq. feet
|
3 baths 3 beds |
show details | |

|
#22
W Channel Islands Blvd
Oxnard, CA 93033
|
1,128 sq. feet
|
2 baths 3 beds |
show details | |

|
#23
Snow Ave
Oxnard, CA 93036
|
2,013 sq. feet
|
3 baths 3 beds |
show details | |

|
#24
Berkshire Pl
Oxnard, CA 93033
|
1,762 sq. feet
|
2 baths 4 beds |
show details | |

|
#25
San Simeon Dr
Oxnard, CA 93033
|
2,268 sq. feet
|
3 baths 6 beds |
show details | |

|
#26
Mendocino Pl
Oxnard, CA 93033
|
1,134 sq. feet
|
2 baths 3 beds |
show details | |

|
#27
Kern St
Oxnard, CA 93033
|
2,078 sq. feet
|
4 baths 10 beds |
show details | |

|
#28
Tangerine Pl
Oxnard, CA 93033
|
1,288 sq. feet
|
2 baths 3 beds |
show details | |

|
#29
Rhonda St
Oxnard, CA 93036
|
1,639 sq. feet
|
2 baths 3 beds |
show details | |

|
#30
Salem Ave
Oxnard, CA 93036
|
1,152 sq. feet
|
2 baths 4 beds |
show details |
| Photo | Address | Area | Beds / Baths | Price | Details |
|---|---|---|---|---|---|

|
#31
Gisler Ave
Oxnard, CA 93033
|
1,575 sq. feet
|
2 baths 4 beds |
show details | |

|
#32
Hill St
Oxnard, CA 93035
|
2,594 sq. feet
|
2 baths 4 beds |
show details | |

|
#33
Napoleon Ave
Oxnard, CA 93033
|
1,615 sq. feet
|
2 baths 4 beds |
show details | |

|
#34
Junto Ln
Oxnard, CA 93036
|
2,932 sq. feet
|
2 baths 3 beds |
show details | |

|
#35
Cesar Chavez Dr
Oxnard, CA 93030
|
2,399 sq. feet
|
3 baths 4 beds |
show details | |

|
#36
Fathom Dr
Oxnard, CA 93035
|
1,178 sq. feet
|
2 baths 3 beds |
show details | |

|
#37
Mandalay Beach Rd
Oxnard, CA 93035
|
2,914 sq. feet
|
2 baths 3 beds |
show details | |

|
#38
Julian St
Oxnard, CA 93030
|
1,023 sq. feet
|
1 baths 3 beds |
show details | |

|
#39
Entrada Dr
Oxnard, CA 93036
|
1,807 sq. feet
|
2 baths 4 beds |
show details | |

|
#40
Curran St
Oxnard, CA 93033
|
1,232 sq. feet
|
2 baths 3 beds |
show details |
| Photo | Address | Area | Beds / Baths | Price | Details |
|---|---|---|---|---|---|

|
#41
Avila Pl
Oxnard, CA 93036
|
1,400 sq. feet
|
2 baths 3 beds |
show details | |

|
#42
Pavin Dr
Oxnard, CA 93036
|
3,149 sq. feet
|
3 baths 5 beds |
show details | |

|
#43
N Ventura Rd
Oxnard, CA 93036
|
1,375 sq. feet
|
2 baths 3 beds |
show details | |

|
#44
S E St
Oxnard, CA 93033
|
1,373 sq. feet
|
2 baths 3 beds |
show details | |

|
#45
S J St
Oxnard, CA 93033
|
1,252 sq. feet
|
2 baths 3 beds |
show details | |

|
#46
W Elm St
Oxnard, CA 93033
|
1,272 sq. feet
|
2 baths 3 beds |
show details | |

|
#47
Encino Pl
Oxnard, CA 93033
|
1,612 sq. feet
|
2 baths 3 beds |
show details | |

|
#48
Jurymast Dr
Oxnard, CA 93030
|
2,184 sq. feet
|
2 baths 4 beds |
show details | |

|
#49
W Vineyard Ave
Oxnard, CA 93036
|
1,013 sq. feet
|
2 baths 2 beds |
show details | |

|
Check over 1 million property listings on Foreclosure.com!
|
browse all offers | |||

Latest news about housing in Oxnard, CA collected exclusively by city-data.com from local newspapers, TV, and radio stations

 | Apartment rentals in Oxnard (4 replies) |
| Apartments for Rent - Oxnard/Port Hueneme (1 reply) |
| Oxnard - Renting apartments help. (17 replies) |
| Relocating to Ventura , work in east Oxnard (11 replies) |
| Help - should we move to Oxnard or Camarillo? (6 replies) |
| Buy or Rent - Ventura County Edition (17 replies) |
Median year apartment built: 1977
Household type by relationship:
Households: 200,437- Male householders: 27,435 (5,184 living alone), Female householders: 27,076 (4,832 living alone)
26,178 spouses (26,087 opposite-sex spouses), 4,557 unmarried partners, (4,452 opposite-sex unmarried partners), 67,138 children (63,150 natural, 841 adopted, 3,147 stepchildren), 7,695 grandchildren, 4,866 brothers or sisters, 7,056 parents, 1,337 foster children, 12,896 other relatives, 11,709 non-relatives
- In group quarters: 2,494
Size of family households: 10,008 2-persons, 8,846 3-persons, 8,407 4-persons, 5,507 5-persons, 3,078 6-persons, 5,409 7-or-more-persons.
Size of nonfamily households: 10,016 1-person, 2,212 2-persons, 500 3-persons, 217 4-persons, 226 5-persons, 85 7-or-more-persons.
23,953 married couples with children.
15,754 single-parent households (3,996 men, 11,758 women).
33.9% of residents of Oxnard speak English at home.
57.8% of residents speak Spanish at home (56% speak English very well, 14% speak English well, 14% speak English not well, 16% don't speak English at all).
1.0% of residents speak other Indo-European language at home (77% speak English very well, 8% speak English well, 8% speak English not well, 7% don't speak English at all).
4.5% of residents speak Asian or Pacific Island language at home (58% speak English very well, 24% speak English well, 16% speak English not well, 2% don't speak English at all).
2.8% of residents speak other language at home (31% speak English very well, 11% speak English not well, 58% don't speak English at all).
Foreign born population: 66,703 (33.3%)
(41.6% of them are naturalized citizens)
| Here: | 5.9 |
| State: | 6.0 |
| Here: | 4.2 |
| State: | 3.9 |
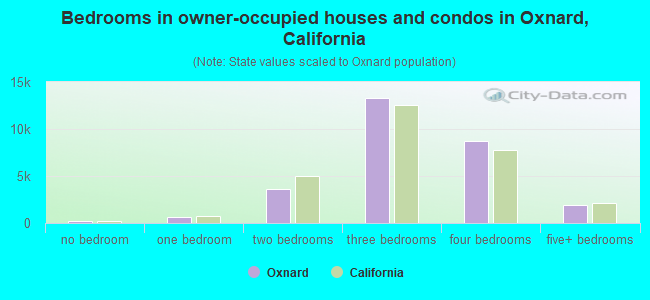
- Bedrooms in owner-occupied houses and condos in Oxnard, California
- 187no bedroom
- 5901 bedroom
- 3,6372 bedrooms
- 13,3103 bedrooms
- 8,7664 bedrooms
- 1,8775+ bedrooms
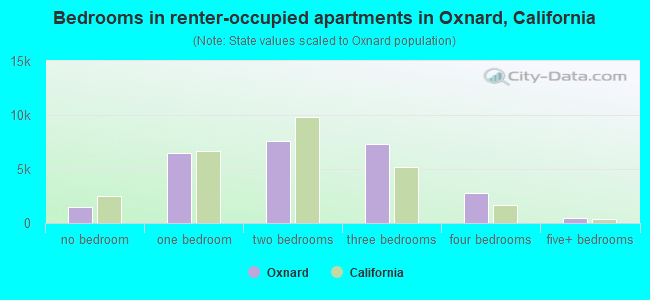
- Bedrooms in renter-occupied apartments in Oxnard, California
- 1,465no bedroom
- 6,4381 bedroom
- 7,6342 bedrooms
- 7,3143 bedrooms
- 2,8194 bedrooms
- 4745+ bedrooms
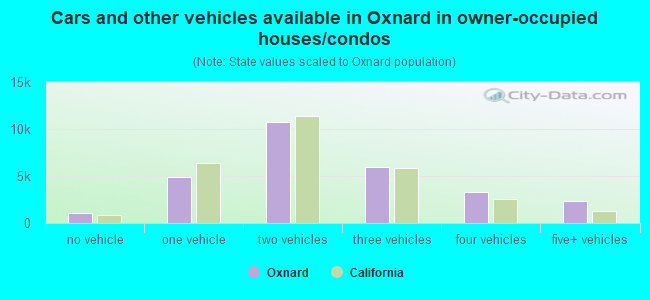
- Cars and other vehicles available in Oxnard in owner-occupied houses/condos
- 1,044no vehicle
- 4,8671 vehicle
- 10,7602 vehicles
- 6,0043 vehicles
- 3,3114 vehicles
- 2,3815+ vehicles
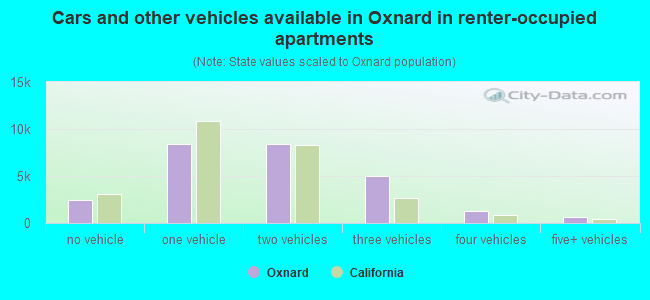
- Cars and other vehicles available in Oxnard in renter-occupied apartments
- 2,459no vehicle
- 8,4121 vehicle
- 8,3722 vehicles
- 4,9713 vehicles
- 1,3074 vehicles
- 6235+ vehicles
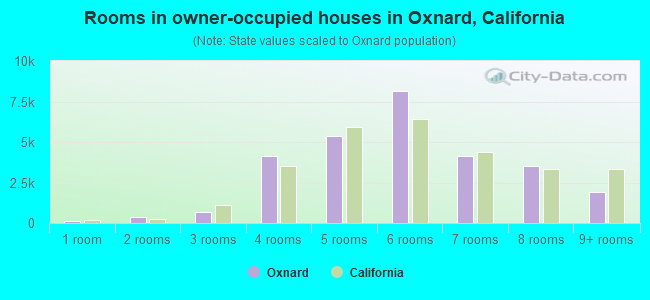
- Rooms in owner-occupied houses in Oxnard, California
- 1001 room
- 3412 rooms
- 6953 rooms
- 4,1544 rooms
- 5,3555 rooms
- 8,1646 rooms
- 4,1397 rooms
- 3,5138 rooms
- 1,9069+ rooms
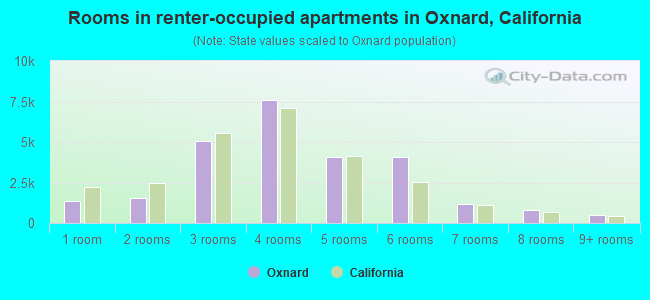
- Rooms in renter-occupied apartments in Oxnard, California
- 1,3651 room
- 1,5442 rooms
- 5,0523 rooms
- 7,5644 rooms
- 4,0775 rooms
- 4,0866 rooms
- 1,1677 rooms
- 8038 rooms
- 4869+ rooms
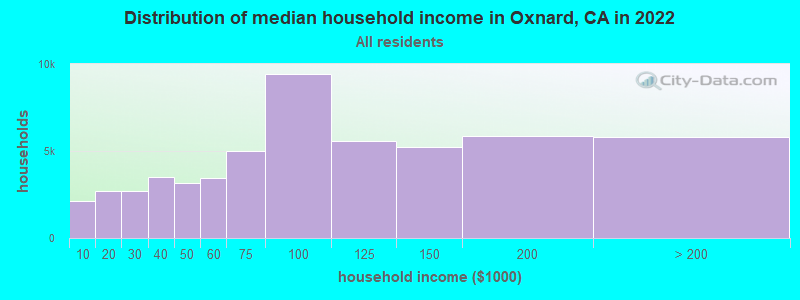
Oxnard, CA household income distribution

- 2,132Less than $10,000
- 2,705$10,000 to $19,999
- 2,681$20,000 to $29,999
- 3,492$30,000 to $39,999
- 3,150$40,000 to $49,999
- 3,455$50,000 to $59,999
- 4,996$60,000 to $74,999
- 9,428$75,000 to $99,999
- 5,589$100,000 to $124,999
- 5,228$125,000 to $149,999
- 5,848$150,000 to $199,999
- 5,807$200,000 or more
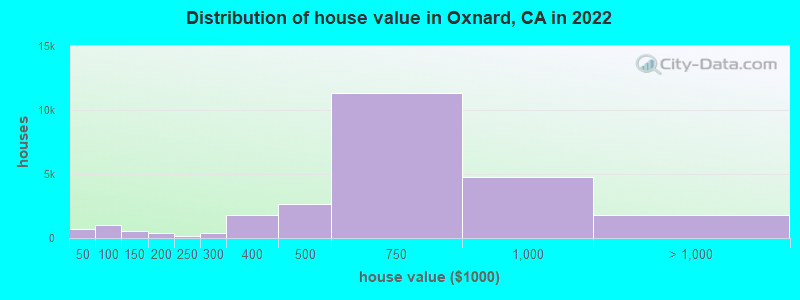
Home value of owner - occupied houses in 2022 in Oxnard, CA
-
- 242Less than $10,000
- 117$10,000 to $14,999
- 2$20,000 to $24,999
- 28$25,000 to $29,999
- 121$30,000 to $34,999
- 46$35,000 to $39,999
- 150$40,000 to $49,999
- 284$50,000 to $59,999
- 66$60,000 to $69,999
- 220$70,000 to $79,999
- 84$80,000 to $89,999
- 169$90,000 to $99,999
- 462$100,000 to $124,999
- 76$125,000 to $149,999
- 327$150,000 to $174,999
- 97$175,000 to $199,999
- 184$200,000 to $249,999
- 367$250,000 to $299,999
- 1,777$300,000 to $399,999
- 2,684$400,000 to $499,999
- 11,321$500,000 to $749,999
- 4,758$750,000 to $999,999
- 1,141$1,000,000 to $1,499,999
- 259$1,500,000 to $1,999,999
- 362$2,000,000 or more
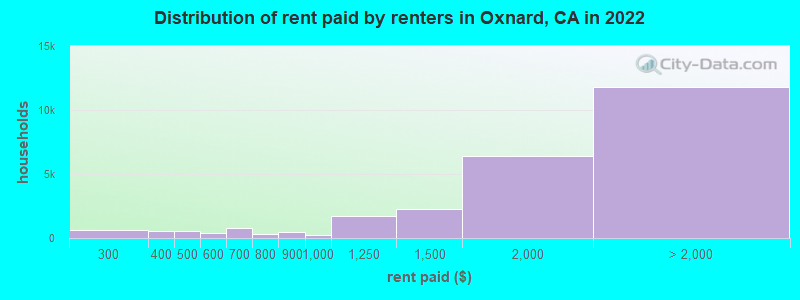
Rent paid by renters in 2022 in Oxnard, CA
-
- 44Less than $100
- 232$200 to $249
- 417$250 to $299
- 343$300 to $349
- 187$350 to $399
- 326$400 to $449
- 233$450 to $499
- 361$500 to $549
- 480$600 to $649
- 279$650 to $699
- 283$700 to $749
- 61$750 to $799
- 496$800 to $899
- 216$900 to $999
- 1,736$1,000 to $1,249
- 2,262$1,250 to $1,499
- 6,409$1,500 to $1,999
- 4,435$2,000 to $2,499
- 4,604$2,500 to $2,999
- 771$3,000 to $3,499
- 1,386$3,500 or more
- 583No cash rent
Percentage of workers working in this county: 90.7%
Number of people working at home: 7,448 (7.7% of all workers)
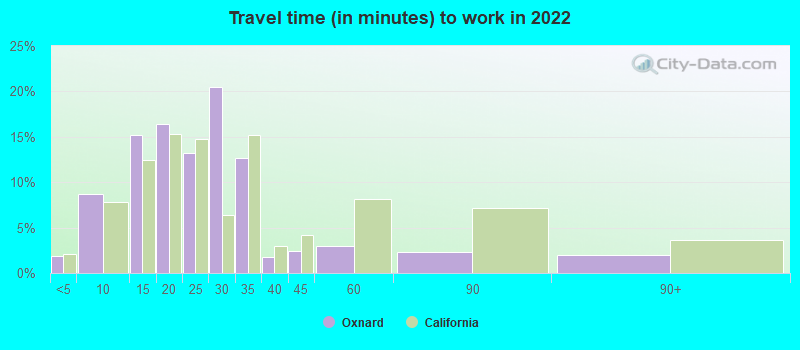
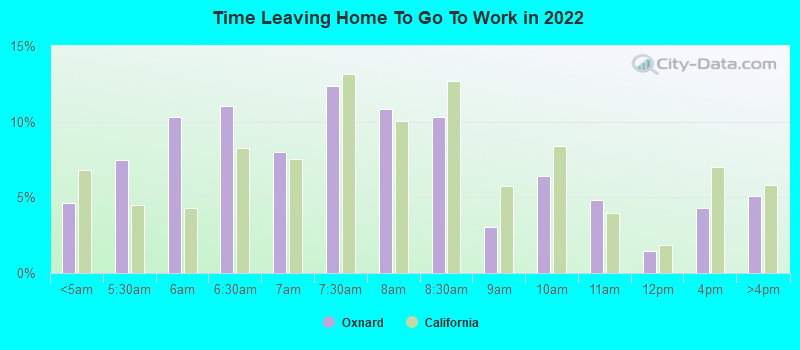
Travel time to work (commute)
- Less than 5 minutes: 1,155
- 5 to 9 minutes: 5,246
- 10 to 14 minutes: 10,873
- 15 to 19 minutes: 14,091
- 20 to 24 minutes: 11,479
- 25 to 29 minutes: 23,931
- 30 to 34 minutes: 10,811
- 35 to 39 minutes: 213
- 40 to 44 minutes: 2,548
- 45 to 59 minutes: 3,797
- 60 to 89 minutes: 3,418
- 90 or more minutes: 2,333
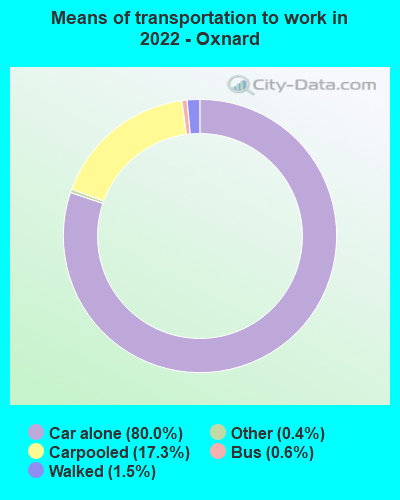
Means of transportation to work:
- Drove a car alone: 52,816 (71.9%)
- Carpooled: 11,443 (15.6%)
- Bus: 428 (0.6%)
- Taxi: 292 (0.4%)
- Bicycle: 57 (0.1%)
- Walked: 961 (1.3%)
- Worked at home: 7,448 (10.1%)
- Unemployment by race in 2022
- Unemployment rate for White non-Hispanic residents
- 7.5%Males
- 0.4%Females
- Unemployment rate for Black residents
- 3.3%Males
- 8.0%Females
- Unemployment rate for American Indian and Alaska Native residents
- 1.4%Males
- 5.9%Females
- Unemployment rate for Asian residents
- 6.2%Males
- 0.6%Females
- Unemployment rate for other race residents
- 2.3%Males
- 4.7%Females
- Unemployment rate for two or more race residents
- 3.6%Males
- 5.8%Females
- Unemployment rate for Hispanic or Latino residents
- 2.6%Males
- 4.8%Females
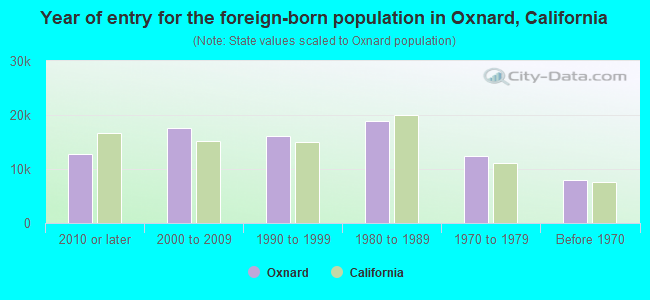
- Year of entry for the foreign-born population in Oxnard, California
- 12,7002010 or later
- 17,5762000 to 2009
- 16,0501990 to 1999
- 18,9151980 to 1989
- 12,4901970 to 1979
- 7,987Before 1970
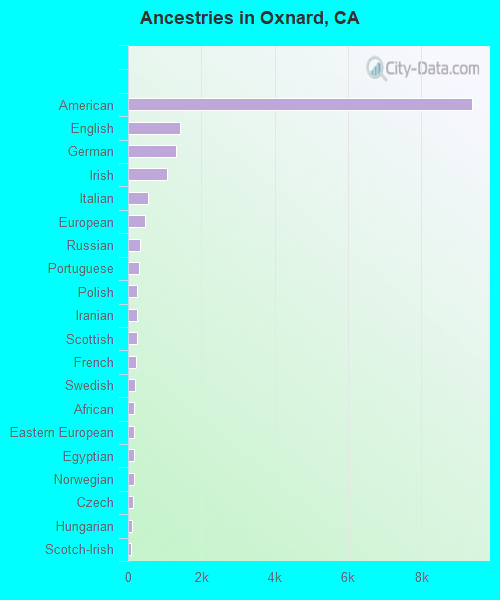
First ancestries reported:
- American: 9,377 (6.1%)
- English: 1,425 (0.9%)
- German: 1,314 (0.9%)
- Irish: 1,076 (0.7%)
- Italian: 559 (0.4%)
- European: 459 (0.3%)
- Russian: 317 (0.2%)
- Portuguese: 310 (0.2%)
- Polish: 257 (0.2%)
- Iranian: 251 (0.2%)
- Scottish: 241 (0.2%)
- French: 207 (0.1%)
- Swedish: 192 (0.1%)
- African: 175 (0.1%)
- Eastern European: 170 (0.1%)
- Egyptian: 159 (0.1%)
- Norwegian: 153 (0.10%)
- Czech: 127 (0.08%)
- Hungarian: 119 (0.08%)
- Scotch-Irish: 89 (0.06%)
- Syrian: 78 (0.05%)
- French Canadian: 75 (0.05%)
- Romanian: 69 (0.05%)
- South African: 68 (0.04%)
- Trinidadian and Tobagonian: 63 (0.04%)
- British: 59 (0.04%)
- Scandinavian: 59 (0.04%)
- Jamaican: 51 (0.03%)
- Brazilian: 45 (0.03%)
- Dutch: 45 (0.03%)
- Croatian: 43 (0.03%)
- Danish: 37 (0.02%)
- Lithuanian: 37 (0.02%)
- Nigerian: 35 (0.02%)
- Ukrainian: 32 (0.02%)
- Welsh: 30 (0.02%)
- Albanian: 29 (0.02%)
- Lebanese: 27 (0.02%)
- Finnish: 26 (0.02%)
- Australian: 24 (0.02%)
- Swiss: 23 (0.02%)
- Serbian: 21 (0.01%)
- Canadian: 21 (0.01%)
- Northern European: 20 (0.01%)
- West Indian: 19 (0.01%)
- Armenian: 19 (0.01%)
- Czechoslovakian: 18 (0.01%)
- Greek: 16 (0.01%)
- Barbadian: 14 (0.01%)
- Belizean: 13 (0.01%)
- Ghanaian: 9 (0.01%)
- Belgian: 9 (0.01%)
- Israeli: 9 (0.01%)
Most common places of birth for foreign-born residents (%):
| Oxnard: | 78.3% (52,625) |
| California: | 37.2% (3,881,193) |
| Oxnard: | 8.9% (5,998) |
| California: | 7.8% (818,297) |
| Oxnard: | 2.2% (1,495) |
| California: | 4.2% (440,287) |
Place of birth for U.S.-born residents:
- This state: 117,826
- Other state: 13,028
- Northeast: 2,478
- Midwest: 4,346
- South: 3,970
- West: 2,234
91.9% of Oxnard residents lived in the same house 1 years ago.
Out of people who lived in different houses, 41.0% lived in this county.
Out of people who lived in different counties, 79.9% lived in California.
| Oxnard: | 91.9% |
| State average: | 88.9% |
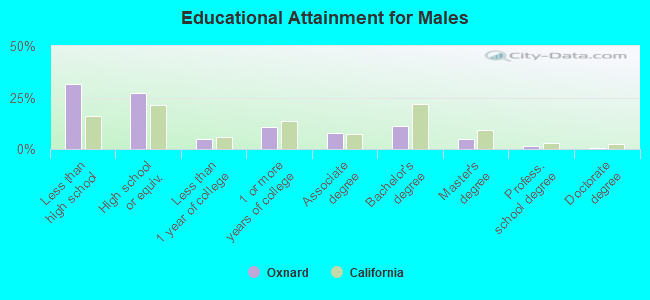
Education attainment for males 25 years and older:
- No schooling: 5,265
- Nursery to 4th grade: 2,361
- 5th and 6th grade: 5,766
- 7th and 8th grade: 1,573
- 9th grade: 1,041
- 10th grade: 1,182
- 11th grade: 1,317
- 12th grade, no diploma: 2,070
- High school graduate (or equivalency): 17,858
- Less than 1 year of college: 3,291
- Some college more than 1 year, no degree: 6,937
- Associate degree: 4,967
- Bachelor's degree: 7,237
- Master's degree: 3,027
- Professional school degree: 880
- Doctorate degree: 438
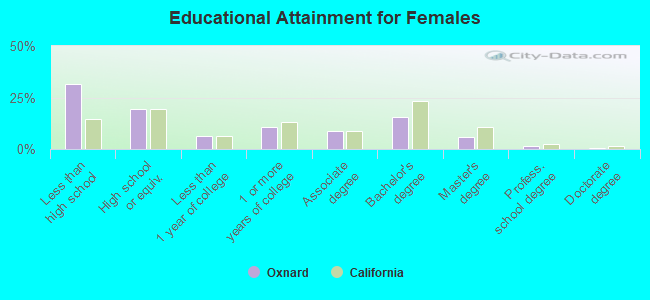
Education attainment for females 25 years and older:
- No schooling: 3,756
- Nursery to 4th grade: 1,794
- 5th and 6th grade: 6,672
- 7th and 8th grade: 1,363
- 9th grade: 1,351
- 10th grade: 699
- 11th grade: 1,608
- 12th grade, no diploma: 2,427
- High school graduate (or equivalency): 12,283
- Less than 1 year of college: 4,024
- Some college more than 1 year, no degree: 6,703
- Associate degree: 5,463
- Bachelor's degree: 9,767
- Master's degree: 3,558
- Professional school degree: 896
- Doctorate degree: 213
Housing units in structures:
- One, detached: 30,478
- One, attached: 6,601
- Two: 1,105
- 3 or 4: 3,219
- 5 to 9: 3,760
- 10 to 19: 2,623
- 20 to 49: 2,533
- 50 or more: 4,184
- Mobile homes: 2,938
- Boats, RVs, vans, etc.: 191
Median worth of mobile homes: $183,700
Housing units lacking complete kitchen facilities in 2022: 1.6%
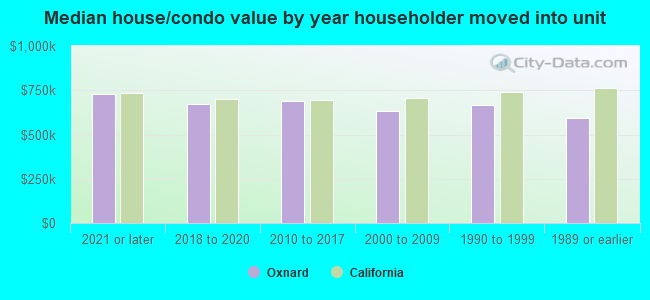
House/condo owner moved in on average 16 years ago
Renter moved in on average 3 years ago
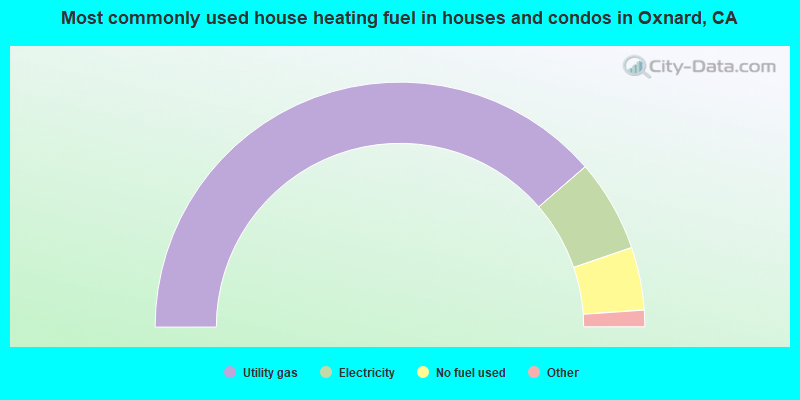
- 77.3%Utility gas
- 12.2%Electricity
- 8.3%No fuel used
- 1.2%Bottled, tank, or LP gas
- 0.4%Solar energy
- 0.4%Wood
- 0.1%Fuel oil, kerosene, etc.
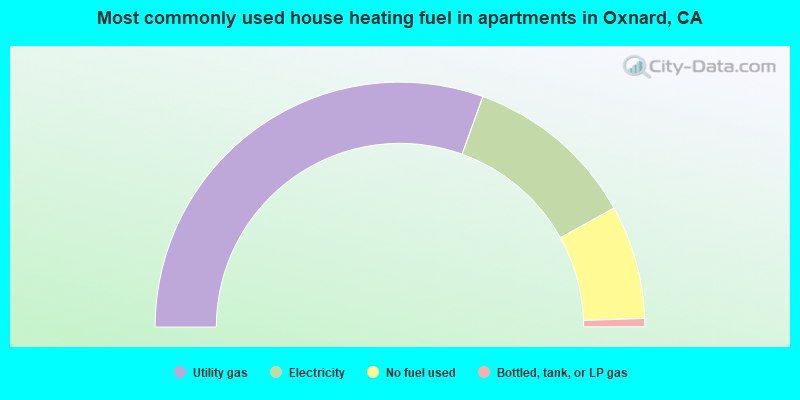
- 60.9%Utility gas
- 22.8%Electricity
- 15.0%No fuel used
- 1.1%Bottled, tank, or LP gas
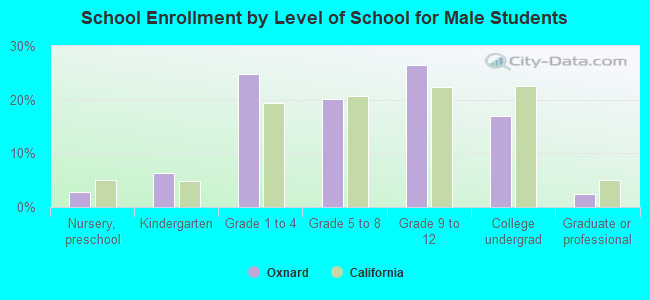
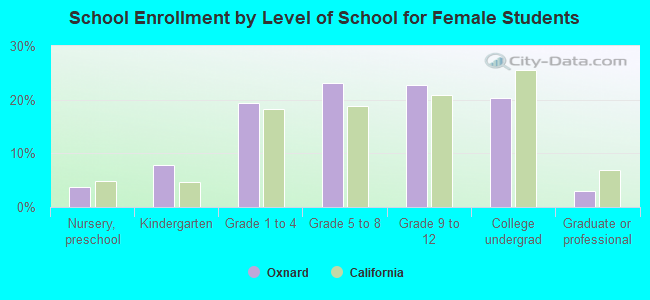
Private vs. public school enrollment:
| Here: | 2.4% |
| California: | 10.5% |
| Here: | 1.7% |
| California: | 8.5% |
| Here: | 8.7% |
| California: | 15.9% |