Oxford, AL (Alabama) Houses and Residents
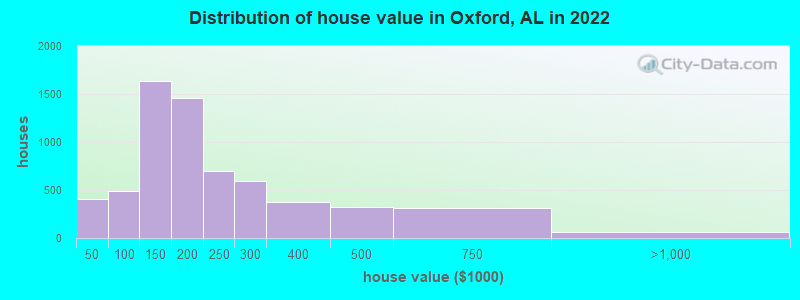
Estimated median house or condo value in 2022: $170,447 (it was $79,300 in 2000 )
Oxford:
$170,447Alabama:
$200,900
Lower value quartile - upper value quartile: $115,644 - $246,604Mean price in 2022: Detached houses: $249,875 Here:
$249,875State:
$273,076
Townhouses or other attached units: $95,728 Here:
$95,728State:
$222,857
Mobile homes: $97,717 Here:
$97,717State:
$77,780
Total population: 21,155 (Urban population: 13,571, Rural population: 1,096 (all nonfarm) )
Houses: 9,093 (8,214 occupied: 6,159 owner occupied, 2,201 renter occupied )
% of renters here:
26%State:
30%
Housing density: 499 houses/condos per square mile
Median price asked for vacant for-sale houses and condos in 2022: $97,626.
Median contract rent in 2022: $635 (lower quartile is $465, upper quartile is $749)
Median rent asked for vacant for-rent units in 2022: $454
Median gross rent in Oxford, AL in 2022: $732
Housing units in Oxford with a mortgage: 3,315 (321 second mortgage, 0 home equity loan, 308 both second mortgage and home equity loan )Houses without a mortgage: 141
Median household income for houses/condos with a mortgage: $77,755
Median household income for apartments without a mortgage: $64,465
Median monthly housing costs: $715
Data:
Median house or condo value ($)
Median house or condo value ($ change since 2000)
Median house or condo value ($) - White
Median house or condo value ($) - Black or African American
Median house or condo value ($) - Asian
Median house or condo value ($) - Hispanic or Latino
Median house or condo value ($) - American Indian and Alaska Native
Median house or condo value ($) - Multirace
Median house or condo value ($) - Other Race
Median price asked for mobile homes ($)
Household density (households per square mile)
Mean house or condo value by units in structure - 1, detached ($)
Mean house or condo value by units in structure - 1, attached ($)
Mean house or condo value by units in structure - 2 ($)
Mean house or condo value by units in structure by units in structure - 3 or 4 ($)
Mean house or condo value by units in structure - 5 or more ($)
Mean house or condo value by units in structure - Boat, RV, van, etc. ($)
Mean house or condo value by units in structure - Mobile home ($)
Median contract rent ($)
Median contract rent - Lower quartile ($)
Median contract rent - Upper quartile ($)
Median gross rent ($)
Urban houses (%)
Rural houses (%)
Houses occupied (%)
Houses occupied (% change since 2000)
Houses owner occupied (%)
Houses owner occupied (% change since 2000)
Houses renter occupied (%)
Houses renter occupied (% change since 2000)
Vacant housing units - For rent (%)
Vacant housing units - For rent (% change since 2000)
Vacant housing units - For sale only (%)
Vacant housing units - For sale only (% change since 2000)
Vacant housing units - Rented or sold, not occupied (%)
Vacant housing units - Rented or sold, not occupied (% change since 2000)
Vacant housing units - For seasonal, recreational, or occasional use (%)
Vacant housing units - For seasonal, recreational, or occasional use (% change since 2000)
Vacant housing units - For migrant workers (%)
Vacant housing units - For migrant workers (% change since 2000)
Vacant housing units - Other vacant (%)
Vacant housing units - Other vacant (% change since 2000)
Median monthly housing costs ($)
Median household income for houses/condos with a mortgage ($)
Median household income for houses/condos without a mortgage ($)
Median household income ($)
Median household income ($) - White
Median household income ($) - Black or African American
Median household income ($) - Asian
Median household income ($) - Hispanic or Latino
Median household income ($) - American Indian and Alaska Native
Median household income ($) - Multirace
Median household income ($) - Other Race
Mortgage status - with mortgage (%)
Mortgage status - with second mortgage (%)
Mortgage status - with home equity loan (%)
Mortgage status - with both second mortgage and home equity loan (%)
Mortgage status - without a mortgage (%)
Median year house/condo built
Median year apartment built
Household type by relationship - Male householder living alone (%)
Household type by relationship - Male householder not living alone (%)
Household type by relationship - Female householder living alone (%)
Household type by relationship - Female householder not living alone (%)
Household type by relationship - Opposite-Sex spouse (%)
Household type by relationship - Same-Sex spouse (%)
Household type by relationship - Opposite-Sex unmarried partner (%)
Household type by relationship - Same-Sex unmarried partner (%)
Household type by relationship - In group quarters (%)
Size of family households - 2-person household (%)
Size of family households - 3-person household (%)
Size of family households - 4-person household (%)
Size of family households - 5-person household (%)
Size of family households - 6-person household (%)
Size of family households - 7-or-more-person household (%)
Size of nonfamily households - 1-person household (%)
Size of nonfamily households - 2-person household (%)
Size of nonfamily households - 3-person household (%)
Size of nonfamily households - 4-person household (%)
Size of nonfamily households - 5-person household (%)
Size of nonfamily households - 6-person household (%)
Size of nonfamily households - 7-or-moreperson household (%)
Year house built - Built 2010 or later (%)
Year house built - Built 2000 to 2009 (%)
Year house built - Built 1990 to 1999 (%)
Year house built - Built 1980 to 1989 (%)
Year house built - Built 1970 to 1979 (%)
Year house built - Built 1960 to 1969 (%)
Year house built - Built 1950 to 1959 (%)
Year house built - Built 1940 to 1949 (%)
Year house built - Built 1939 or earlier (%)
Median number of rooms in houses and condos
Median number of rooms in apartments
Median number of bedrooms in owner occupied houses
Mean number of bedrooms in owner occupied houses
Median number of bedrooms in renter occupied houses
Mean number of bedrooms in renter occupied houses
Median number of vehichles in owner occupied houses
Mean number of vehichles in owner occupied houses
Median number of vehichles in renter occupied houses
Mean number of vehichles in renter occupied houses
Rooms in owner-occupied houses - 1 room (%)
Rooms in owner-occupied houses - 2 rooms (%)
Rooms in owner-occupied houses - 3 rooms (%)
Rooms in owner-occupied houses - 4 rooms (%)
Rooms in owner-occupied houses - 5 rooms (%)
Rooms in owner-occupied houses - 6 rooms (%)
Rooms in owner-occupied houses - 7 rooms (%)
Rooms in owner-occupied houses - 8 rooms (%)
Rooms in owner-occupied houses - 9+ rooms (%)
Rooms in renter-occupied houses - 1 room (%)
Rooms in renter-occupied houses - 2 rooms (%)
Rooms in renter-occupied houses - 3 rooms (%)
Rooms in renter-occupied houses - 4 rooms (%)
Rooms in renter-occupied houses - 5 rooms (%)
Rooms in renter-occupied houses - 6 rooms (%)
Rooms in renter-occupied houses - 7 rooms (%)
Rooms in renter-occupied houses - 8 rooms (%)
Rooms in renter-occupied houses - 9+ rooms (%)
Bedrooms in owner-occupied houses - no bedrooms (%)
Bedrooms in owner-occupied houses - 1 bedroom (%)
Bedrooms in owner-occupied houses - 2 bedrooms (%)
Bedrooms in owner-occupied houses - 3 bedrooms (%)
Bedrooms in owner-occupied houses - 4 bedrooms (%)
Bedrooms in owner-occupied houses - 5+ bedrooms (%)
Bedrooms in renter-occupied houses - no bedrooms (%)
Bedrooms in renter-occupied houses - 1 bedroom (%)
Bedrooms in renter-occupied houses - 2 bedrooms (%)
Bedrooms in renter-occupied houses - 3 bedrooms (%)
Bedrooms in renter-occupied houses - 4 bedrooms (%)
Bedrooms in renter-occupied houses - 5+ bedrooms (%)
Vehicles available in owner-occupied houses - no vehicle available (%)
Vehicles available in owner-occupied houses - 1 vehicle available(%)
Vehicles available in owner-occupied houses - 2 Vehicles available (%)
Vehicles available in owner-occupied houses - 3 Vehicles available (%)
Vehicles available in owner-occupied houses - 4 Vehicles available (%)
Vehicles available in owner-occupied houses - 5+ Vehicles available (%)
Vehicles available in renter-occupied houses - no vehicle available (%)
Vehicles available in renter-occupied houses - 1 vehicle available (%)
Vehicles available in renter-occupied houses - 2 Vehicles available (%)
Vehicles available in renter-occupied houses - 3 Vehicles available (%)
Vehicles available in renter-occupied houses - 4 Vehicles available (%)
Vehicles available in renter-occupied houses - 5+ Vehicles available (%)
Housing units in structures - 1, detached (%)
Housing units in structures - 1, attached (%)
Housing units in structures - 2 (%)
Housing units in structures - 3 or 4 (%)
Housing units in structures - 5 to 9 (%)
Housing units in structures - 10 to 19 (%)
Housing units in structures - 20 to 49 (%)
Housing units in structures - 50 or more (%)
Housing units in structures - Mobile home (%)
Housing units in structures - Boat, RV, van, etc. (%)
Housing units in structures - Owners - 1, detached (%)
Housing units in structures - Owners - 1, attached (%)
Housing units in structures - Owners - 2 (%)
Housing units in structures - Owners - 3 or 4 (%)
Housing units in structures - Owners - 5 to 9 (%)
Housing units in structures - Owners - 10 to 19 (%)
Housing units in structures - Owners - 20 to 49 (%)
Housing units in structures - Owners - 50 or more (%)
Housing units in structures - Owners - Mobile home (%)
Housing units in structures - Owners - Boat, RV, van, etc. (%)
Housing units in structures - Renters - 1, detached (%)
Housing units in structures - Renters - 1, attached (%)
Housing units in structures - Renters - 2 (%)
Housing units in structures - Renters - 3 or 4 (%)
Housing units in structures - Renters - 5 to 9 (%)
Housing units in structures - Renters - 10 to 19 (%)
Housing units in structures - Renters - 20 to 49 (%)
Housing units in structures - Renters - 50 or more (%)
Housing units in structures - Renters - Mobile home (%)
Housing units in structures - Renters - Boat, RV, van, etc. (%)
House/condo owner moved in on average (years ago)
Renter moved in on average (years ago)
Year householder moved into unit - Moved in 1999 to March 2000 (%)
Year householder moved into unit - Moved in 1999 to March 2000 (%) - White
Year householder moved into unit - Moved in 1999 to March 2000 (%) - Black or African American
Year householder moved into unit - Moved in 1999 to March 2000 (%) - Asian
Year householder moved into unit - Moved in 1999 to March 2000 (%) - Hispanic or Latino
Year householder moved into unit - Moved in 1999 to March 2000 (%) - American Indian and Alaska Native
Year householder moved into unit - Moved in 1999 to March 2000 (%) - Multirace
Year householder moved into unit - Moved in 1999 to March 2000 (%) - Other Race
Year householder moved into unit - Moved in 1995 to 1998 (%)
Year householder moved into unit - Moved in 1995 to 1998 (%) - White
Year householder moved into unit - Moved in 1995 to 1998 (%) - Black or African American
Year householder moved into unit - Moved in 1995 to 1998 (%) - Asian
Year householder moved into unit - Moved in 1995 to 1998 (%) - Hispanic or Latino
Year householder moved into unit - Moved in 1995 to 1998 (%) - American Indian and Alaska Native
Year householder moved into unit - Moved in 1995 to 1998 (%) - Multirace
Year householder moved into unit - Moved in 1995 to 1998 (%) - Other Race
Year householder moved into unit - Moved in 1990 to 1994 (%)
Year householder moved into unit - Moved in 1990 to 1994 (%) - White
Year householder moved into unit - Moved in 1990 to 1994 (%) - Black or African American
Year householder moved into unit - Moved in 1990 to 1994 (%) - Asian
Year householder moved into unit - Moved in 1990 to 1994 (%) - Hispanic or Latino
Year householder moved into unit - Moved in 1990 to 1994 (%) - American Indian and Alaska Native
Year householder moved into unit - Moved in 1990 to 1994 (%) - Multirace
Year householder moved into unit - Moved in 1990 to 1994 (%) - Other Race
Year householder moved into unit - Moved in 1980 to 1989 (%)
Year householder moved into unit - Moved in 1980 to 1989 (%) - White
Year householder moved into unit - Moved in 1980 to 1989 (%) - Black or African American
Year householder moved into unit - Moved in 1980 to 1989 (%) - Asian
Year householder moved into unit - Moved in 1980 to 1989 (%) - Hispanic or Latino
Year householder moved into unit - Moved in 1980 to 1989 (%) - American Indian and Alaska Native
Year householder moved into unit - Moved in 1980 to 1989 (%) - Multirace
Year householder moved into unit - Moved in 1980 to 1989 (%) - Other Race
Year householder moved into unit - Moved in 1970 to 1979 (%)
Year householder moved into unit - Moved in 1970 to 1979 (%) - White
Year householder moved into unit - Moved in 1970 to 1979 (%) - Black or African American
Year householder moved into unit - Moved in 1970 to 1979 (%) - Asian
Year householder moved into unit - Moved in 1970 to 1979 (%) - Hispanic or Latino
Year householder moved into unit - Moved in 1970 to 1979 (%) - American Indian and Alaska Native
Year householder moved into unit - Moved in 1970 to 1979 (%) - Multirace
Year householder moved into unit - Moved in 1970 to 1979 (%) - Other Race
Year householder moved into unit - Moved in 1969 or earlier (%)
Year householder moved into unit - Moved in 1969 or earlier (%) - White
Year householder moved into unit - Moved in 1969 or earlier (%) - Black or African American
Year householder moved into unit - Moved in 1969 or earlier (%) - Asian
Year householder moved into unit - Moved in 1969 or earlier (%) - Hispanic or Latino
Year householder moved into unit - Moved in 1969 or earlier (%) - American Indian and Alaska Native
Year householder moved into unit - Moved in 1969 or earlier (%) - Multirace
Year householder moved into unit - Moved in 1969 or earlier (%) - Other Race
Housing units lacking complete plumbing facilities (%)
Housing units lacking complete kitchen facilities (%)
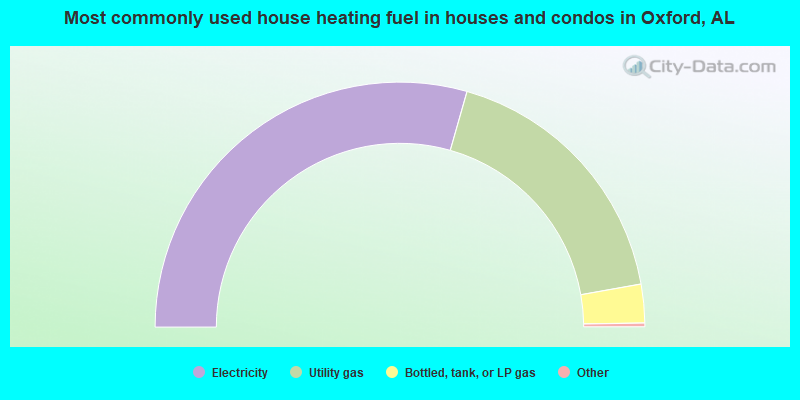
House heating fuel used in houses and condos - Utility gas (%)
House heating fuel used in houses and condos - Bottled, tank, or LP gas (%)
House heating fuel used in houses and condos - Electricity (%)
House heating fuel used in houses and condos - Fuel oil, kerosene, etc. (%)
House heating fuel used in houses and condos - Coal or coke (%)
House heating fuel used in houses and condos - Wood (%)
House heating fuel used in houses and condos - Solar energy (%)
House heating fuel used in houses and condos - Other fuel (%)
House heating fuel used in houses and condos - No fuel used (%)
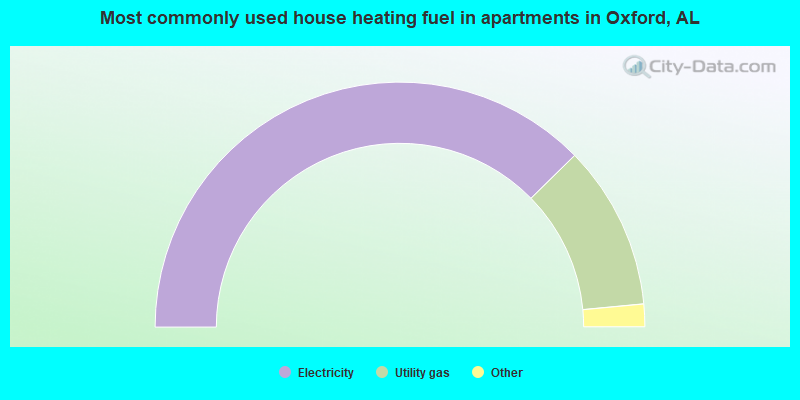
House heating fuel used in apartments - Utility gas (%)
House heating fuel used in apartments - Bottled, tank, or LP gas (%)
House heating fuel used in apartments - Electricity (%)
House heating fuel used in apartments - Fuel oil, kerosene, etc. (%)
House heating fuel used in apartments - Coal or coke (%)
House heating fuel used in apartments - Wood (%)
House heating fuel used in apartments - Solar energy (%)
House heating fuel used in apartments - Other fuel (%)
House heating fuel used in apartments - No fuel used (%)
Latest news about housing in Oxford, AL collected exclusively by city-data.com from local newspapers, TV, and radio stations
Median year house/condo built: 1986Median year apartment built: 1988Household type by relationship:
Households: 21,948
Male householders: 3,844 (1,266 living alone ), Female householders: 4,306 (1,032 living alone )3,892 spouses (3,869 opposite-sex spouses ), 561 unmarried partners , (561 opposite-sex unmarried partners ), 6,086 children (5,490 natural , 237 adopted , 358 stepchildren ), 1,084 grandchildren , 175 brothers or sisters , 376 parents , 25 foster children , 299 other relatives , 983 non-relatives In group quarters: 311
Size of family households: 2,504 2-persons , 1,864 3-persons , 679 4-persons , 517 5-persons , 100 6-persons , 65 7-or-more-persons .
Size of nonfamily households: 2,357 1-person , 321 2-persons , 92 3-persons .
1,915 married couples with children. single-parent households (143 men , 2,025 women ).
91.2% of residents of Oxford speak English at home. of residents speak Spanish at home (36% speak English very well , 49% speak English well , 9% speak English not well , 6% don't speak English at all ).of residents speak other Indo-European language at home (49% speak English very well , 16% speak English well , 35% speak English not well ).of residents speak Asian or Pacific Island language at home (80% speak English very well , 4% speak English well , 16% speak English not well ).of residents speak other language at home (100% speak English very well ).
Foreign born population: 843 (3.8%)of them are naturalized citizens )
Median number of rooms in houses and condos:
Median number of rooms in apartments
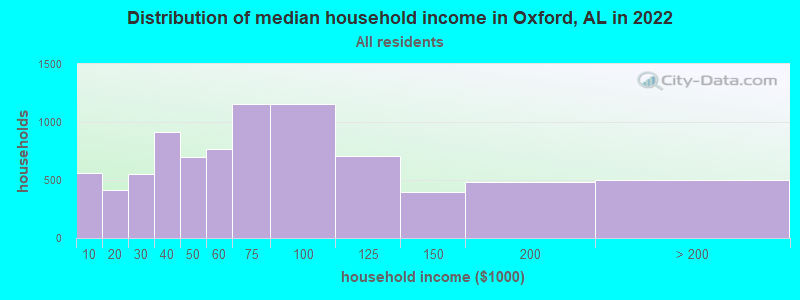
Oxford, AL household income distribution 563 Less than $10,000414 $10,000 to $19,999556 $20,000 to $29,999911 $30,000 to $39,999699 $40,000 to $49,999765 $50,000 to $59,9991,159 $60,000 to $74,9991,153 $75,000 to $99,999710 $100,000 to $124,999398 $125,000 to $149,999483 $150,000 to $199,999500 $200,000 or more
Home value of owner - occupied houses in 2022 in Oxford, AL 147 Less than $10,00053 $10,000 to $14,99977 $15,000 to $19,9996 $25,000 to $29,99964 $30,000 to $34,99951 $35,000 to $39,9997 $40,000 to $49,99983 $50,000 to $59,99942 $60,000 to $69,99982 $70,000 to $79,999178 $80,000 to $89,99999 $90,000 to $99,999830 $100,000 to $124,999803 $125,000 to $149,999668 $150,000 to $174,999787 $175,000 to $199,999702 $200,000 to $249,999589 $250,000 to $299,999372 $300,000 to $399,999328 $400,000 to $499,999316 $500,000 to $749,99950 $750,000 to $999,9998 $1,500,000 to $1,999,999Rent paid by renters in 2022 in Oxford, AL 4 Less than $10014 $100 to $1495 $150 to $19972 $200 to $24938 $250 to $29977 $300 to $34962 $350 to $39933 $400 to $449124 $450 to $499244 $500 to $54983 $550 to $599102 $600 to $649124 $650 to $699301 $700 to $74959 $750 to $799197 $800 to $89999 $900 to $99964 $1,000 to $1,24951 $1,250 to $1,49912 $1,500 to $1,999195 No cash rent
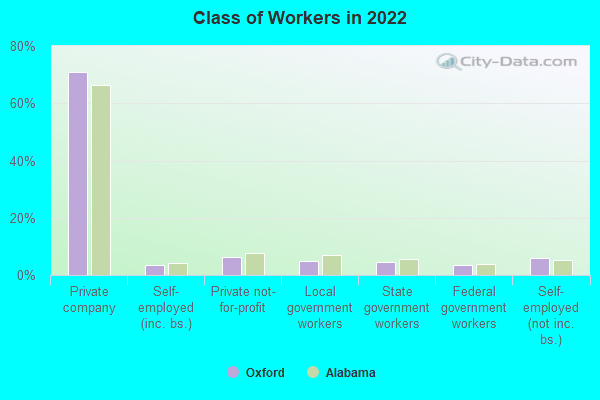
Percentage of workers working in this county: 59.2%Number of people working at home: 447 (4.2% of all workers )
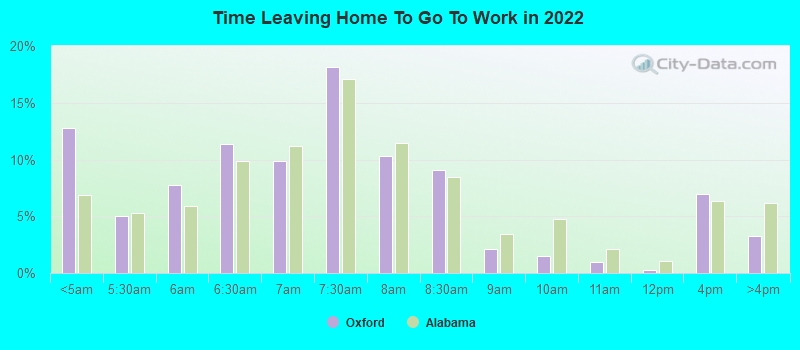
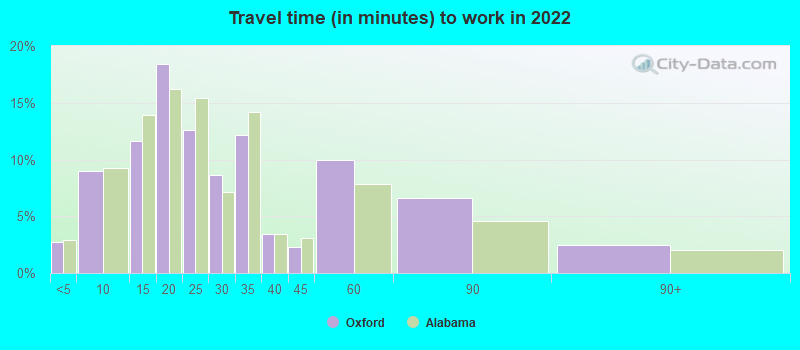
Travel time to work (commute)
Less than 5 minutes: 3225 to 9 minutes: 92610 to 14 minutes: 1,36115 to 19 minutes: 2,31020 to 24 minutes: 1,37025 to 29 minutes: 39130 to 34 minutes: 86535 to 39 minutes: 16240 to 44 minutes: 28145 to 59 minutes: 41860 to 89 minutes: 60590 or more minutes: 364
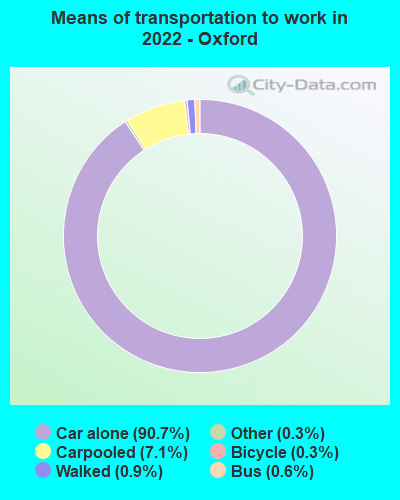
Means of transportation to work:
Drove a car alone: 9,898 (85.6%)Carpooled: 786 (6.8%)Bus : 55 (0.5%)Taxi: 45 (0.4%)Bicycle: 30 (0.3%)Walked: 108 (0.9%)Worked at home: 447 (3.9%)
Unemployment by race in 2022
Unemployment rate for White non-Hispanic residents 3.0% Males4.2% FemalesUnemployment rate for Black residents 2.4% Males8.3% FemalesUnemployment rate for Asian residents 22.2% FemalesUnemployment rate for two or more race residents 6.7% Males18.2% FemalesUnemployment rate for Hispanic or Latino residents 7.8% Males
Year of entry for the foreign-born population in Oxford, Alabama
84 2010 or later 347 2000 to 2009 337 1990 to 1999 86 1980 to 1989 7 1970 to 1979 124 Before 1970
First ancestries reported:
American: 2,321 (20.1%)
English: 1,774 (15.4%)
Irish: 997 (8.7%)
Scottish: 531 (4.6%)
German: 328 (2.8%)
European: 239 (2.1%)
West Indian: 140 (1.2%)
French: 122 (1.1%)
African: 104 (0.9%)
Italian: 85 (0.7%)
British: 61 (0.5%)
Polish: 54 (0.5%)
Scotch-Irish: 53 (0.5%)
Norwegian: 51 (0.4%)
Welsh: 48 (0.4%)
Greek: 40 (0.3%)
Dutch: 22 (0.2%)
Russian: 21 (0.2%)
Swedish: 21 (0.2%)
Canadian: 18 (0.2%)
Armenian: 15 (0.1%)
Eastern European: 11 (0.10%)
Scandinavian: 10 (0.09%)
Czech: 9 (0.08%) Most common places of birth for foreign-born residents (%): Mexico Oxford:
55.0% (536)Alabama:
26.4% (46,832)
Honduras Oxford:
8.7% (85)Alabama:
1.9% (3,447)
India Oxford:
6.6% (64)Alabama:
5.5% (9,672)
Philippines Oxford:
6.4% (62)Alabama:
2.9% (5,154)
Canada Oxford:
4.6% (45)Alabama:
2.3% (4,000)
Germany Oxford:
4.3% (42)Alabama:
3.9% (6,831)
Spain Oxford:
3.9% (38)Alabama:
0.3% (477)
Grenada Oxford:
2.4% (23)Alabama:
0.1% (99)
Vietnam Oxford:
1.6% (16)Alabama:
3.6% (6,414)
United Kingdom, excluding England and Scotland Oxford:
1.5% (15)Alabama:
1.2% (2,088)
Place of birth for U.S.-born residents:
This state: 15,177Other state: 5,502Northeast: 532Midwest: 576South: 3,973West: 498 85.4% of Oxford residents lived in the same house 1 years ago.
Out of people who lived in different houses, 37.4% lived in this county.
Out of people who lived in different counties, 60.5% lived in Alabama.
Oxford:
85.4%State average:
87.6%
Education attainment for males 25 years and older:
No schooling: 280Nursery to 4th grade: 85th and 6th grade: 627th and 8th grade: 1059th grade: 17610th grade: 23411th grade: 26612th grade, no diploma: 254High school graduate (or equivalency): 2,502Less than 1 year of college: 567Some college more than 1 year, no degree: 1,204Associate degree: 803Bachelor's degree: 1,041Master's degree: 257Professional school degree: 131Doctorate degree: 61
Education attainment for females 25 years and older:
No schooling: 171Nursery to 4th grade: 05th and 6th grade: 907th and 8th grade: 699th grade: 13510th grade: 7111th grade: 24512th grade, no diploma: 56High school graduate (or equivalency): 1,909Less than 1 year of college: 672Some college more than 1 year, no degree: 1,005Associate degree: 783Bachelor's degree: 1,615Master's degree: 660Professional school degree: 53Doctorate degree: 95
Housing units in structures:
One, detached: 6,985One, attached: 181Two: 853 or 4: 1745 to 9: 42310 to 19: 4520 to 49: 10750 or more: 19Mobile homes: 1,069Median worth of mobile homes: $20,531
Housing units lacking complete plumbing facilities in 2022: 2.1%Housing units lacking complete kitchen facilities in 2022: 2.5%House/condo owner moved in on average 10 years ago
Renter moved in on average 4 years ago
Private vs. public school enrollment:
Students in private schools in grades 1 to 8 (elementary and middle school): 357 Students in private schools in grades 9 to 12 (high school): 186 Students in private undergraduate colleges: 181