Orion, IL (Illinois) Houses and Residents
| Orion: | $171,311 |
| Illinois: | $251,600 |
Total population: 1,833 (Urban population: 0, Rural population: 1,696 (all nonfarm))
Houses: 705 (685 occupied: 543 owner occupied, 150 renter occupied)
| % of renters here: | 22% |
| State: | 33% |
Housing density: 819 houses/condos per square mile
Median price asked for vacant for-sale houses and condos in 2022 in this county: $76,206.
Median contract rent in 2022: $624 (lower quartile is $437, upper quartile is $851)
Median rent asked for vacant for-rent units in 2022: $585
Median gross rent in Orion, IL in 2022: $895
Housing units in Orion with a mortgage: 341 (38 second mortgage, 0 home equity loan, 32 both second mortgage and home equity loan)
Houses without a mortgage: 0
Median household income for houses/condos with a mortgage: $110,938
Median household income for apartments without a mortgage: $73,978
Median monthly housing costs: $974
Compare current foreclosures near Orion, IL:
| Photo | Address | Area | Beds / Baths | Price | Details |
|---|---|---|---|---|---|

|
#1
Us Highway 150
Orion, IL 61273
|
600 sq. feet
|
1 baths 2 beds |
show details | |

|
#2
13th St
Orion, IL 61273
|
- sq. feet
|
- baths - beds |
show details | |

|
#3
23rd Ave
Rock Island, IL 61201
|
735 sq. feet
|
1 baths 2 beds |
$107,900
|
show details |

|
#4
101st Avenue Ct W
Rock Island, IL 61201
|
988 sq. feet
|
1 baths 3 beds |
$138,000
|
show details |

|
#5
Redwood Ave
Davenport, IA 52802
|
1,020 sq. feet
|
1 baths 3 beds |
$178,000
|
show details |

|
#6
9th Ave N
East Moline, IL 61244
|
1,492 sq. feet
|
1 baths 3 beds |
$235,000
|
show details |

|
#7
27th St
Rock Island, IL 61201
|
1,275 sq. feet
|
1 baths 3 beds |
$195,000
|
show details |

|
#8
38th St Apt 12
Rock Island, IL 61201
|
1,008 sq. feet
|
1 baths 2 beds |
$89,900
|
show details |

|
#9
47th Ave
Rock Island, IL 61201
|
733 sq. feet
|
1 baths 1 beds |
$102,500
|
show details |

|
#10
W 16th St
Davenport, IA 52804
|
- sq. feet
|
1 baths 3 beds |
$53,550
|
show details |
| Photo | Address | Area | Beds / Baths | Price | Details |
|---|---|---|---|---|---|

|
#11
163rd St N
East Moline, IL 61244
|
- sq. feet
|
1 baths 2 beds |
$46,800
|
show details |

|
#12
44th St
Rock Island, IL 61201
|
1,721 sq. feet
|
2 baths 3 beds |
show details | |

|
#13
N College Ave
Geneseo, IL 61254
|
1,584 sq. feet
|
2 baths 3 beds |
show details | |

|
#14
95th Ave W
Rock Island, IL 61201
|
- sq. feet
|
1 baths 3 beds |
show details | |

|
#15
12th Ave
Moline, IL 61265
|
- sq. feet
|
2 baths 3 beds |
show details | |

|
#16
11th St
Rock Island, IL 61201
|
790 sq. feet
|
1 baths 2 beds |
show details | |

|
#17
14th Ave
Silvis, IL 61282
|
858 sq. feet
|
1 baths 3 beds |
show details | |

|
#18
9th St
Rock Island, IL 61201
|
828 sq. feet
|
1 baths 3 beds |
show details | |

|
#19
32nd Ave
Moline, IL 61265
|
936 sq. feet
|
1 baths 3 beds |
show details | |

|
#20
18th Street B # B
Moline, IL 61265
|
- sq. feet
|
2 baths 3 beds |
show details |
| Photo | Address | Area | Beds / Baths | Price | Details |
|---|---|---|---|---|---|

|
#21
30th St
Rock Island, IL 61201
|
1,226 sq. feet
|
1 baths 3 beds |
show details | |

|
#22
21st Ave
Moline, IL 61265
|
1,458 sq. feet
|
2 baths 4 beds |
show details | |

|
#23
Kings Dr
Bettendorf, IA 52722
|
1,464 sq. feet
|
1 baths 3 beds |
show details | |

|
#24
50th Ave
Moline, IL 61265
|
- sq. feet
|
1 baths 3 beds |
show details | |

|
#25
E High St
Davenport, IA 52803
|
1,239 sq. feet
|
2 baths 3 beds |
show details | |

|
#26
Cleveland Rd
Colona, IL 61241
|
912 sq. feet
|
1 baths 2 beds |
show details | |

|
#27
Wakonda Dr
Bettendorf, IA 52722
|
1,020 sq. feet
|
1 baths 3 beds |
show details | |

|
#28
18th St
Bettendorf, IA 52722
|
925 sq. feet
|
1 baths 4 beds |
show details | |

|
#29
Queens Ct
Bettendorf, IA 52722
|
1,320 sq. feet
|
1 baths 3 beds |
show details | |

|
#30
Riverview Ln
Bettendorf, IA 52722
|
1,451 sq. feet
|
1 baths 4 beds |
show details |
| Photo | Address | Area | Beds / Baths | Price | Details |
|---|---|---|---|---|---|

|
#31
Meadow Ln
Colona, IL 61241
|
1,392 sq. feet
|
1 baths 3 beds |
show details | |

|
#32
15th St
Bettendorf, IA 52722
|
1,694 sq. feet
|
1 baths 3 beds |
show details | |

|
#33
17th Ave
Bettendorf, IA 52722
|
3,065 sq. feet
|
1 baths 4 beds |
show details | |

|
#34
Central Ave
Bettendorf, IA 52722
|
1,158 sq. feet
|
1 baths 4 beds |
show details | |

|
#35
19th Ave
Rock Island, IL 61201
|
1,959 sq. feet
|
1 baths - beds |
show details | |

|
#36
Us Highway 150
Alpha, IL 61413
|
1,288 sq. feet
|
1 baths 3 beds |
show details | |

|
#37
56th Avenue Ct E
Bettendorf, IA 52722
|
3,026 sq. feet
|
1 baths 5 beds |
show details | |

|
#38
Cypress Dr
Colona, IL 61241
|
1,396 sq. feet
|
1 baths 3 beds |
show details | |

|
#39
Rustic Lake Dr
Colona, IL 61241
|
2,860 sq. feet
|
1 baths 4 beds |
show details | |

|
#40
Talbot Rd
Geneseo, IL 61254
|
1,520 sq. feet
|
1 baths 2 beds |
show details |
| Photo | Address | Area | Beds / Baths | Price | Details |
|---|---|---|---|---|---|

|
#41
S 11th St
Le Claire, IA 52753
|
1,028 sq. feet
|
1 baths 4 beds |
show details | |

|
#42
Lake Lynnwood
Lynn Center, IL 61262
|
3,256 sq. feet
|
1 baths 4 beds |
show details | |

|
#43
23rd Ave
Rock Island, IL 61201
|
768 sq. feet
|
1 baths - beds |
show details | |

|
#44
Hilltop St
Colona, IL 61241
|
2,551 sq. feet
|
1 baths 4 beds |
show details | |

|
#45
S Center St
Geneseo, IL 61254
|
1,159 sq. feet
|
1 baths 4 beds |
show details | |

|
#46
Central Ave
Bettendorf, IA 52722
|
954 sq. feet
|
1 baths 3 beds |
show details | |

|
#47
N West St
Cambridge, IL 61238
|
953 sq. feet
|
1 baths 2 beds |
show details | |

|
#48
Elk St
Cambridge, IL 61238
|
1,296 sq. feet
|
1 baths 3 beds |
show details | |

|
#49
W Center St
Cambridge, IL 61238
|
2,088 sq. feet
|
1 baths 4 beds |
show details | |

|
Check over 1 million property listings on Foreclosure.com!
|
browse all offers | |||

Latest news about housing in Orion, IL collected exclusively by city-data.com from local newspapers, TV, and radio stations

 | For One's Safety (6 replies) |

Median year apartment built: 1972
Household type by relationship:
Households: 1,938- Male householders: 344 (78 living alone), Female householders: 328 (67 living alone)
413 spouses (410 opposite-sex spouses), 26 unmarried partners, (24 opposite-sex unmarried partners), 707 children (680 natural, 1 adopted, 24 stepchildren), 57 grandchildren, 0 brothers or sisters, 0 parents, 0 foster children, 4 other relatives, 57 non-relatives
Size of family households: 159 2-persons, 110 3-persons, 152 4-persons, 57 5-persons, 14 6-persons, 5 7-or-more-persons.
Size of nonfamily households: 153 1-person, 35 2-persons.
426 married couples with children.
111 single-parent households (54 men, 57 women).
98.0% of residents of Orion speak English at home.
0.1% of residents speak Spanish at home (100% speak English very well).
0.8% of residents speak other Indo-European language at home (53% speak English very well, 33% speak English well, 13% speak English not well).
Foreign born population: 11 (0.6%)
(81.8% of them are naturalized citizens)
| Here: | 6.8 |
| State: | 6.4 |
| Here: | 5.7 |
| State: | 4.1 |

- Bedrooms in owner-occupied houses and condos in Orion, Illinois
- 0no bedroom
- 41 bedroom
- 792 bedrooms
- 3283 bedrooms
- 1214 bedrooms
- 115+ bedrooms

- Bedrooms in renter-occupied apartments in Orion, Illinois
- 8no bedroom
- 221 bedroom
- 442 bedrooms
- 733 bedrooms
- 34 bedrooms
- 05+ bedrooms

- Cars and other vehicles available in Orion in owner-occupied houses/condos
- 8no vehicle
- 1021 vehicle
- 2482 vehicles
- 1343 vehicles
- 354 vehicles
- 165+ vehicles

- Cars and other vehicles available in Orion in renter-occupied apartments
- 10no vehicle
- 651 vehicle
- 402 vehicles
- 363 vehicles
- 04 vehicles
- 05+ vehicles

- Rooms in owner-occupied houses in Orion, Illinois
- 01 room
- 42 rooms
- 33 rooms
- 314 rooms
- 615 rooms
- 1456 rooms
- 1147 rooms
- 958 rooms
- 929+ rooms

- Rooms in renter-occupied apartments in Orion, Illinois
- 61 room
- 62 rooms
- 133 rooms
- 354 rooms
- 95 rooms
- 206 rooms
- 447 rooms
- 128 rooms
- 59+ rooms


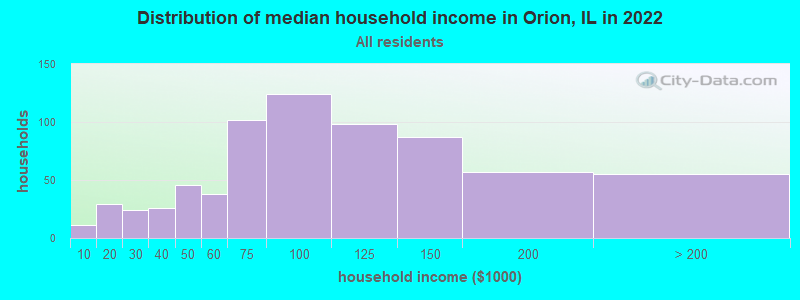
Orion, IL household income distribution

- 11Less than $10,000
- 29$10,000 to $19,999
- 24$20,000 to $29,999
- 26$30,000 to $39,999
- 46$40,000 to $49,999
- 38$50,000 to $59,999
- 102$60,000 to $74,999
- 124$75,000 to $99,999
- 98$100,000 to $124,999
- 87$125,000 to $149,999
- 57$150,000 to $199,999
- 55$200,000 or more
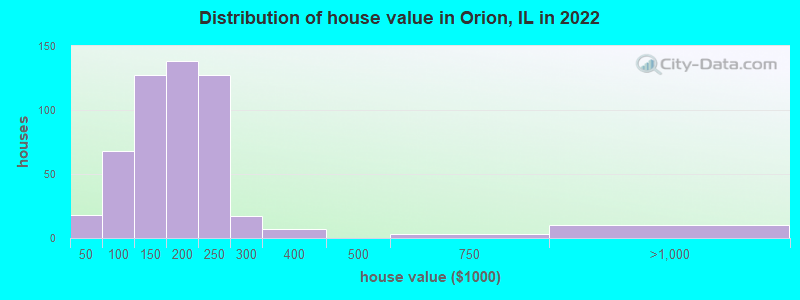
Home value of owner - occupied houses in 2022 in Orion, IL
-
- 6$15,000 to $19,999
- 3$20,000 to $24,999
- 0$30,000 to $34,999
- 7$35,000 to $39,999
- 28$60,000 to $69,999
- 13$70,000 to $79,999
- 4$80,000 to $89,999
- 21$90,000 to $99,999
- 34$100,000 to $124,999
- 92$125,000 to $149,999
- 81$150,000 to $174,999
- 56$175,000 to $199,999
- 127$200,000 to $249,999
- 17$250,000 to $299,999
- 6$300,000 to $399,999
- 3$500,000 to $749,999
- 9$750,000 to $999,999
Rent paid by renters in 2022 in Orion, IL
-
- 2$200 to $249
- 19$250 to $299
- 3$300 to $349
- 12$400 to $449
- 6$450 to $499
- 14$500 to $549
- 7$550 to $599
- 4$600 to $649
- 2$650 to $699
- 17$700 to $749
- 28$800 to $899
- 1$900 to $999
- 18$1,000 to $1,249
- 2$1,250 to $1,499
- 7No cash rent


Percentage of workers working in this county: 31.0%
Number of people working at home: 76 (8.1% of all workers)
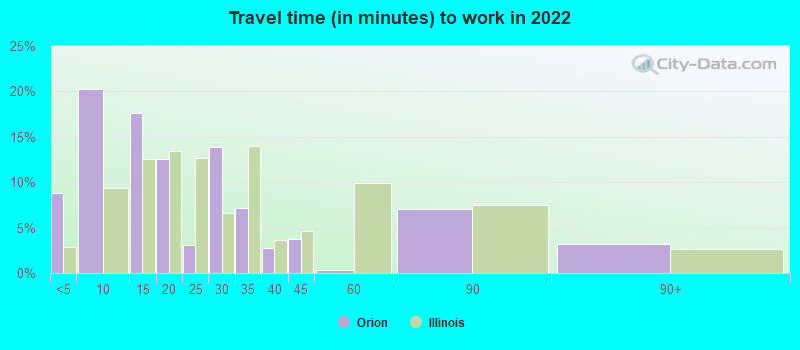
Travel time to work (commute)
- Less than 5 minutes: 68
- 5 to 9 minutes: 87
- 10 to 14 minutes: 43
- 15 to 19 minutes: 67
- 20 to 24 minutes: 192
- 25 to 29 minutes: 114
- 30 to 34 minutes: 140
- 35 to 39 minutes: 70
- 40 to 44 minutes: 27
- 45 to 59 minutes: 29
- 60 to 89 minutes: 10
- 90 or more minutes: 0
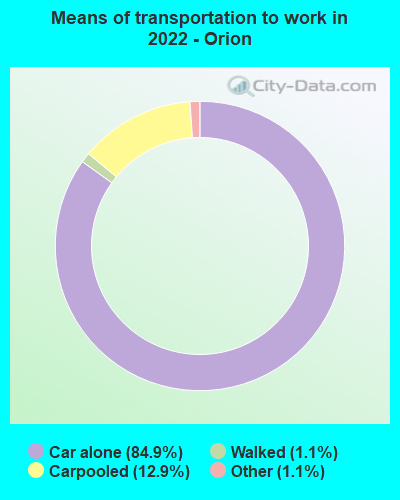
Means of transportation to work:
- Drove a car alone: 450 (73.9%)
- Carpooled: 73 (12.0%)
- Taxi: 6 (1.0%)
- Walked: 5 (0.8%)
- Worked at home: 76 (12.5%)

- Unemployment by race in 2022
- Unemployment rate for White non-Hispanic residents
- 0.8%Males
- 1.7%Females
- Unemployment rate for two or more race residents
- 69.2%Males

- Year of entry for the foreign-born population in Orion, Illinois
- 22010 or later
- 02000 to 2009
- 01990 to 1999
- 01980 to 1989
- 01970 to 1979
- 9Before 1970

First ancestries reported:
- German: 171 (28.3%)
- American: 146 (24.2%)
- Swedish: 91 (15.1%)
- Irish: 36 (6.0%)
- Belizean: 33 (5.5%)
- Belgian: 14 (2.3%)
- English: 11 (1.8%)
- Dutch: 9 (1.5%)
- European: 5 (0.8%)
- Polish: 4 (0.7%)
- British: 2 (0.3%)
- Danish: 2 (0.3%)
- French: 2 (0.3%)
- Italian: 2 (0.3%)
- Norwegian: 1 (0.2%)
- Scandinavian: 1 (0.2%)
- Scotch-Irish: 1 (0.2%)
- Scottish: 1 (0.2%)
- Welsh: 1 (0.2%)
Most common places of birth for foreign-born residents (%):
| Orion: | 90.9% (10) |
| Illinois: | 0.3% (4,639) |
| Orion: | 9.1% (1) |
| Illinois: | 0.0% (676) |
| Orion: | 9.1% (1) |
| Illinois: | 0.5% (9,671) |
Place of birth for U.S.-born residents:
- This state: 1,433
- Other state: 488
- Northeast: 11
- Midwest: 331
- South: 71
- West: 76
93.7% of Orion residents lived in the same house 1 years ago.
Out of people who lived in different houses, 10.4% lived in this county.
Out of people who lived in different counties, 75.9% lived in Illinois.
| Orion: | 93.7% |
| State average: | 88.3% |
Education attainment for males 25 years and older:
- No schooling: 0
- Nursery to 4th grade: 0
- 5th and 6th grade: 0
- 7th and 8th grade: 14
- 9th grade: 0
- 10th grade: 0
- 11th grade: 0
- 12th grade, no diploma: 17
- High school graduate (or equivalency): 186
- Less than 1 year of college: 33
- Some college more than 1 year, no degree: 103
- Associate degree: 89
- Bachelor's degree: 122
- Master's degree: 38
- Professional school degree: 1
- Doctorate degree: 3

Education attainment for females 25 years and older:
- No schooling: 0
- Nursery to 4th grade: 0
- 5th and 6th grade: 0
- 7th and 8th grade: 0
- 9th grade: 0
- 10th grade: 11
- 11th grade: 0
- 12th grade, no diploma: 0
- High school graduate (or equivalency): 130
- Less than 1 year of college: 29
- Some college more than 1 year, no degree: 123
- Associate degree: 77
- Bachelor's degree: 113
- Master's degree: 78
- Professional school degree: 10
- Doctorate degree: 5


Housing units in structures:
- One, detached: 585
- One, attached: 5
- Two: 9
- 3 or 4: 29
- 5 to 9: 35
- 10 to 19: 6
- 20 to 49: 13
- Mobile homes: 22
Housing units lacking complete kitchen facilities in 2022: 0.9%
House/condo owner moved in on average 11 years ago
Renter moved in on average 7 years ago

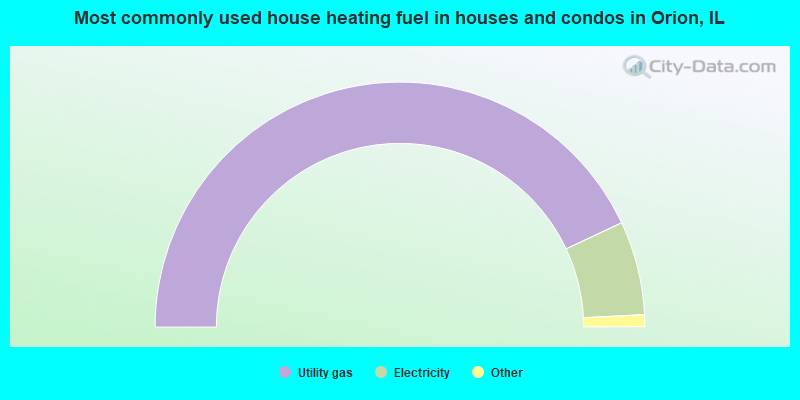
- 86.1%Utility gas
- 12.4%Electricity
- 1.1%Fuel oil, kerosene, etc.
- 0.4%Bottled, tank, or LP gas
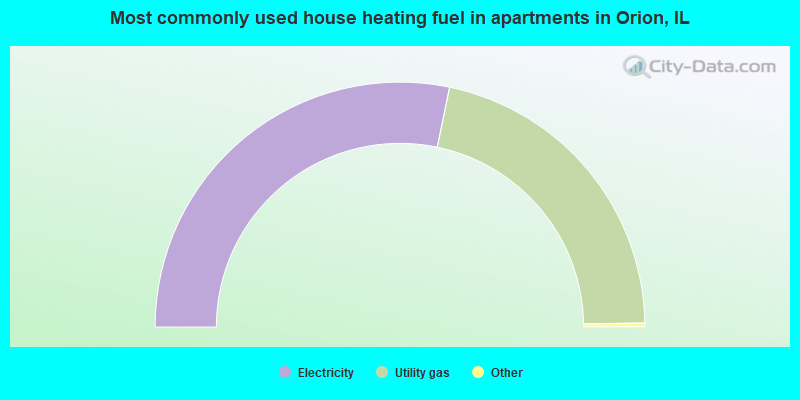
- 56.8%Electricity
- 43.2%Utility gas
Private vs. public school enrollment:
| Here: | 1.0% |
| Illinois: | 13.3% |
| Here: | 3.3% |
| Illinois: | 9.9% |
| Here: | 33.8% |
| Illinois: | 27.4% |


