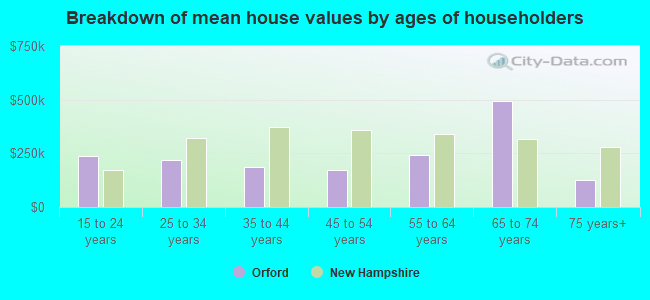
Orford, NH (New Hampshire) Houses and Residents
| Orford: | $385,785 |
| New Hampshire: | $384,700 |
Total population: 1,237 (Urban population: 0, Rural population: 1,089 (59 farm, 1,030 nonfarm))
Houses: 557 (467 occupied: 374 owner occupied, 93 renter occupied)
| % of renters here: | 20% |
| State: | 28% |
Housing density: 12 houses/condos per square mile
Median price asked for vacant for-sale houses and condos in 2022 in this county: $210,911.
Median contract rent in 2022: $1,029 (lower quartile is $904, upper quartile is $1,299)
Median gross rent in Orford, NH in 2022: $1,213
Housing units in Orford with a mortgage: 146 (12 second mortgage, 12 home equity loan, 0 both second mortgage and home equity loan)
Houses without a mortgage: 53
Compare current foreclosures near Orford, NH:
| Photo | Address | Area | Beds / Baths | Price | Details |
|---|---|---|---|---|---|

|
#1
Route 25a
Orford, NH 03777
|
2,222 sq. feet
|
2 baths 3 beds |
$564,900
|
show details |

|
#2
Adams St
Haverhill, NH 03765
|
1,017 sq. feet
|
1 baths 2 beds |
show details | |

|
#3
Hallelujah Ave
Rumney, NH 03266
|
981 sq. feet
|
1 baths 1 beds |
show details | |

|
#4
Depot St
Haverhill, NH 03765
|
- sq. feet
|
- baths - beds |
show details | |

|
#5
Nh Route 118
Warren, NH 03279
|
- sq. feet
|
- baths - beds |
show details | |

|
#6
Streeter Woods Rd
Rumney, NH 03266
|
- sq. feet
|
- baths - beds |
show details | |

|
#7
Mountain Rd
Fairlee, VT 05045
|
- sq. feet
|
- baths - beds |
show details | |

|
#8
Skyline Dr
Fairlee, VT 05045
|
- sq. feet
|
- baths - beds |
show details | |

|
#9
Erwin Rd
East Corinth, VT 05040
|
- sq. feet
|
- baths - beds |
show details | |

|
#10
Adams Dr
Woodsville, NH 03785
|
- sq. feet
|
- baths - beds |
show details |
| Photo | Address | Area | Beds / Baths | Price | Details |
|---|---|---|---|---|---|

|
#11
Wallace Hill Rd
Wells River, VT 05081
|
- sq. feet
|
- baths - beds |
show details | |

|
Check over 1 million property listings on Foreclosure.com!
|
browse all offers | |||
Latest news about housing in Orford, NH collected exclusively by city-data.com from local newspapers, TV, and radio stations

 | Relocation suggestions (30 replies) |
| Some ideas for relocation? (18 replies) |
| relocating to lebanon/hanover area (5 replies) |
| Seeking advice on New Hampshire (17 replies) |
| Finally received offer/start date at DHMC. Do I have enough time to find a place? (9 replies) |
| What town in New Hampshire most closely represents or reminds you of small town America? (857 replies) |

Household type by relationship:
Households: 82,117- In family households: 63,633 (15,537 male householders, 6,537 female householders)
17,631 spouses, 19,508 children (17,981 natural, 564 adopted, 963 stepchildren), 929 grandchildren, 338 brothers or sisters, 482 parents, foster children, 353 other relatives, 1,921 non-relatives
- In nonfamily households: 18,484 (6,671 male householders (4,834 living alone)), 7,241 female householders (5,759 living alone)), 4,572 nonrelatives
- In group quarters: 7,001 (674 institutionalized population)
12,855 married couples with children.
3,805 single-parent households (1,075 men, 2,730 women).
97.8% of residents of Orford speak English at home.
0.3% of residents speak Spanish at home (100% speak English very well).
1.4% of residents speak other Indo-European language at home (36% speak English very well, 50% speak English well, 14% speak English not well).
0.2% of residents speak Asian or Pacific Island language at home (100% speak English very well).
0.3% of residents speak other language at home (100% speak English very well).
Foreign born population: 47 (3.9%)
(102.1% of them are naturalized citizens)
| Here: | 6.4 |
| State: | 6.4 |
| Here: | 2.9 |
| State: | 4.0 |
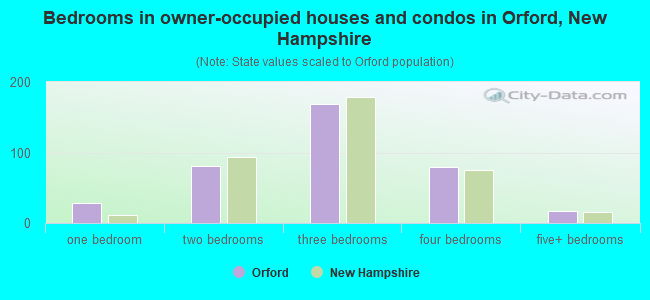
- Bedrooms in owner-occupied houses and condos in Orford, New Hampshire
- 0no bedroom
- 281 bedroom
- 812 bedrooms
- 1693 bedrooms
- 794 bedrooms
- 175+ bedrooms
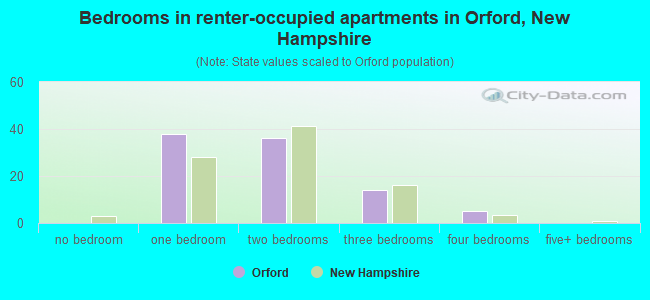
- Bedrooms in renter-occupied apartments in Orford, New Hampshire
- 0no bedroom
- 381 bedroom
- 362 bedrooms
- 143 bedrooms
- 54 bedrooms
- 05+ bedrooms
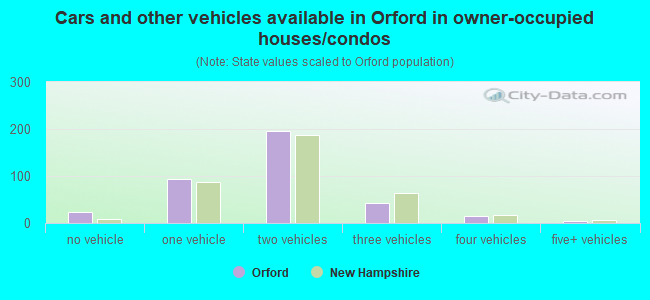
- Cars and other vehicles available in Orford in owner-occupied houses/condos
- 23no vehicle
- 931 vehicle
- 1962 vehicles
- 433 vehicles
- 154 vehicles
- 45+ vehicles
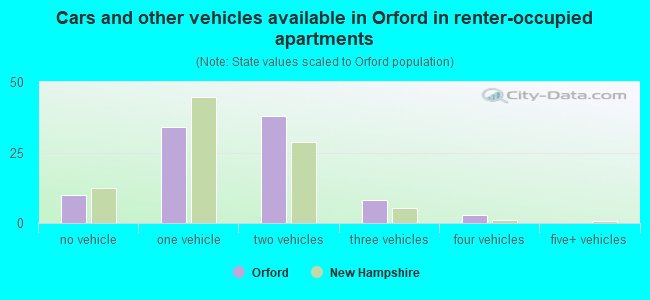
- Cars and other vehicles available in Orford in renter-occupied apartments
- 10no vehicle
- 341 vehicle
- 382 vehicles
- 83 vehicles
- 34 vehicles
- 05+ vehicles
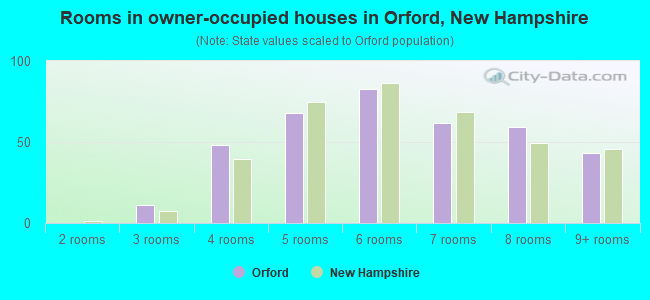
- Rooms in owner-occupied houses in Orford, New Hampshire
- 01 room
- 02 rooms
- 113 rooms
- 484 rooms
- 685 rooms
- 836 rooms
- 627 rooms
- 598 rooms
- 439+ rooms
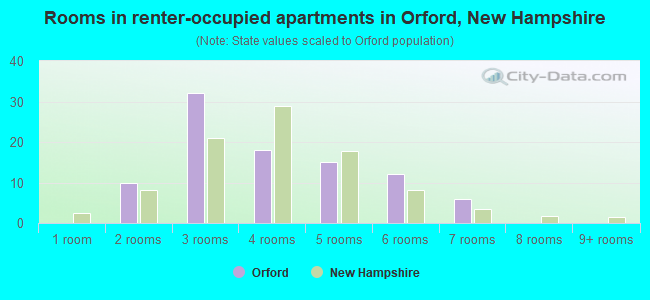
- Rooms in renter-occupied apartments in Orford, New Hampshire
- 01 room
- 102 rooms
- 323 rooms
- 184 rooms
- 155 rooms
- 126 rooms
- 67 rooms
- 08 rooms
- 09+ rooms
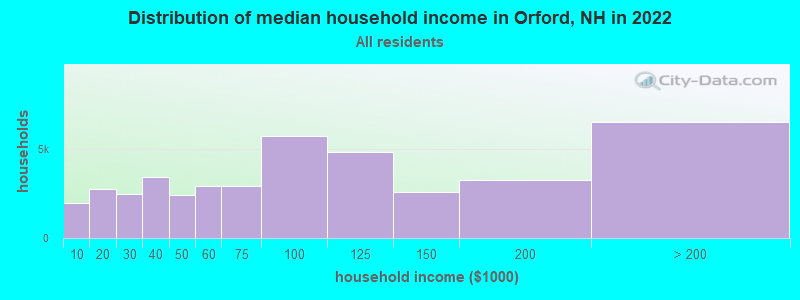
Orford, NH household income distribution

- 1,987Less than $10,000
- 2,727$10,000 to $19,999
- 2,479$20,000 to $29,999
- 3,442$30,000 to $39,999
- 2,407$40,000 to $49,999
- 2,895$50,000 to $59,999
- 2,888$60,000 to $74,999
- 5,693$75,000 to $99,999
- 4,849$100,000 to $124,999
- 2,601$125,000 to $149,999
- 3,243$150,000 to $199,999
- 6,504$200,000 or more
Percentage of workers working in this county: 81.3%
Number of people working at home: 126 (17.5% of all workers)
Travel time to work (commute)
- Less than 5 minutes: 18
- 5 to 9 minutes: 40
- 10 to 14 minutes: 51
- 15 to 19 minutes: 51
- 20 to 24 minutes: 58
- 25 to 29 minutes: 64
- 30 to 34 minutes: 155
- 35 to 39 minutes: 39
- 40 to 44 minutes: 45
- 45 to 59 minutes: 30
- 60 to 89 minutes: 17
- 90 or more minutes: 12
Means of transportation to work:
- Drove a car alone: 497 (80.6%)
- Carpooled: 63 (10.2%)
- Walked: 15 (2.4%)
- Other means: 5 (0.8%)
- Worked at home: 37 (6.0%)
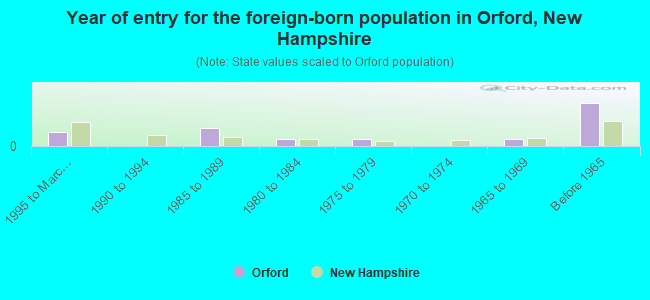
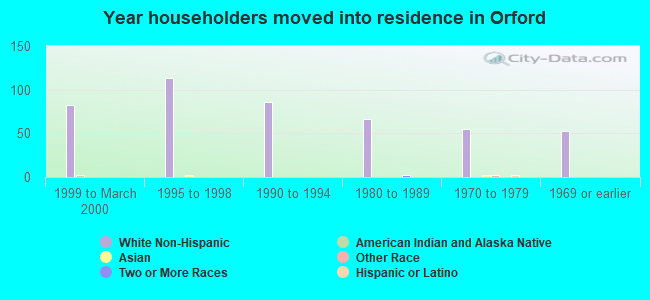
- Year of entry for the foreign-born population in Orford, New Hampshire
- 41995 to March 2000
- 01990 to 1994
- 51985 to 1989
- 21980 to 1984
- 21975 to 1979
- 01970 to 1974
- 21965 to 1969
- 12Before 1965
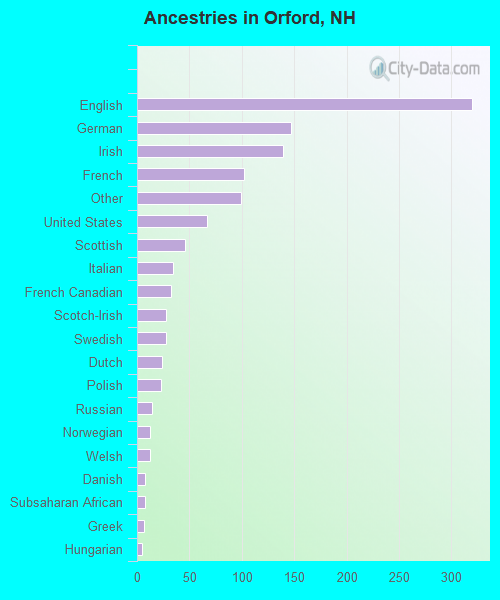
First ancestries reported:
- English: 320 (27.5%)
- German: 147 (12.7%)
- Irish: 139 (12.0%)
- French: 102 (8.8%)
- Other: 99 (8.5%)
- United States: 67 (5.8%)
- Scottish: 46 (4.0%)
- Italian: 34 (2.9%)
- French Canadian: 32 (2.8%)
- Scotch-Irish: 28 (2.4%)
- Swedish: 28 (2.4%)
- Dutch: 24 (2.1%)
- Polish: 23 (2.0%)
- Russian: 14 (1.2%)
- Norwegian: 12 (1.0%)
- Welsh: 12 (1.0%)
- Danish: 8 (0.7%)
- Subsaharan African: 8 (0.7%)
- Greek: 7 (0.6%)
- Hungarian: 5 (0.4%)
- Lithuanian: 2 (0.2%)
- Portuguese: 2 (0.2%)
- Swiss: 2 (0.2%)
- Czech: 1 (0.09%)
Most common places of birth for foreign-born residents (%):
| Orford: | 14.8% (4) |
| New Hampshire: | 8.1% (4,396) |
| Orford: | 14.8% (4) |
| New Hampshire: | 0.3% (171) |
| Orford: | 11.1% (3) |
| New Hampshire: | 22.9% (12,397) |
| Orford: | 7.4% (2) |
| New Hampshire: | 0.3% (183) |
| Orford: | 7.4% (2) |
| New Hampshire: | 3.4% (1,828) |
| Orford: | 7.4% (2) |
| New Hampshire: | 2.9% (1,582) |
| Orford: | 7.4% (2) |
| New Hampshire: | 1.9% (1,031) |
| Orford: | 7.4% (2) |
| New Hampshire: | 0.6% (314) |
| Orford: | 7.4% (2) |
| New Hampshire: | 0.0% (4) |
| Orford: | 7.4% (2) |
| New Hampshire: | 0.9% (511) |
| Orford: | 7.4% (2) |
| New Hampshire: | 0.0% (18) |
Place of birth for U.S.-born residents:
- This state: 544
- Other state: 504
- Northeast: 380
- Midwest: 38
- South: 41
- West: 45
63% of Orford residents lived in the same house 5 years ago.
Out of people who lived in different houses, 49% lived in this county.
Out of people who lived in different counties, 12% lived in New Hampshire.
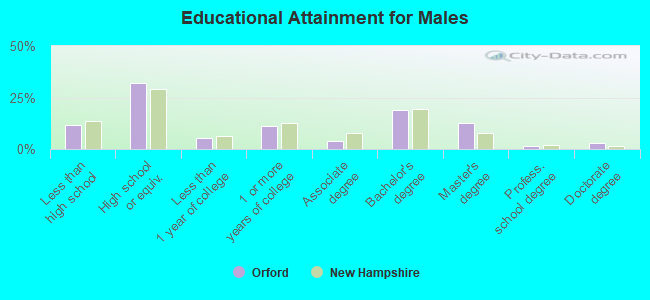
Education attainment for males 25 years and older:
- No schooling: 0
- Nursery to 4th grade: 3
- 5th and 6th grade: 0
- 7th and 8th grade: 8
- 9th grade: 12
- 10th grade: 2
- 11th grade: 9
- 12th grade, no diploma: 10
- High school graduate (or equivalency): 121
- Less than 1 year of college: 20
- Some college more than 1 year, no degree: 42
- Associate degree: 14
- Bachelor's degree: 71
- Master's degree: 47
- Professional school degree: 6
- Doctorate degree: 10
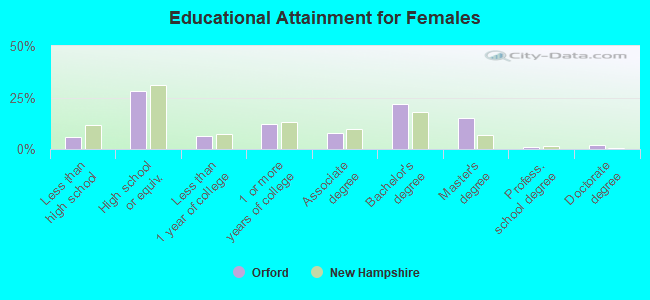
Education attainment for females 25 years and older:
- No schooling: 0
- Nursery to 4th grade: 0
- 5th and 6th grade: 0
- 7th and 8th grade: 7
- 9th grade: 3
- 10th grade: 4
- 11th grade: 4
- 12th grade, no diploma: 6
- High school graduate (or equivalency): 113
- Less than 1 year of college: 26
- Some college more than 1 year, no degree: 48
- Associate degree: 32
- Bachelor's degree: 87
- Master's degree: 61
- Professional school degree: 4
- Doctorate degree: 7
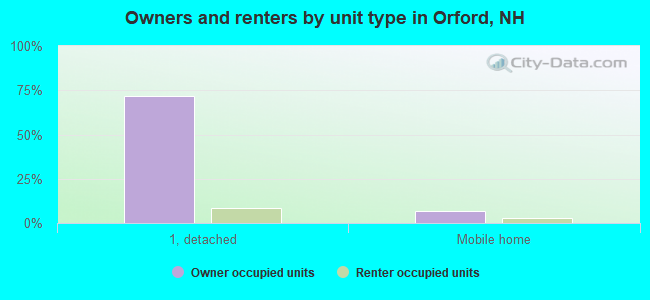
Housing units in structures:
- One, detached: 455
- One, attached: 10
- Two: 6
- 3 or 4: 10
- 5 to 9: 20
- 10 to 19: 2
- Mobile homes: 54
Median worth of mobile homes: $137,838
Housing units lacking complete kitchen facilities: 2.5%
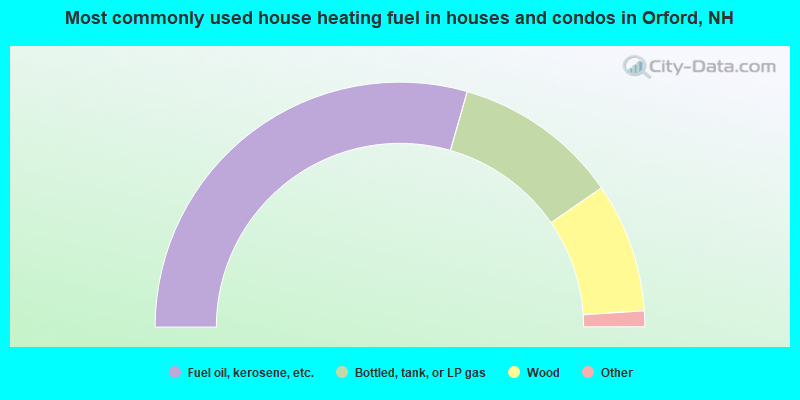
- 58.8%Fuel oil, kerosene, etc.
- 21.9%Bottled, tank, or LP gas
- 17.1%Wood
- 1.6%Electricity
- 0.5%Other fuel
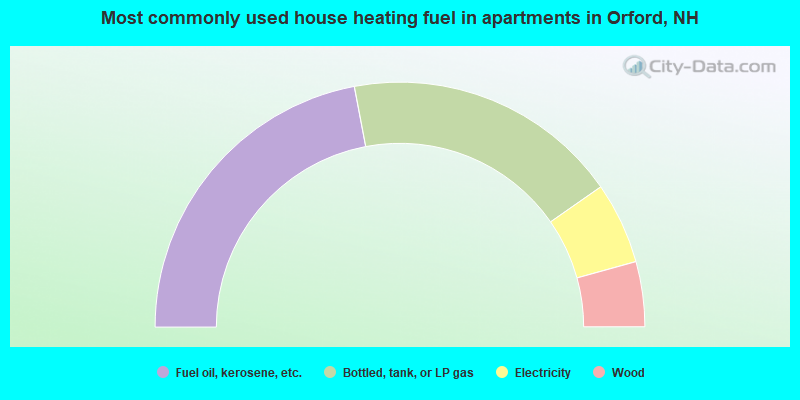
- 44.1%Fuel oil, kerosene, etc.
- 36.6%Bottled, tank, or LP gas
- 10.8%Electricity
- 8.6%Wood
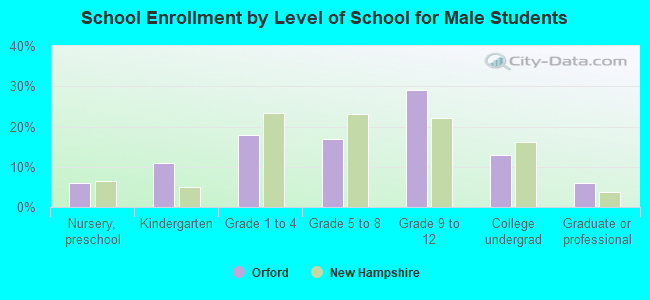
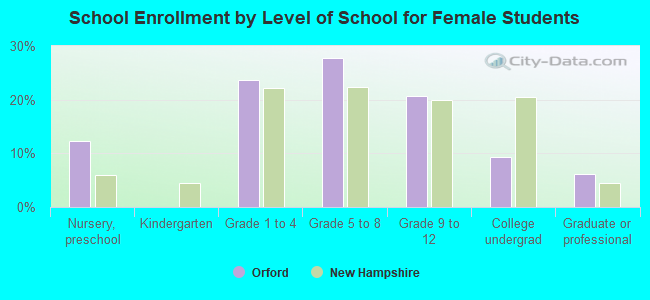
Private vs. public school enrollment:
| Here: | 0.0% |
| New Hampshire: | 8.9% |
| Here: | 10.2% |
| New Hampshire: | 10.7% |
| Here: | 45.5% |
| New Hampshire: | 36.4% |