Housing density: 2,078 houses/condos per square mile
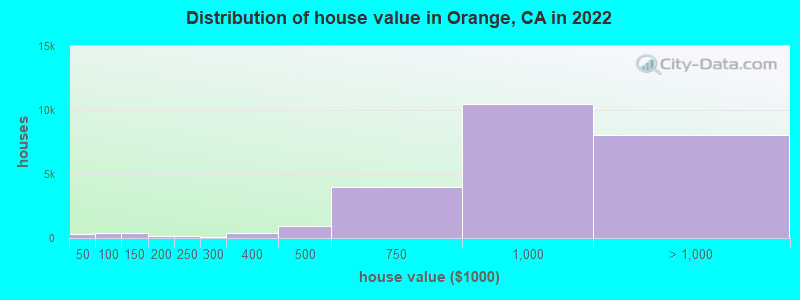
Median price asked for vacant for-sale houses and condos in 2022: $1,841,876.
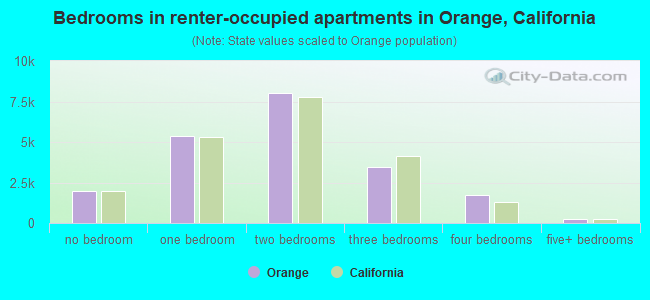
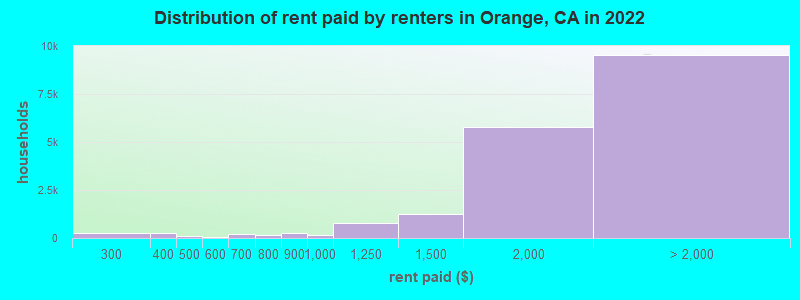
Median contract rent in 2022: $1,892 (lower quartile is $1,510, upper quartile is over $2,000)
Median rent asked for vacant for-rent units in 2022: $4,139
Median gross rent in Orange, CA in 2022: $1,973
Housing units in Orange with a mortgage: 18,071 (2,320 second mortgage, 41 home equity loan, 1,847 both second mortgage and home equity loan) Houses without a mortgage: 340
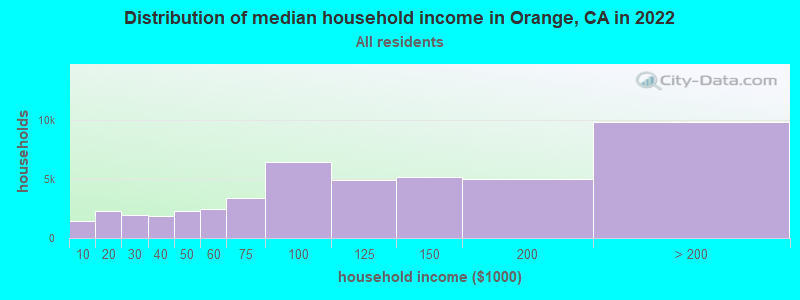
Median household income for houses/condos with a mortgage: $157,586
Median household income for apartments without a mortgage: $107,238
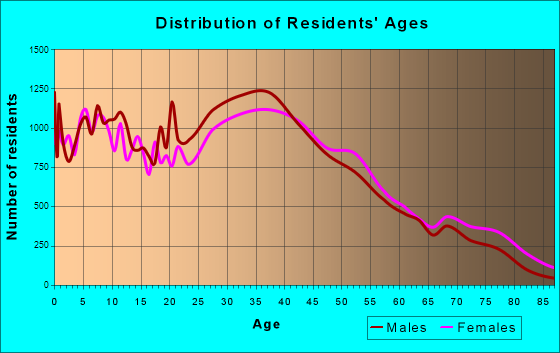
Size of family households: 12,103 2-persons, 7,005 3-persons, 7,731 4-persons, 2,968 5-persons, 1,633 6-persons, 804 7-or-more-persons.
Size of nonfamily households: 10,330 1-person, 3,605 2-persons, 984 3-persons.
16,044 married couples with children.
4,476 single-parent households (1,311 men, 3,165 women).
62.3% of residents of Orange speak English at home.
24.6% of residents speak Spanish at home (58% speak English very well, 20% speak English well, 15% speak English not well, 7% don't speak English at all).
3.3% of residents speak other Indo-European language at home (77% speak English very well, 23% speak English well).
8.8% of residents speak Asian or Pacific Island language at home (59% speak English very well, 24% speak English well, 15% speak English not well, 2% don't speak English at all).
1.0% of residents speak other language at home (93% speak English very well, 4% speak English well, 3% don't speak English at all).
Foreign born population: 30,653 (22.5%)
(58.9% of them are naturalized citizens)
Percentage of workers working in this county: 88.1% Number of people working at home: 11,832 (16.0% of all workers)
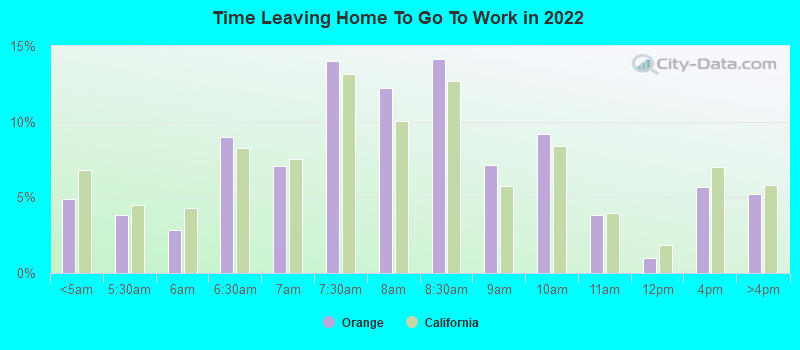
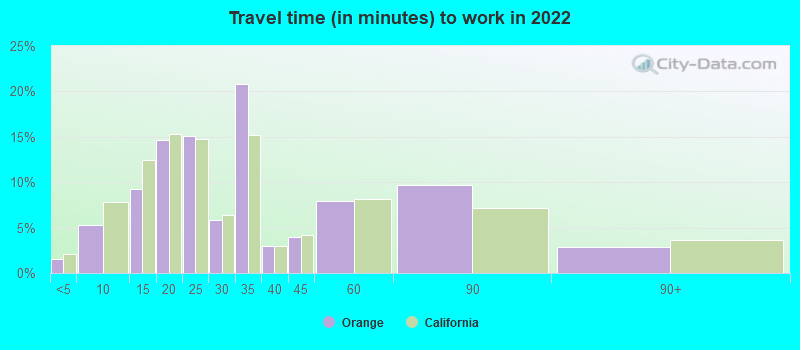
Travel time to work (commute)
Less than 5 minutes: 668
5 to 9 minutes: 3,252
10 to 14 minutes: 8,595
15 to 19 minutes: 9,457
20 to 24 minutes: 9,243
25 to 29 minutes: 5,304
30 to 34 minutes: 10,272
35 to 39 minutes: 2,038
40 to 44 minutes: 3,100
45 to 59 minutes: 4,561
60 to 89 minutes: 3,081
90 or more minutes: 2,459
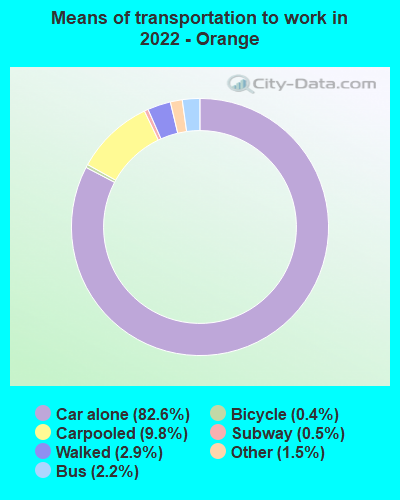
Means of transportation to work:
Drove a car alone: 73,791 (73.0%)
Carpooled: 8,717 (8.6%)
Bus: 2,003 (2.0%)
Long-distance train or commuter rail: 472 (0.5%)
Light rail, streetcar or trolley: 53 (0.1%)
Taxi: 1,349 (1.3%)
Bicycle: 377 (0.4%)
Walked: 2,550 (2.5%)
Worked at home: 11,832 (11.7%)
Unemployment by race in 2022
Unemployment rate for White non-Hispanic residents
2.6%Males
2.5%Females
Unemployment rate for Black residents
6.1%Males
7.4%Females
Unemployment rate for Asian residents
2.2%Males
2.4%Females
Unemployment rate for other race residents
5.2%Males
2.3%Females
Unemployment rate for two or more race residents
3.2%Males
8.0%Females
Unemployment rate for Hispanic or Latino residents
7.1%Males
5.4%Females
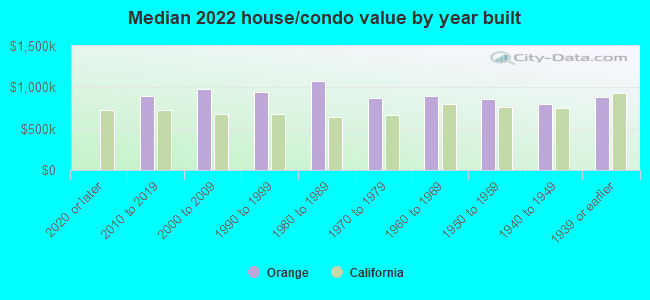
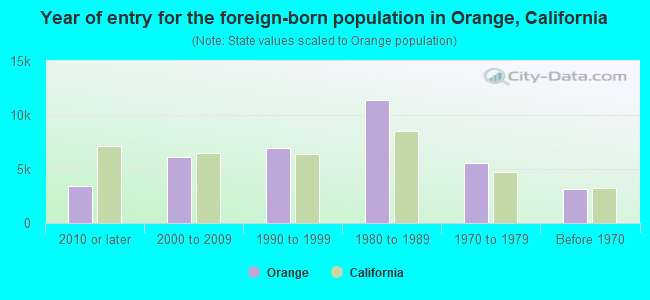
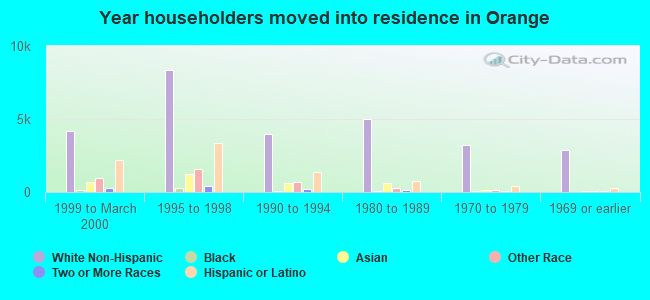
Year of entry for the foreign-born population in Orange, California
3,4292010 or later
6,1022000 to 2009
6,9551990 to 1999
11,3721980 to 1989
5,5541970 to 1979
3,160Before 1970
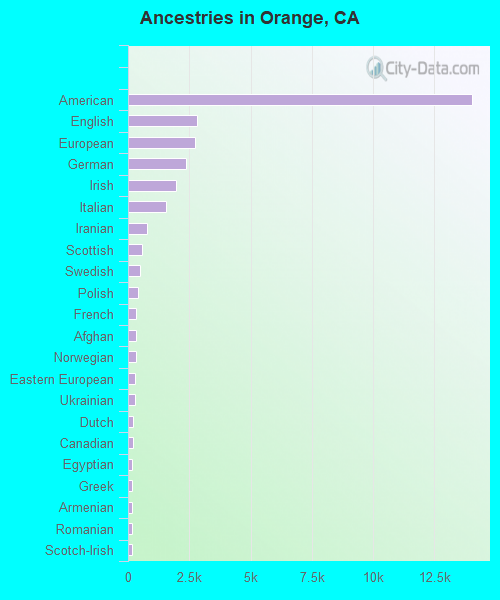
First ancestries reported:
American: 14,025 (18.4%)
English: 2,800 (3.7%)
European: 2,737 (3.6%)
German: 2,359 (3.1%)
Irish: 1,956 (2.6%)
Italian: 1,561 (2.0%)
Iranian: 794 (1.0%)
Scottish: 576 (0.8%)
Swedish: 493 (0.6%)
Polish: 405 (0.5%)
French: 334 (0.4%)
Afghan: 322 (0.4%)
Norwegian: 309 (0.4%)
Eastern European: 300 (0.4%)
Ukrainian: 297 (0.4%)
Dutch: 217 (0.3%)
Canadian: 193 (0.3%)
Egyptian: 177 (0.2%)
Greek: 174 (0.2%)
Armenian: 157 (0.2%)
Romanian: 154 (0.2%)
Scotch-Irish: 154 (0.2%)
Jordanian: 84 (0.1%)
Palestinian: 84 (0.1%)
Syrian: 81 (0.1%)
Arab: 80 (0.1%)
Kenyan: 78 (0.1%)
Finnish: 77 (0.1%)
Portuguese: 77 (0.1%)
Jamaican: 74 (0.10%)
Nigerian: 74 (0.10%)
British: 68 (0.09%)
Northern European: 62 (0.08%)
Brazilian: 53 (0.07%)
Russian: 52 (0.07%)
Lebanese: 50 (0.07%)
Hungarian: 48 (0.06%)
French Canadian: 48 (0.06%)
Scandinavian: 46 (0.06%)
African: 41 (0.05%)
Czech: 35 (0.05%)
Croatian: 33 (0.04%)
Welsh: 30 (0.04%)
Yugoslavian: 29 (0.04%)
Turkish: 29 (0.04%)
Lithuanian: 27 (0.04%)
Trinidadian and Tobagonian: 27 (0.04%)
Assyrian: 24 (0.03%)
Basque: 23 (0.03%)
Australian: 20 (0.03%)
Serbian: 20 (0.03%)
Swiss: 19 (0.02%)
Belgian: 17 (0.02%)
Somali: 16 (0.02%)
Danish: 14 (0.02%)
Carpatho Rusyn: 14 (0.02%)
Czechoslovakian: 11 (0.01%)
British West Indian: 11 (0.01%)
Slavic: 10 (0.01%)
Bulgarian: 9 (0.01%)
Slovak: 8 (0.01%)
Israeli: 6 (0.01%)
Most common places of birth for foreign-born residents (%):
Mexico
Orange:
39.3% (11,962)
California:
37.2% (3,881,193)
Philippines
Orange:
9.8% (2,986)
California:
7.8% (818,297)
Vietnam
Orange:
9.3% (2,846)
California:
4.9% (512,335)
Korea
Orange:
4.0% (1,225)
California:
3.0% (315,248)
India
Orange:
3.4% (1,047)
California:
5.2% (539,184)
Guatemala
Orange:
3.3% (1,008)
California:
2.8% (290,436)
China, excluding Hong Kong and Taiwan
Orange:
3.0% (920)
California:
6.6% (684,672)
Taiwan
Orange:
2.6% (800)
California:
1.7% (176,274)
Iran
Orange:
2.6% (782)
California:
2.0% (206,004)
El Salvador
Orange:
2.4% (723)
California:
4.2% (440,287)
Canada
Orange:
1.6% (484)
California:
1.2% (127,477)
Place of birth for U.S.-born residents:
This state: 84,234
Other state: 18,789
Northeast: 3,903
Midwest: 5,948
South: 4,995
West: 3,943
89.2% of Orange residents lived in the same house 1 years ago. Out of people who lived in different houses, 40.0% lived in this county. Out of people who lived in different counties, 67.2% lived in California.
Orange:
89.2%
State average:
88.9%
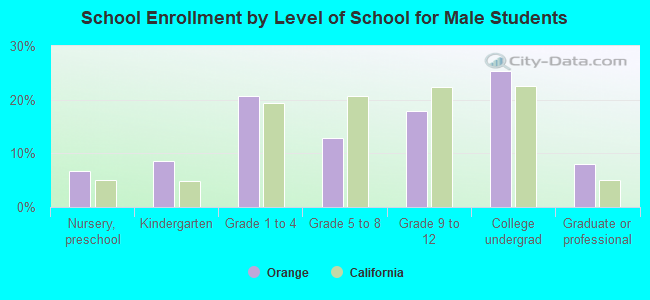
Education attainment for males 25 years and older:
No schooling: 2,117
Nursery to 4th grade: 521
5th and 6th grade: 1,279
7th and 8th grade: 673
9th grade: 295
10th grade: 361
11th grade: 541
12th grade, no diploma: 1,403
High school graduate (or equivalency): 9,591
Less than 1 year of college: 2,807
Some college more than 1 year, no degree: 8,105
Associate degree: 4,451
Bachelor's degree: 13,282
Master's degree: 3,478
Professional school degree: 1,517
Doctorate degree: 730
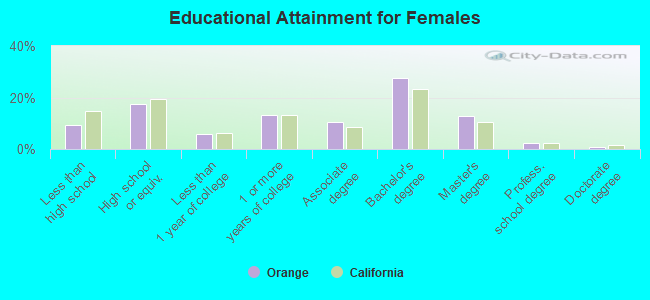
Education attainment for females 25 years and older:
No schooling: 1,735
Nursery to 4th grade: 506
5th and 6th grade: 1,002
7th and 8th grade: 191
9th grade: 160
10th grade: 48
11th grade: 232
12th grade, no diploma: 392
High school graduate (or equivalency): 8,107
Less than 1 year of college: 2,746
Some college more than 1 year, no degree: 6,113
Associate degree: 4,774
Bachelor's degree: 12,804
Master's degree: 5,915
Professional school degree: 1,125
Doctorate degree: 395
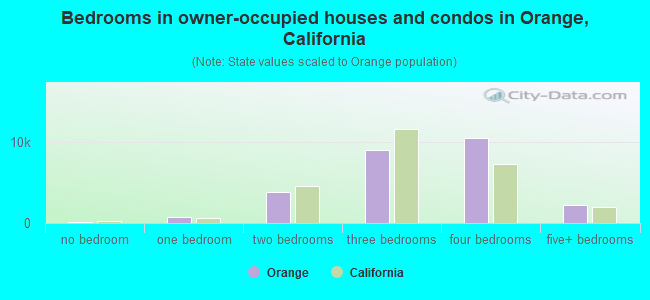
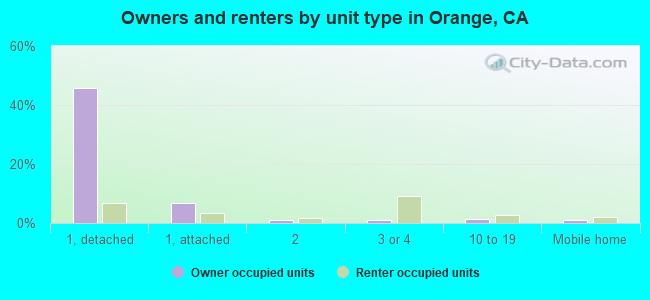
Housing units in structures:
One, detached: 26,687
One, attached: 4,035
Two: 1,077
3 or 4: 4,399
5 to 9: 1,747
10 to 19: 1,867
20 to 49: 2,039
50 or more: 5,602
Mobile homes: 1,087
Boats, RVs, vans, etc.: 78
Median worth of mobile homes: $112,000
Housing units lacking complete plumbing facilities in 2022: 1.9%
Housing units lacking complete kitchen facilities in 2022: 4.1%
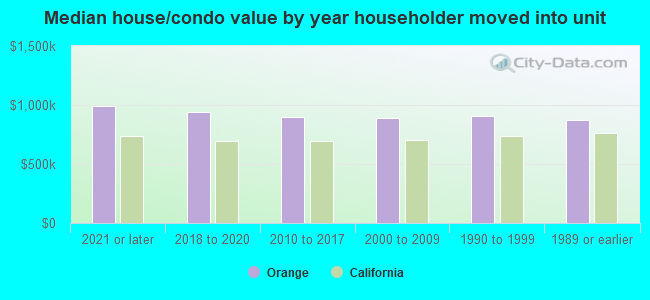
House/condo owner moved in on average 16 years ago