Only, TN (Tennessee) Houses and Residents
| Only: | $186,276 |
| Tennessee: | $284,800 |
Total population: 2,307 (Urban population: 0, Rural population: 2,178 (150 farm, 2,028 nonfarm))
Houses: 504 (424 occupied: 323 owner occupied, 101 renter occupied)
| % of renters here: | 24% |
| State: | 33% |
Housing density: 5 houses/condos per square mile
Median price asked for vacant for-sale houses and condos in 2022 in this county: $232,054.
Median contract rent in 2022: $619 (lower quartile is $479, upper quartile is $828)
Median rent asked for vacant for-rent units in 2022: $983
Median gross rent in Only, TN in 2022: $726
Housing units in Only with a mortgage: 70 (7 second mortgage, 0 home equity loan, 0 both second mortgage and home equity loan)
Houses without a mortgage: 50
Compare current foreclosures near Only, TN:
| Photo | Address | Area | Beds / Baths | Price | Details |
|---|---|---|---|---|---|

|
#1
Highway 100
Centerville, TN 37033
|
1,325 sq. feet
|
2 baths 3 beds |
show details | |

|
#2
Baggett Ln
Dickson, TN 37055
|
1,754 sq. feet
|
2 baths 3 beds |
show details | |

|
#3
Ccc Rd
Mc Ewen, TN 37101
|
2,010 sq. feet
|
1 baths 4 beds |
show details | |

|
#4
Circle Dr
Waverly, TN 37185
|
1,870 sq. feet
|
2 baths 4 beds |
show details | |

|
#5
Columbia Ave
Centerville, TN 37033
|
2,116 sq. feet
|
2 baths 4 beds |
show details | |

|
#6
Grays Bend Rd
Centerville, TN 37033
|
1,140 sq. feet
|
1 baths - beds |
show details | |

|
#7
Stephen St
Dickson, TN 37055
|
- sq. feet
|
2 baths - beds |
show details | |

|
#8
Vaden Branch Rd
Hurricane Mills, TN 37078
|
1,394 sq. feet
|
1 baths - beds |
show details | |

|
#9
Rocky Point Rd
Bon Aqua, TN 37025
|
1,632 sq. feet
|
2 baths - beds |
show details | |

|
#10
Eno Rd
Dickson, TN 37055
|
892 sq. feet
|
1 baths - beds |
show details |
| Photo | Address | Area | Beds / Baths | Price | Details |
|---|---|---|---|---|---|

|
#11
Barnette Dr
Lobelville, TN 37097
|
2,756 sq. feet
|
2 baths - beds |
show details | |

|
#12
Blakemore Rd
Dickson, TN 37055
|
1,928 sq. feet
|
2 baths - beds |
show details | |

|
#13
Plott Ln
Lyles, TN 37098
|
1,197 sq. feet
|
2 baths - beds |
show details | |

|
#14
Black Rd
Dickson, TN 37055
|
1,850 sq. feet
|
2 baths - beds |
show details | |

|
#15
Old Blacktop Rd
Mc Ewen, TN 37101
|
1,352 sq. feet
|
2 baths - beds |
show details | |

|
#16
Manley Loop
Dickson, TN 37055
|
1,866 sq. feet
|
2 baths - beds |
show details | |

|
#17
Wildcat Rd
Dickson, TN 37055
|
1,132 sq. feet
|
2 baths - beds |
show details | |

|
#18
W Dell Rd
Dickson, TN 37055
|
2,268 sq. feet
|
3 baths - beds |
show details | |

|
#19
Rye St
Mc Ewen, TN 37101
|
1,175 sq. feet
|
1 baths - beds |
show details | |

|
#20
N Hurricane Creek Rd
Mc Ewen, TN 37101
|
2,048 sq. feet
|
2 baths - beds |
show details |
| Photo | Address | Area | Beds / Baths | Price | Details |
|---|---|---|---|---|---|

|
#21
Valley Rd
Mc Ewen, TN 37101
|
1,104 sq. feet
|
2 baths - beds |
show details | |

|
#22
Urubamba Dr
Lyles, TN 37098
|
1,680 sq. feet
|
2 baths - beds |
show details | |

|
#23
Beth St
Mc Ewen, TN 37101
|
1,334 sq. feet
|
2 baths - beds |
show details | |

|
#24
Blair Blvd
Mc Ewen, TN 37101
|
1,755 sq. feet
|
2 baths - beds |
show details | |

|
#25
Grove Springs Rd
Dickson, TN 37055
|
1,728 sq. feet
|
2 baths - beds |
show details | |

|
#26
Woodland Park Cir
Nunnelly, TN 37137
|
1,050 sq. feet
|
1 baths - beds |
show details | |

|
#27
Twin Pine Rd
Dickson, TN 37055
|
1,837 sq. feet
|
2 baths - beds |
show details | |

|
#28
Robin Hood Rd
Dickson, TN 37055
|
2,242 sq. feet
|
2 baths - beds |
show details | |

|
#29
Community Rd
Nunnelly, TN 37137
|
1,784 sq. feet
|
2 baths - beds |
show details | |

|
#30
Weems Rd
Nunnelly, TN 37137
|
1,008 sq. feet
|
1 baths - beds |
show details |
| Photo | Address | Area | Beds / Baths | Price | Details |
|---|---|---|---|---|---|

|
#31
Garners Creek Rd
Dickson, TN 37055
|
896 sq. feet
|
1 baths - beds |
show details | |

|
#32
Martin Branch Rd
Mc Ewen, TN 37101
|
1,983 sq. feet
|
1 baths - beds |
show details | |

|
#33
W Railroad St
Dickson, TN 37055
|
810 sq. feet
|
1 baths - beds |
show details | |

|
#34
Ravenwood Cir
Dickson, TN 37055
|
1,200 sq. feet
|
1 baths - beds |
show details | |

|
#35
Hurt Loop
Mc Ewen, TN 37101
|
1,428 sq. feet
|
1 baths - beds |
show details | |

|
#36
Perry St
Centerville, TN 37033
|
2,709 sq. feet
|
1 baths - beds |
show details | |

|
#37
E Ward St
Centerville, TN 37033
|
1,320 sq. feet
|
1 baths - beds |
show details | |

|
#38
Grays Bend Rd
Centerville, TN 37033
|
1,494 sq. feet
|
1 baths - beds |
show details | |

|
#39
Riverside Dr
Centerville, TN 37033
|
2,099 sq. feet
|
2 baths - beds |
show details | |

|
#40
Ccc Rd
Mc Ewen, TN 37101
|
1,216 sq. feet
|
- baths - beds |
show details |
| Photo | Address | Area | Beds / Baths | Price | Details |
|---|---|---|---|---|---|

|
#41
Tracy Ln
Duck River, TN 38454
|
- sq. feet
|
- baths - beds |
show details | |

|
#42
Beasley Pointe Dr
Dickson, TN 37055
|
- sq. feet
|
- baths - beds |
show details | |

|
#43
Yellow Creek Rd # B
Dickson, TN 37055
|
- sq. feet
|
- baths - beds |
show details | |

|
#44
S Mulberry St # B100
Dickson, TN 37055
|
- sq. feet
|
- baths - beds |
show details | |

|
#45
Lower Cane Creek Rd
Centerville, TN 37033
|
- sq. feet
|
- baths - beds |
show details | |

|
#46
Duncan Cir
Lobelville, TN 37097
|
- sq. feet
|
- baths - beds |
show details | |

|
#47
Abiff Rd
Bon Aqua, TN 37025
|
1,216 sq. feet
|
- baths - beds |
show details | |

|
#48
Reeves St
Dickson, TN 37055
|
- sq. feet
|
- baths - beds |
show details | |

|
#49
Beasley Pointe Dr
Dickson, TN 37055
|
- sq. feet
|
- baths - beds |
show details | |

|
Check over 1 million property listings on Foreclosure.com!
|
browse all offers | |||

Household type by relationship:
Households: 23,177- In family households: 20,063 (4,576 male householders, 1,805 female householders)
4,809 spouses, 6,573 children (5,816 natural, 195 adopted, 562 stepchildren), 769 grandchildren, 179 brothers or sisters, 193 parents, foster children, 253 other relatives, 705 non-relatives
- In nonfamily households: 3,114 (1,343 male householders (1,083 living alone)), 1,252 female householders (1,112 living alone)), 519 nonrelatives
- In group quarters: 1,513 (1,480 institutionalized population)
3,849 married couples with children.
1,083 single-parent households (337 men, 746 women).
97.9% of residents of Only speak English at home.
1.5% of residents speak Spanish at home (59% speak English very well, 19% speak English well, 22% speak English not well).
0.6% of residents speak other Indo-European language at home (100% speak English very well).
Foreign born population: 26 (1.0%)
(0.0% of them are naturalized citizens)
| Here: | 7.6 |
| State: | 6.5 |
| Here: | 4.9 |
| State: | 4.4 |

- Bedrooms in owner-occupied houses and condos in Only, Tennessee
- 18no bedroom
- 301 bedroom
- 512 bedrooms
- 1313 bedrooms
- 564 bedrooms
- 375+ bedrooms

- Bedrooms in renter-occupied apartments in Only, Tennessee
- 0no bedroom
- 131 bedroom
- 642 bedrooms
- 183 bedrooms
- 64 bedrooms
- 05+ bedrooms

- Cars and other vehicles available in Only in owner-occupied houses/condos
- 9no vehicle
- 931 vehicle
- 1172 vehicles
- 613 vehicles
- 154 vehicles
- 285+ vehicles

- Cars and other vehicles available in Only in renter-occupied apartments
- 6no vehicle
- 621 vehicle
- 272 vehicles
- 03 vehicles
- 64 vehicles
- 05+ vehicles

- Rooms in owner-occupied houses in Only, Tennessee
- 181 room
- 72 rooms
- 283 rooms
- 154 rooms
- 725 rooms
- 436 rooms
- 517 rooms
- 268 rooms
- 639+ rooms

- Rooms in renter-occupied apartments in Only, Tennessee
- 01 room
- 72 rooms
- 93 rooms
- 324 rooms
- 275 rooms
- 126 rooms
- 87 rooms
- 08 rooms
- 69+ rooms


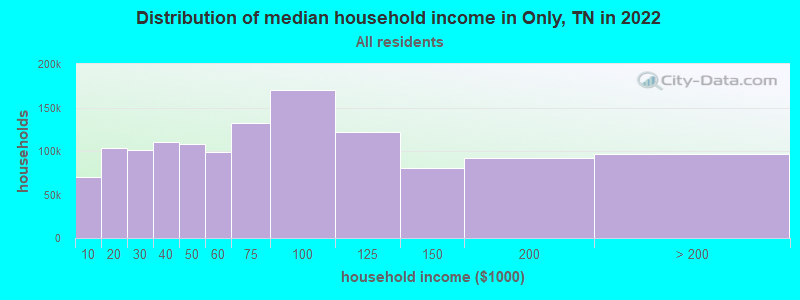
Only, TN household income distribution

- 46,140Less than $10,000
- 77,390$10,000 to $19,999
- 73,394$20,000 to $29,999
- 75,043$30,000 to $39,999
- 72,557$40,000 to $49,999
- 67,157$50,000 to $59,999
- 91,562$60,000 to $74,999
- 116,707$75,000 to $99,999
- 87,283$100,000 to $124,999
- 51,990$125,000 to $149,999
- 57,064$150,000 to $199,999
- 48,239$200,000 or more
Percentage of workers working in this county: 33.0%
Number of people working at home: 57 (9.8% of all workers)
Travel time to work (commute)
- Less than 5 minutes: 6
- 5 to 9 minutes: 26
- 10 to 14 minutes: 8
- 15 to 19 minutes: 36
- 20 to 24 minutes: 46
- 25 to 29 minutes: 10
- 30 to 34 minutes: 80
- 35 to 39 minutes: 35
- 40 to 44 minutes: 42
- 45 to 59 minutes: 106
- 60 to 89 minutes: 50
- 90 or more minutes: 35
Means of transportation to work:
- Drove a car alone: 397 (76.3%)
- Carpooled: 67 (12.9%)
- Walked: 8 (1.5%)
- Other means: 8 (1.5%)
- Worked at home: 40 (7.7%)


- Year of entry for the foreign-born population in Only, Tennessee
- 01995 to March 2000
- 131990 to 1994
- 01985 to 1989
- 01980 to 1984
- 01975 to 1979
- 01970 to 1974
- 01965 to 1969
- 0Before 1965
Most common places of birth for foreign-born residents (%):
| Only: | 53.8% (7) |
| Tennessee: | 28.1% (44,682) |
| Only: | 46.2% (6) |
| Tennessee: | 1.1% (1,721) |
Place of birth for U.S.-born residents:
- This state: 1,547
- Other state: 604
- Northeast: 64
- Midwest: 307
- South: 206
- West: 27
51% of Only residents lived in the same house 5 years ago.
Out of people who lived in different houses, 13% lived in this county.
Out of people who lived in different counties, 80% lived in Tennessee.
Education attainment for males 25 years and older:
- No schooling: 5
- Nursery to 4th grade: 0
- 5th and 6th grade: 7
- 7th and 8th grade: 81
- 9th grade: 51
- 10th grade: 98
- 11th grade: 113
- 12th grade, no diploma: 75
- High school graduate (or equivalency): 615
- Less than 1 year of college: 25
- Some college more than 1 year, no degree: 107
- Associate degree: 17
- Bachelor's degree: 57
- Master's degree: 15
- Professional school degree: 5
- Doctorate degree: 10

Education attainment for females 25 years and older:
- No schooling: 10
- Nursery to 4th grade: 9
- 5th and 6th grade: 0
- 7th and 8th grade: 15
- 9th grade: 23
- 10th grade: 27
- 11th grade: 23
- 12th grade, no diploma: 12
- High school graduate (or equivalency): 126
- Less than 1 year of college: 43
- Some college more than 1 year, no degree: 56
- Associate degree: 15
- Bachelor's degree: 7
- Master's degree: 11
- Professional school degree: 7
- Doctorate degree: 0


Housing units in structures:
- One, detached: 379
- One, attached: 7
- 3 or 4: 7
- 5 to 9: 7
- Mobile homes: 104
Median worth of mobile homes: $50,707
Housing units lacking complete kitchen facilities: 9.5%

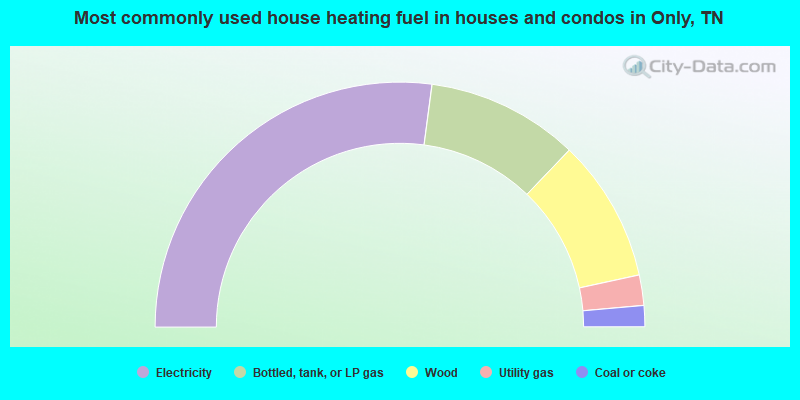
- 54.2%Electricity
- 20.1%Bottled, tank, or LP gas
- 18.9%Wood
- 4.0%Utility gas
- 2.8%Coal or coke
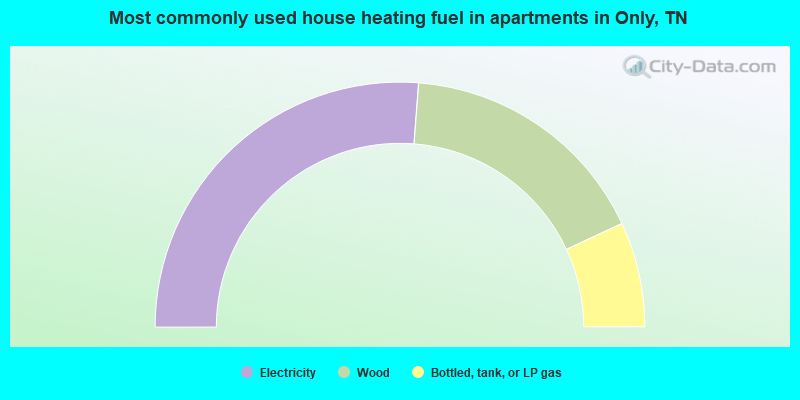
- 52.5%Electricity
- 33.7%Wood
- 13.9%Bottled, tank, or LP gas
Private vs. public school enrollment:
| Here: | 43.2% |
| Tennessee: | 9.5% |
| Here: | 58.1% |
| Tennessee: | 10.4% |
| Here: | 34.0% |
| Tennessee: | 22.8% |


