Housing density: 356 houses/condos per square mile
Median price asked for vacant for-sale houses and condos in 2022 in this county: $431,754.
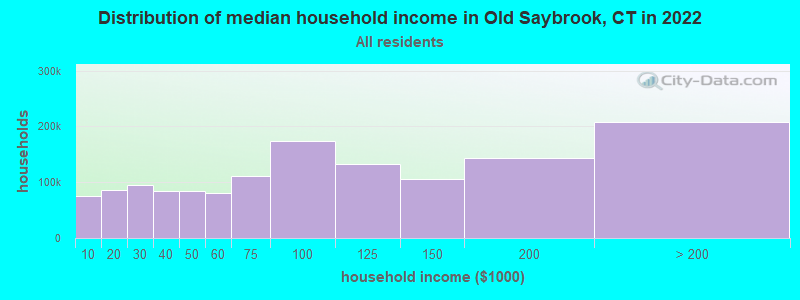
Median contract rent in 2022: $1,435 (lower quartile is $1,032, upper quartile is $1,855)
Median rent asked for vacant for-rent units in 2022: $2,757
Median gross rent in Old Saybrook, CT in 2022: $1,703
Housing units in Old Saybrook with a mortgage: 2,210 (200 second mortgage, 345 home equity loan, 0 both second mortgage and home equity loan) Houses without a mortgage: 1,062
Compare current foreclosures near Old Saybrook, CT:
In family households: 131,621 (30,370 male householders, 13,373 female householders)
34,891 spouses, 44,052 children (41,443 natural, 1,059 adopted, 1,550 stepchildren), 1,876 grandchildren, 1,018 brothers or sisters, 1,359 parents, foster children, 1,032 other relatives, 2,795 non-relatives
In nonfamily households: 28,970 (10,508 male householders (8,006 living alone)), 12,951 female householders (10,912 living alone)), 5,511 nonrelatives
In group quarters: 5,085 (1,881 institutionalized population)
26,910 married couples with children.
6,210 single-parent households (1,312 men, 4,898 women).
93.9% of residents of Old Saybrook speak English at home.
2.3% of residents speak Spanish at home (59% speak English very well, 18% speak English well, 17% speak English not well, 6% don't speak English at all).
3.5% of residents speak other Indo-European language at home (83% speak English very well, 17% speak English well).
0.2% of residents speak Asian or Pacific Island language at home (47% speak English very well, 53% speak English well).
0.1% of residents speak other language at home (100% speak English very well).
Foreign born population: 779 (7.1%)
(62.6% of them are naturalized citizens)
Year of entry for the foreign-born population in Old Saybrook, Connecticut
1121995 to March 2000
331990 to 1994
251985 to 1989
361980 to 1984
231975 to 1979
121970 to 1974
471965 to 1969
218Before 1965
First ancestries reported:
Irish: 2,518 (19.8%)
English: 1,936 (15.3%)
Italian: 1,796 (14.2%)
German: 1,256 (9.9%)
Other: 1,028 (8.1%)
Polish: 731 (5.8%)
French: 599 (4.7%)
French Canadian: 484 (3.8%)
Swedish: 386 (3.0%)
Scottish: 385 (3.0%)
United States: 356 (2.8%)
Hungarian: 149 (1.2%)
Dutch: 148 (1.2%)
Lithuanian: 147 (1.2%)
Czech: 104 (0.8%)
Scotch-Irish: 104 (0.8%)
Norwegian: 102 (0.8%)
Russian: 97 (0.8%)
Portuguese: 66 (0.5%)
Danish: 61 (0.5%)
Slovak: 58 (0.5%)
Welsh: 49 (0.4%)
Greek: 41 (0.3%)
Ukrainian: 41 (0.3%)
Swiss: 35 (0.3%)
Arab: 10 (0.08%)
Subsaharan African: 5 (0.04%)
Most common places of birth for foreign-born residents (%):
United Kingdom
Old Saybrook:
16.8% (85)
Connecticut:
4.4% (16,395)
Canada
Old Saybrook:
11.7% (59)
Connecticut:
5.2% (19,083)
Ecuador
Old Saybrook:
10.7% (54)
Connecticut:
2.4% (9,020)
Italy
Old Saybrook:
5.3% (27)
Connecticut:
7.0% (26,023)
Other Eastern Europe
Old Saybrook:
5.1% (26)
Connecticut:
2.1% (7,596)
Netherlands
Old Saybrook:
4.3% (22)
Connecticut:
0.4% (1,303)
Romania
Old Saybrook:
4.0% (20)
Connecticut:
0.6% (2,371)
Bangladesh
Old Saybrook:
3.8% (19)
Connecticut:
0.3% (1,180)
Germany
Old Saybrook:
3.6% (18)
Connecticut:
3.1% (11,432)
Ukraine
Old Saybrook:
3.6% (18)
Connecticut:
1.0% (3,822)
Japan
Old Saybrook:
3.4% (17)
Connecticut:
0.9% (3,472)
Poland
Old Saybrook:
2.8% (14)
Connecticut:
6.9% (25,507)
Hungary
Old Saybrook:
2.4% (12)
Connecticut:
0.7% (2,646)
Russia
Old Saybrook:
2.2% (11)
Connecticut:
1.4% (5,021)
Ireland
Old Saybrook:
2.0% (10)
Connecticut:
1.2% (4,344)
Cuba
Old Saybrook:
2.0% (10)
Connecticut:
1.1% (3,919)
Venezuela
Old Saybrook:
2.0% (10)
Connecticut:
0.3% (1,213)
Sweden
Old Saybrook:
1.8% (9)
Connecticut:
0.4% (1,374)
Other Northern Europe
Old Saybrook:
1.8% (9)
Connecticut:
0.6% (2,220)
Yugoslavia
Old Saybrook:
1.8% (9)
Connecticut:
0.5% (1,894)
Brazil
Old Saybrook:
1.8% (9)
Connecticut:
2.8% (10,379)
Place of birth for U.S.-born residents:
This state: 6,252
Other state: 3,551
Northeast: 2,413
Midwest: 477
South: 446
West: 215
67% of Old Saybrook residents lived in the same house 5 years ago. Out of people who lived in different houses, 51% lived in this county. Out of people who lived in different counties, 54% lived in Connecticut.
Education attainment for males 25 years and older:
No schooling: 0
Nursery to 4th grade: 0
5th and 6th grade: 0
7th and 8th grade: 38
9th grade: 53
10th grade: 41
11th grade: 46
12th grade, no diploma: 53
High school graduate (or equivalency): 903
Less than 1 year of college: 183
Some college more than 1 year, no degree: 446
Associate degree: 221
Bachelor's degree: 889
Master's degree: 415
Professional school degree: 123
Doctorate degree: 101
Education attainment for females 25 years and older:
No schooling: 0
Nursery to 4th grade: 0
5th and 6th grade: 11
7th and 8th grade: 88
9th grade: 34
10th grade: 75
11th grade: 52
12th grade, no diploma: 66
High school graduate (or equivalency): 1,107
Less than 1 year of college: 292
Some college more than 1 year, no degree: 691
Associate degree: 341
Bachelor's degree: 919
Master's degree: 299
Professional school degree: 128
Doctorate degree: 52
Housing units in structures:
One, detached: 4,861
One, attached: 152
Two: 92
3 or 4: 78
5 to 9: 111
10 to 19: 22
20 to 49: 10
50 or more: 20
Boats, RVs, vans, etc.: 11
Housing units lacking complete plumbing facilities: 0.4%
Housing units lacking complete kitchen facilities: 0.3%