Oklahoma City, OK (Oklahoma) Houses and Residents
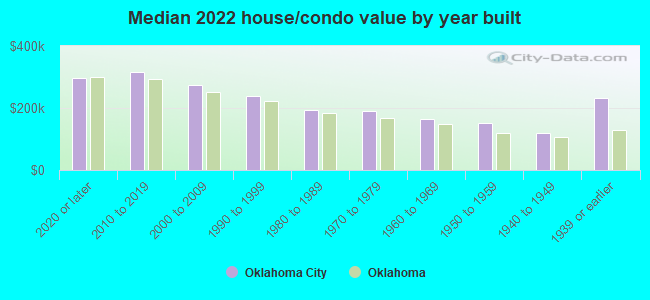
| Oklahoma City: | $227,300 |
| Oklahoma: | $191,700 |
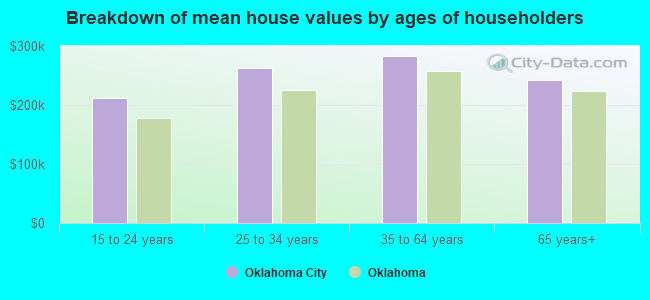
Mean price in 2022:
Detached houses: $277,368
Here: $277,368 State: $255,409 Townhouses or other attached units: $232,094
Here: $232,094 State: $206,466 In 2-unit structures: $203,338
Here: $203,338 State: $195,100 In 3-to-4-unit structures: $130,712
Here: $130,712 State: $140,612 In 5-or-more-unit structures: $202,643
Here: $202,643 State: $233,805 Mobile homes: $84,317
Here: $84,317 State: $110,804 Occupied boats, RVs, vans, etc.: $48,932
Here: $48,932 State: $68,690
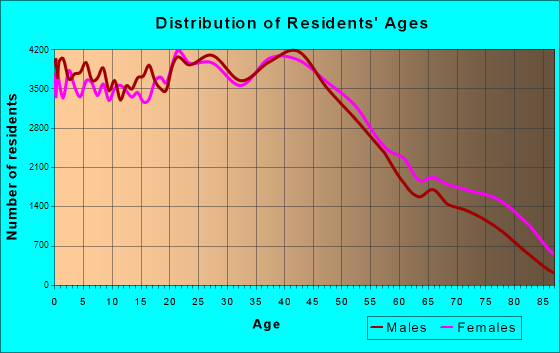
Total population: 620,602 (Urban population: 471,161, Rural population: 34,802 (945 farm, 33,857 nonfarm))
Houses: 305,402 (277,216 occupied: 161,657 owner occupied, 115,559 renter occupied)
| % of renters here: | 42% |
| State: | 35% |
Housing density: 503 houses/condos per square mile
Median price asked for vacant for-sale houses and condos in 2022: $131,675.
Median contract rent in 2022: $833 (lower quartile is $669, upper quartile is $1,099)
Median rent asked for vacant for-rent units in 2022: $1,079
Median gross rent in Oklahoma City, OK in 2022: $1,020
Housing units in Oklahoma City with a mortgage: 97,313 (5,525 second mortgage, 180 home equity loan, 4,210 both second mortgage and home equity loan)
Houses without a mortgage: 1,455
Median household income for houses/condos with a mortgage: $102,206
Median household income for apartments without a mortgage: $66,254
Median monthly housing costs: $1,081
Compare current foreclosures in Oklahoma City, OK:
| Photo | Address | Area | Beds / Baths | Price | Details |
|---|---|---|---|---|---|

|
#1
Pruitt Dr
Oklahoma City, OK 73170
|
- sq. feet
|
2 baths 3 beds |
show details | |

|
#2
SW 129th St
Oklahoma City, OK 73170
|
1,910 sq. feet
|
2 baths 4 beds |
show details | |

|
#3
Raymond King Dr
Oklahoma City, OK 73165
|
1,512 sq. feet
|
2 baths 3 beds |
show details | |

|
#4
Norcrest Dr
Oklahoma City, OK 73121
|
3,237 sq. feet
|
2 baths 3 beds |
show details | |

|
#5
NW 1st St
Oklahoma City, OK 73160
|
1,387 sq. feet
|
2 baths 3 beds |
show details | |

|
#6
S Winston Way
Oklahoma City, OK 73139
|
1,733 sq. feet
|
3 baths 4 beds |
show details | |

|
#7
NW 45th St
Oklahoma City, OK 73118
|
1,421 sq. feet
|
1 baths 3 beds |
show details | |

|
#8
SE 19th St
Oklahoma City, OK 73115
|
1,195 sq. feet
|
2 baths 3 beds |
show details | |

|
#9
Kindsey Ave
Oklahoma City, OK 73160
|
1,143 sq. feet
|
2 baths 3 beds |
show details | |

|
#10
Bannockburn Pl
Oklahoma City, OK 73142
|
1,756 sq. feet
|
2 baths 3 beds |
show details |
| Photo | Address | Area | Beds / Baths | Price | Details |
|---|---|---|---|---|---|

|
#11
NE 5th St
Oklahoma City, OK 73160
|
2,093 sq. feet
|
1 baths 3 beds |
show details | |

|
#12
NW 21st St
Oklahoma City, OK 73107
|
1,359 sq. feet
|
1 baths 3 beds |
show details | |

|
#13
SE 89th St
Oklahoma City, OK 73135
|
1,434 sq. feet
|
2 baths 3 beds |
show details | |

|
#14
Mackel Dr
Oklahoma City, OK 73170
|
1,951 sq. feet
|
2 baths 4 beds |
show details | |

|
#15
NW 120th St
Oklahoma City, OK 73162
|
2,298 sq. feet
|
2 baths 3 beds |
show details | |

|
#16
Shalimar Dr
Oklahoma City, OK 73135
|
1,302 sq. feet
|
1 baths 3 beds |
show details | |

|
#17
SW 42nd St
Oklahoma City, OK 73119
|
1,235 sq. feet
|
1 baths 3 beds |
show details | |

|
#18
Whispering Oak Rd
Oklahoma City, OK 73127
|
1,100 sq. feet
|
1 baths 3 beds |
show details | |

|
#19
Carter Dr
Oklahoma City, OK 73129
|
864 sq. feet
|
1 baths 3 beds |
show details | |

|
#20
SW 141st Ter
Oklahoma City, OK 73170
|
2,288 sq. feet
|
2 baths 4 beds |
show details |
| Photo | Address | Area | Beds / Baths | Price | Details |
|---|---|---|---|---|---|

|
#21
Wilshire Ridge Dr
Oklahoma City, OK 73132
|
1,725 sq. feet
|
2 baths 3 beds |
show details | |

|
#22
Park Vista Dr
Oklahoma City, OK 73115
|
1,009 sq. feet
|
1 baths 3 beds |
show details | |

|
#23
S Glenn Ave
Oklahoma City, OK 73115
|
836 sq. feet
|
1 baths 2 beds |
show details | |

|
#24
NW 31st St
Oklahoma City, OK 73118
|
938 sq. feet
|
1 baths 2 beds |
show details | |

|
#25
N Moore Ave
Oklahoma City, OK 73141
|
1,470 sq. feet
|
2 baths 3 beds |
show details | |

|
#26
Holiday Pl
Oklahoma City, OK 73112
|
1,634 sq. feet
|
2 baths 3 beds |
show details | |

|
#27
NW 34th St
Oklahoma City, OK 73122
|
3,838 sq. feet
|
3 baths 4 beds |
show details | |

|
#28
NW 118th St
Oklahoma City, OK 73162
|
2,072 sq. feet
|
2 baths 4 beds |
show details | |

|
#29
N Sapulpa Ave
Oklahoma City, OK 73112
|
875 sq. feet
|
1 baths 3 beds |
show details | |

|
#30
Woodview Dr
Oklahoma City, OK 73115
|
1,392 sq. feet
|
2 baths 4 beds |
show details |
| Photo | Address | Area | Beds / Baths | Price | Details |
|---|---|---|---|---|---|

|
#31
Mantle Ln
Oklahoma City, OK 73162
|
2,224 sq. feet
|
2 baths 4 beds |
show details | |

|
#32
SW 147th St
Oklahoma City, OK 73170
|
1,200 sq. feet
|
2 baths 2 beds |
show details | |

|
#33
SE 24th St
Oklahoma City, OK 73129
|
1,008 sq. feet
|
1 baths 3 beds |
show details | |

|
#34
N Tacoma St
Oklahoma City, OK 73112
|
1,292 sq. feet
|
1 baths 3 beds |
show details | |

|
#35
Southridge Ter
Oklahoma City, OK 73159
|
1,467 sq. feet
|
2 baths 3 beds |
show details | |

|
#36
Blue Spruce Ct
Oklahoma City, OK 73162
|
1,829 sq. feet
|
2 baths 3 beds |
show details | |

|
#37
Greenvale Rd
Oklahoma City, OK 73127
|
930 sq. feet
|
1 baths 3 beds |
show details | |

|
#38
N University Ave
Oklahoma City, OK 73114
|
1,748 sq. feet
|
2 baths 4 beds |
show details | |

|
#39
NW 117th St
Oklahoma City, OK 73120
|
2,049 sq. feet
|
2 baths 4 beds |
show details | |

|
#40
S Winston Way
Oklahoma City, OK 73139
|
1,556 sq. feet
|
2 baths 3 beds |
show details |
| Photo | Address | Area | Beds / Baths | Price | Details |
|---|---|---|---|---|---|

|
#41
Renita Way
Oklahoma City, OK 73160
|
1,860 sq. feet
|
2 baths 3 beds |
show details | |

|
#42
Placker Pl
Oklahoma City, OK 73159
|
1,509 sq. feet
|
2 baths 3 beds |
show details | |

|
#43
N Sterling Ave
Oklahoma City, OK 73122
|
764 sq. feet
|
1 baths 2 beds |
show details | |

|
#44
NE 46th St
Oklahoma City, OK 73111
|
1,221 sq. feet
|
1 baths 3 beds |
show details | |

|
#45
NW 109th St
Oklahoma City, OK 73162
|
2,363 sq. feet
|
2 baths 4 beds |
show details | |

|
#46
Oakland Cir
Oklahoma City, OK 73142
|
1,734 sq. feet
|
1 baths 3 beds |
show details | |

|
#47
Timbercrest
Oklahoma City, OK 73142
|
1,432 sq. feet
|
2 baths 3 beds |
show details | |

|
#48
Hunters Run
Oklahoma City, OK 73130
|
1,758 sq. feet
|
2 baths 4 beds |
show details | |

|
#49
SE 26th St
Oklahoma City, OK 73160
|
1,932 sq. feet
|
2 baths 3 beds |
show details | |

|
Check over 1 million property listings on Foreclosure.com!
|
browse all offers | |||


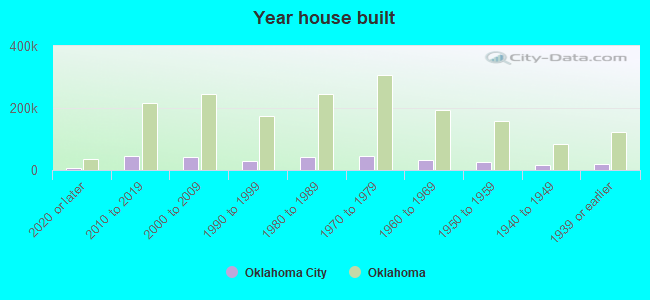
Median year apartment built: 1982
Household type by relationship:
Households: 694,768- Male householders: 133,720 (40,625 living alone), Female householders: 143,496 (48,025 living alone)
118,946 spouses (116,390 opposite-sex spouses), 23,795 unmarried partners, (22,114 opposite-sex unmarried partners), 201,522 children (182,949 natural, 6,155 adopted, 12,418 stepchildren), 16,561 grandchildren, 6,736 brothers or sisters, 7,770 parents, 1,371 foster children, 10,515 other relatives, 19,284 non-relatives
- In group quarters: 11,052
Size of family households: 70,840 2-persons, 40,253 3-persons, 33,133 4-persons, 15,019 5-persons, 6,889 6-persons, 3,198 7-or-more-persons.
Size of nonfamily households: 88,650 1-person, 16,677 2-persons, 1,953 3-persons, 564 4-persons, 40 5-persons.
95,461 married couples with children.
58,896 single-parent households (12,911 men, 45,985 women).
79.5% of residents of Oklahoma City speak English at home.
15.1% of residents speak Spanish at home (63% speak English very well, 16% speak English well, 14% speak English not well, 7% don't speak English at all).
1.2% of residents speak other Indo-European language at home (68% speak English very well, 26% speak English well, 6% speak English not well, 1% don't speak English at all).
3.0% of residents speak Asian or Pacific Island language at home (48% speak English very well, 30% speak English well, 16% speak English not well, 6% don't speak English at all).
1.2% of residents speak other language at home (79% speak English very well, 11% speak English well, 10% speak English not well).
Foreign born population: 80,631 (11.6%)
(40.7% of them are naturalized citizens)
| Here: | 6.2 |
| State: | 6.1 |
| Here: | 4.2 |
| State: | 4.5 |
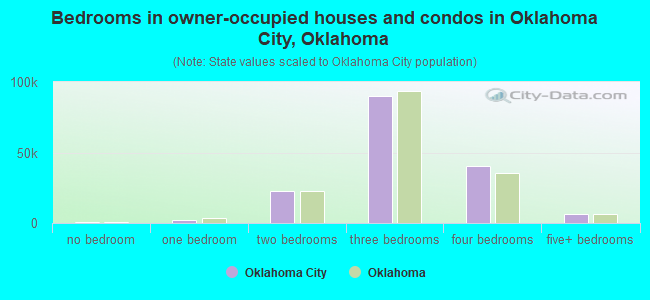
- Bedrooms in owner-occupied houses and condos in Oklahoma City, Oklahoma
- 771no bedroom
- 1,8551 bedroom
- 22,5502 bedrooms
- 90,0613 bedrooms
- 40,3634 bedrooms
- 6,0575+ bedrooms
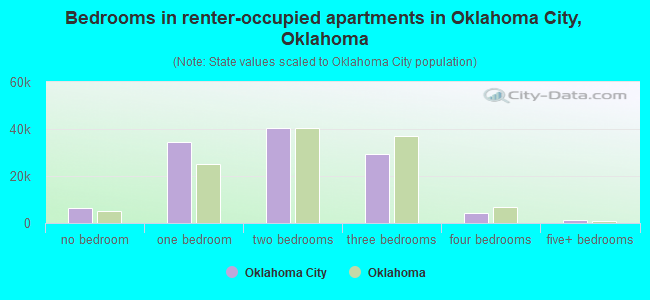
- Bedrooms in renter-occupied apartments in Oklahoma City, Oklahoma
- 6,375no bedroom
- 34,3331 bedroom
- 40,3632 bedrooms
- 29,1583 bedrooms
- 4,1524 bedrooms
- 1,1785+ bedrooms
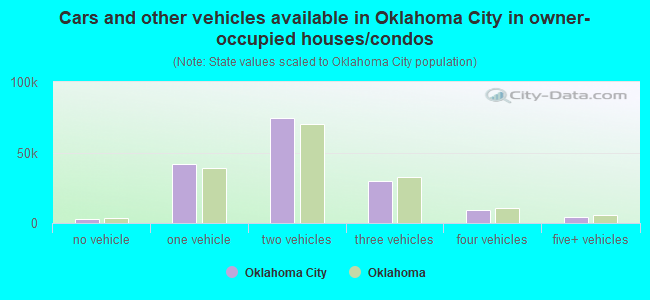
- Cars and other vehicles available in Oklahoma City in owner-occupied houses/condos
- 2,866no vehicle
- 41,6471 vehicle
- 74,3212 vehicles
- 29,7053 vehicles
- 9,0084 vehicles
- 4,1105+ vehicles
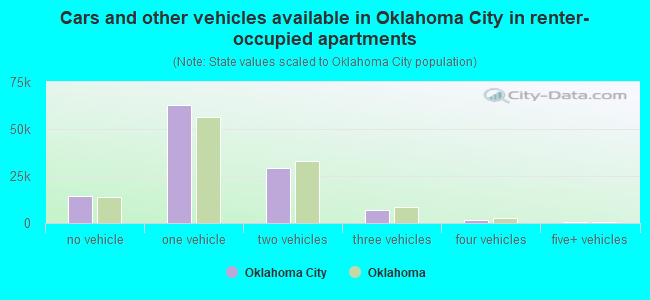
- Cars and other vehicles available in Oklahoma City in renter-occupied apartments
- 14,517no vehicle
- 62,5741 vehicle
- 29,1572 vehicles
- 7,1543 vehicles
- 1,8324 vehicles
- 3255+ vehicles
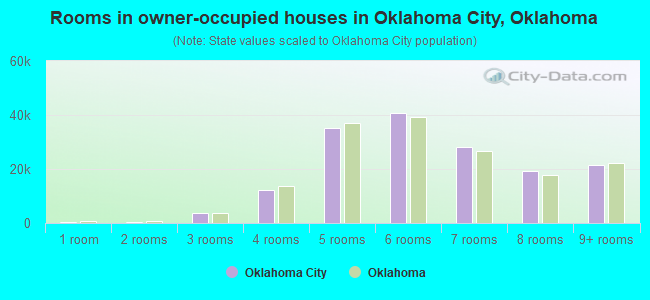
- Rooms in owner-occupied houses in Oklahoma City, Oklahoma
- 4381 room
- 4212 rooms
- 3,8413 rooms
- 12,3214 rooms
- 35,3325 rooms
- 40,6646 rooms
- 28,1527 rooms
- 19,0928 rooms
- 21,3969+ rooms
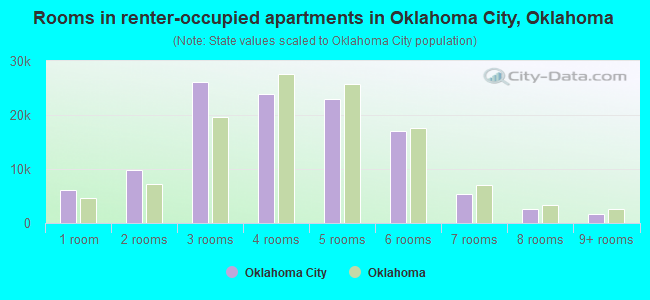
- Rooms in renter-occupied apartments in Oklahoma City, Oklahoma
- 6,0671 room
- 9,8542 rooms
- 26,1513 rooms
- 23,9464 rooms
- 22,9125 rooms
- 17,0606 rooms
- 5,2967 rooms
- 2,6458 rooms
- 1,6289+ rooms
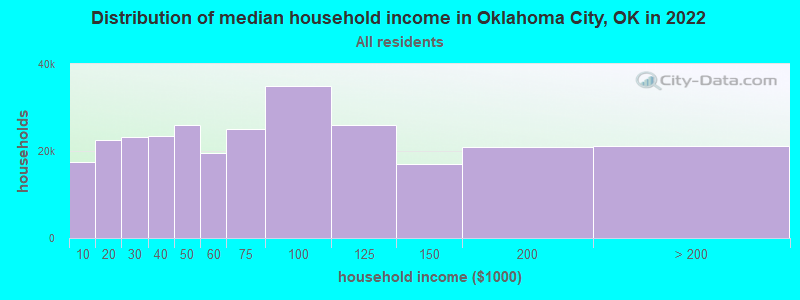
Oklahoma City, OK household income distribution

- 17,481Less than $10,000
- 22,638$10,000 to $19,999
- 23,106$20,000 to $29,999
- 23,371$30,000 to $39,999
- 25,945$40,000 to $49,999
- 19,594$50,000 to $59,999
- 25,120$60,000 to $74,999
- 34,912$75,000 to $99,999
- 25,916$100,000 to $124,999
- 16,934$125,000 to $149,999
- 20,978$150,000 to $199,999
- 21,221$200,000 or more
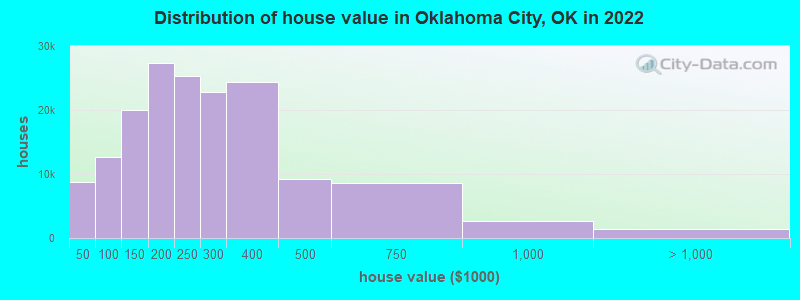
Home value of owner - occupied houses in 2022 in Oklahoma City, OK
-
- 2,061Less than $10,000
- 1,199$10,000 to $14,999
- 881$15,000 to $19,999
- 975$20,000 to $24,999
- 841$25,000 to $29,999
- 815$30,000 to $34,999
- 227$35,000 to $39,999
- 1,751$40,000 to $49,999
- 2,133$50,000 to $59,999
- 1,851$60,000 to $69,999
- 2,166$70,000 to $79,999
- 2,432$80,000 to $89,999
- 2,394$90,000 to $99,999
- 10,440$100,000 to $124,999
- 9,542$125,000 to $149,999
- 15,832$150,000 to $174,999
- 11,451$175,000 to $199,999
- 25,340$200,000 to $249,999
- 22,861$250,000 to $299,999
- 24,453$300,000 to $399,999
- 9,259$400,000 to $499,999
- 8,609$500,000 to $749,999
- 2,720$750,000 to $999,999
- 609$1,000,000 to $1,499,999
- 286$1,500,000 to $1,999,999
- 529$2,000,000 or more
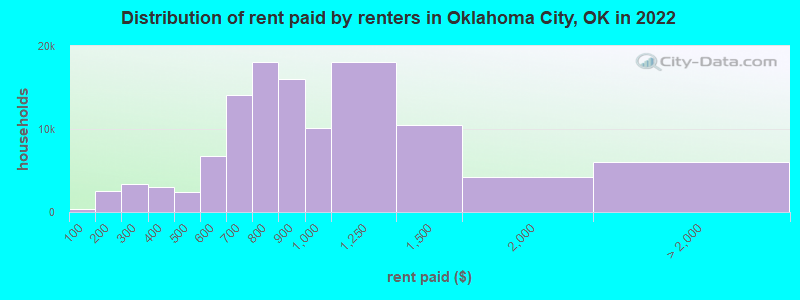
Rent paid by renters in 2022 in Oklahoma City, OK
-
- 355Less than $100
- 1,031$100 to $149
- 1,456$150 to $199
- 2,203$200 to $249
- 1,195$250 to $299
- 1,648$300 to $349
- 1,394$350 to $399
- 1,396$400 to $449
- 1,034$450 to $499
- 3,271$500 to $549
- 3,450$550 to $599
- 6,614$600 to $649
- 7,509$650 to $699
- 8,894$700 to $749
- 9,155$750 to $799
- 16,044$800 to $899
- 10,108$900 to $999
- 18,112$1,000 to $1,249
- 10,474$1,250 to $1,499
- 4,241$1,500 to $1,999
- 672$2,000 to $2,499
- 467$2,500 to $2,999
- 268$3,000 to $3,499
- 875$3,500 or more
- 3,693No cash rent

Percentage of workers working in this county: 78.3%
Number of people working at home: 40,368 (11.7% of all workers)

Travel time to work (commute)
- Less than 5 minutes: 7,159
- 5 to 9 minutes: 28,260
- 10 to 14 minutes: 42,248
- 15 to 19 minutes: 59,229
- 20 to 24 minutes: 56,395
- 25 to 29 minutes: 28,026
- 30 to 34 minutes: 47,217
- 35 to 39 minutes: 5,779
- 40 to 44 minutes: 8,060
- 45 to 59 minutes: 11,051
- 60 to 89 minutes: 6,077
- 90 or more minutes: 5,060

Means of transportation to work:
- Drove a car alone: 355,848 (79.8%)
- Carpooled: 36,131 (8.1%)
- Bus: 1,406 (0.3%)
- Subway or elevated rail: 40 (0.0%)
- Long-distance train or commuter rail: 39 (0.0%)
- Ferryboat: 268 (0.1%)
- Taxi: 5,856 (1.3%)
- Bicycle: 402 (0.1%)
- Walked: 5,472 (1.2%)
- Worked at home: 40,368 (9.1%)
- Unemployment by race in 2022
- Unemployment rate for White non-Hispanic residents
- 3.5%Males
- 3.5%Females
- Unemployment rate for Black residents
- 8.7%Males
- 3.7%Females
- Unemployment rate for American Indian and Alaska Native residents
- 9.2%Males
- 8.1%Females
- Unemployment rate for Asian residents
- 2.2%Males
- 4.7%Females
- Unemployment rate for other race residents
- 3.3%Males
- 11.0%Females
- Unemployment rate for two or more race residents
- 2.0%Males
- 4.0%Females
- Unemployment rate for Hispanic or Latino residents
- 3.0%Males
- 6.0%Females
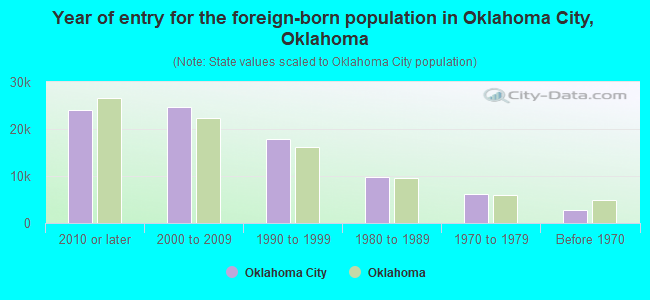
- Year of entry for the foreign-born population in Oklahoma City, Oklahoma
- 23,9772010 or later
- 24,6072000 to 2009
- 17,9221990 to 1999
- 9,7631980 to 1989
- 6,2191970 to 1979
- 2,871Before 1970
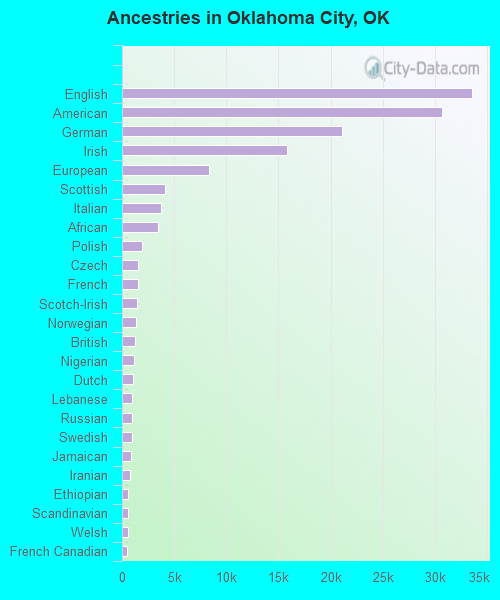
First ancestries reported:
- English: 33,517 (9.2%)
- American: 30,700 (8.4%)
- German: 21,139 (5.8%)
- Irish: 15,844 (4.3%)
- European: 8,302 (2.3%)
- Scottish: 4,146 (1.1%)
- Italian: 3,718 (1.0%)
- African: 3,426 (0.9%)
- Polish: 1,882 (0.5%)
- Czech: 1,548 (0.4%)
- French: 1,505 (0.4%)
- Scotch-Irish: 1,397 (0.4%)
- Norwegian: 1,343 (0.4%)
- British: 1,253 (0.3%)
- Nigerian: 1,124 (0.3%)
- Dutch: 1,091 (0.3%)
- Lebanese: 937 (0.3%)
- Russian: 919 (0.3%)
- Swedish: 914 (0.2%)
- Jamaican: 841 (0.2%)
- Iranian: 730 (0.2%)
- Ethiopian: 594 (0.2%)
- Scandinavian: 574 (0.2%)
- Welsh: 541 (0.1%)
- French Canadian: 493 (0.1%)
- Portuguese: 483 (0.1%)
- Northern European: 466 (0.1%)
- Ghanaian: 381 (0.1%)
- Moroccan: 361 (0.10%)
- Danish: 355 (0.10%)
- Eastern European: 339 (0.09%)
- Greek: 301 (0.08%)
- Haitian: 301 (0.08%)
- South African: 295 (0.08%)
- Somali: 256 (0.07%)
- Dutch West Indian: 256 (0.07%)
- Ukrainian: 248 (0.07%)
- Brazilian: 234 (0.06%)
- Czechoslovakian: 231 (0.06%)
- Hungarian: 214 (0.06%)
- Canadian: 206 (0.06%)
- Kenyan: 205 (0.06%)
- Zimbabwean: 199 (0.05%)
- Arab: 197 (0.05%)
- Syrian: 173 (0.05%)
- Serbian: 170 (0.05%)
- Iraqi: 167 (0.05%)
- Romanian: 162 (0.04%)
- Liberian: 146 (0.04%)
- Armenian: 106 (0.03%)
- Israeli: 97 (0.03%)
- Yugoslavian: 95 (0.03%)
- Austrian: 93 (0.03%)
- Finnish: 77 (0.02%)
- Swiss: 71 (0.02%)
- Ugandan: 69 (0.02%)
- Bulgarian: 66 (0.02%)
- Afghan: 57 (0.02%)
- West Indian: 56 (0.02%)
- Trinidadian and Tobagonian: 52 (0.01%)
- Lithuanian: 51 (0.01%)
- Slovak: 50 (0.01%)
- Jordanian: 49 (0.01%)
- Icelander: 47 (0.01%)
- Senegalese: 44 (0.01%)
- Sierra Leonean: 40 (0.01%)
- Turkish: 40 (0.01%)
- Pennsylvania German: 39 (0.01%)
- Guyanese: 38 (0.01%)
- Celtic: 36 (0.01%)
- Slavic: 33 (0.01%)
- Egyptian: 32 (0.01%)
- Palestinian: 28 (0.01%)
- Barbadian: 21 (0.01%)
- Belgian: 20 (0.01%)
- Slovene: 19 (0.01%)
Most common places of birth for foreign-born residents (%):
| Oklahoma City: | 45.5% (36,630) |
| Oklahoma: | 42.4% (103,425) |
| Oklahoma City: | 9.3% (7,469) |
| Oklahoma: | 5.6% (13,699) |
| Oklahoma City: | 6.7% (5,365) |
| Oklahoma: | 4.2% (10,287) |
| Oklahoma City: | 4.6% (3,716) |
| Oklahoma: | 4.1% (10,034) |
| Oklahoma City: | 2.1% (1,684) |
| Oklahoma: | 1.7% (4,239) |
| Oklahoma City: | 1.8% (1,482) |
| Oklahoma: | 3.2% (7,698) |
Place of birth for U.S.-born residents:
- This state: 389,290
- Other state: 213,602
- Northeast: 15,149
- Midwest: 55,184
- South: 89,175
- West: 54,094
83.4% of Oklahoma City residents lived in the same house 1 years ago.
Out of people who lived in different houses, 33.3% lived in this county.
Out of people who lived in different counties, 46.7% lived in Oklahoma.
| Oklahoma City: | 83.4% |
| State average: | 85.5% |
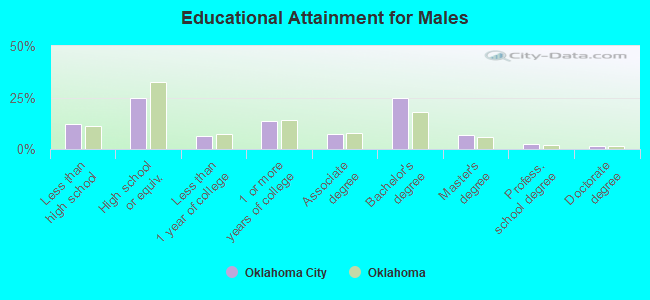
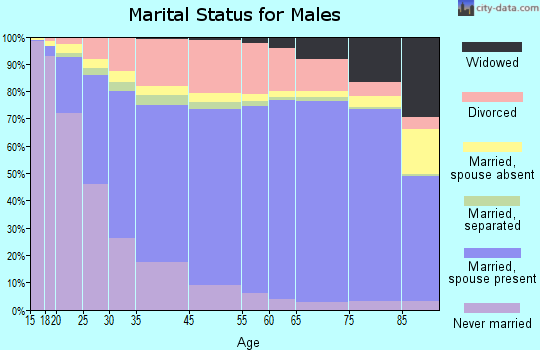
Education attainment for males 25 years and older:
- No schooling: 4,562
- Nursery to 4th grade: 1,344
- 5th and 6th grade: 2,590
- 7th and 8th grade: 2,891
- 9th grade: 3,494
- 10th grade: 2,635
- 11th grade: 3,469
- 12th grade, no diploma: 5,271
- High school graduate (or equivalency): 53,554
- Less than 1 year of college: 14,199
- Some college more than 1 year, no degree: 29,861
- Associate degree: 15,793
- Bachelor's degree: 53,424
- Master's degree: 15,191
- Professional school degree: 5,783
- Doctorate degree: 3,340
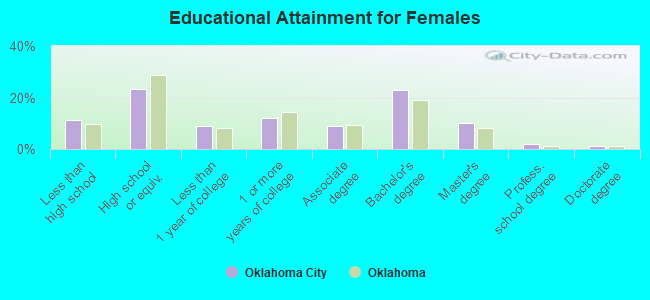
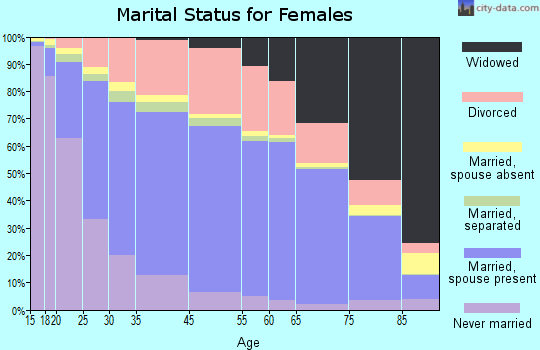
Education attainment for females 25 years and older:
- No schooling: 5,363
- Nursery to 4th grade: 519
- 5th and 6th grade: 2,789
- 7th and 8th grade: 2,209
- 9th grade: 3,244
- 10th grade: 3,840
- 11th grade: 4,025
- 12th grade, no diploma: 4,935
- High school graduate (or equivalency): 54,577
- Less than 1 year of college: 20,965
- Some college more than 1 year, no degree: 28,255
- Associate degree: 20,961
- Bachelor's degree: 53,704
- Master's degree: 23,568
- Professional school degree: 4,776
- Doctorate degree: 2,355
Housing units in structures:
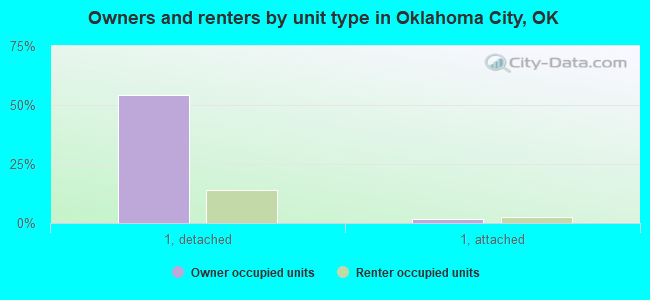
- One, detached: 199,780
- One, attached: 11,884
- Two: 5,868
- 3 or 4: 13,369
- 5 to 9: 22,755
- 10 to 19: 14,754
- 20 to 49: 10,450
- 50 or more: 18,488
- Mobile homes: 8,026
- Boats, RVs, vans, etc.: 28
Median worth of mobile homes: $47,400
Housing units lacking complete kitchen facilities in 2022: 3.1%
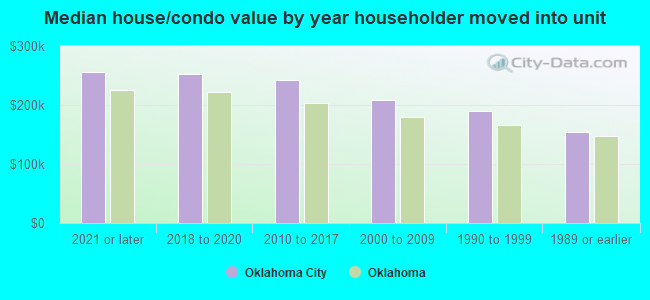
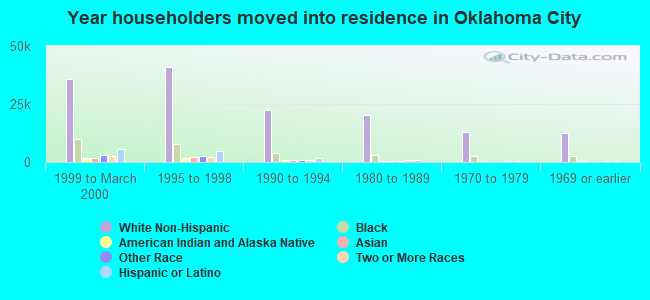
House/condo owner moved in on average 9 years ago
Renter moved in on average 2 years ago
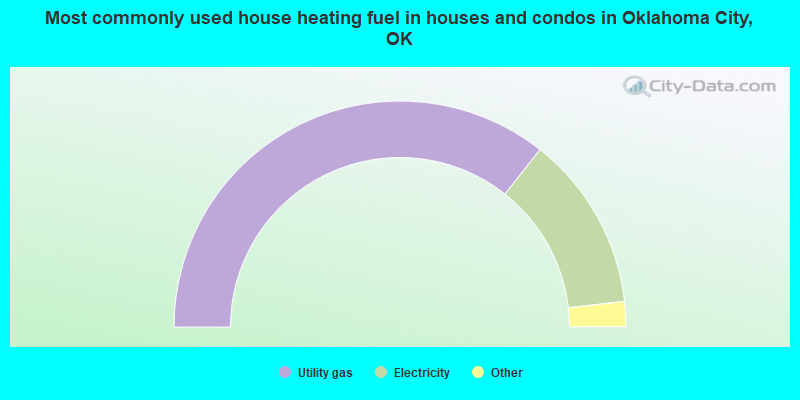
- 71.3%Utility gas
- 25.1%Electricity
- 2.7%Bottled, tank, or LP gas
- 0.3%Other fuel
- 0.3%No fuel used
- 0.1%Fuel oil, kerosene, etc.
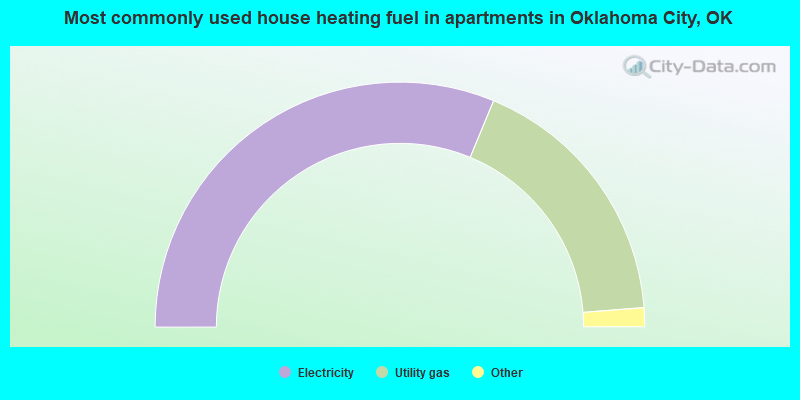
- 62.5%Electricity
- 35.0%Utility gas
- 1.4%Bottled, tank, or LP gas
- 0.8%No fuel used
- 0.2%Wood
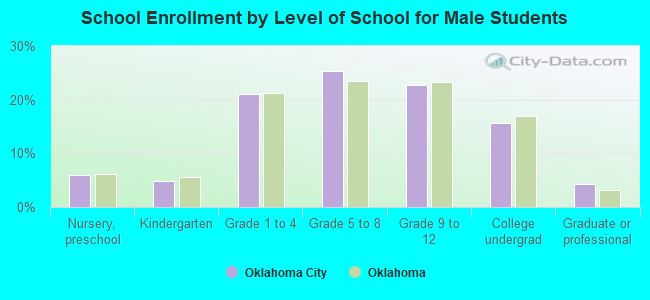
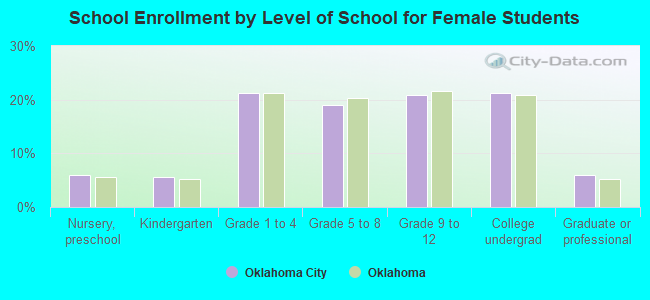
Private vs. public school enrollment:
| Here: | 13.3% |
| Oklahoma: | 11.7% |
| Here: | 17.8% |
| Oklahoma: | 11.7% |
| Here: | 25.9% |
| Oklahoma: | 19.3% |