Oildale, CA (California) Houses and Residents
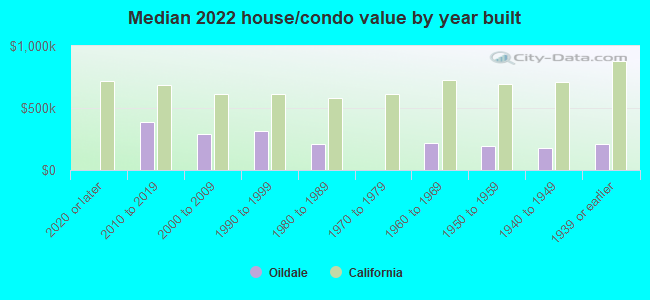
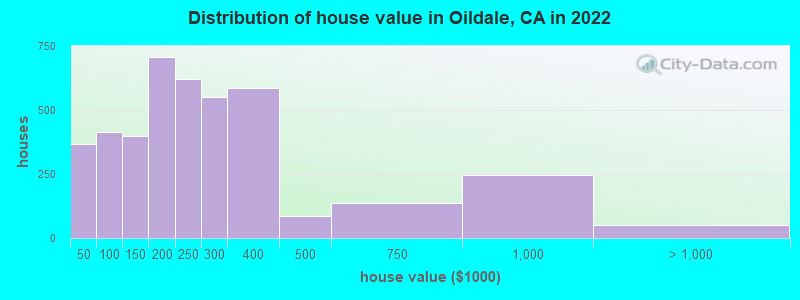
| Oildale: | $232,214 |
| California: | $715,900 |
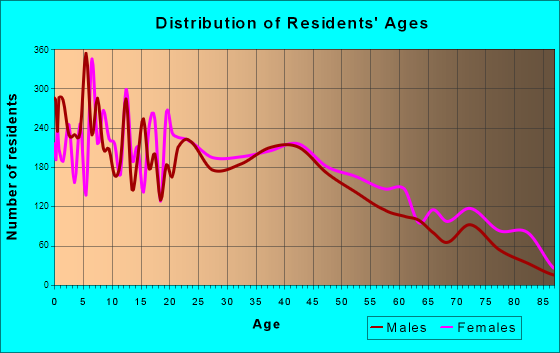
Total population: 32,684 (Urban population: 27,762, Rural population: 115 (all nonfarm))
Houses: 14,093 (12,914 occupied: 4,799 owner occupied, 8,199 renter occupied)
| % of renters here: | 63% |
| State: | 44% |
Housing density: 2,190 houses/condos per square mile
Median price asked for vacant for-sale houses and condos in 2022: $998,027.
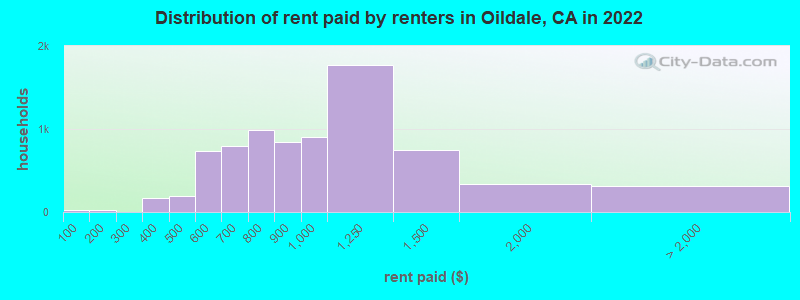
Median contract rent in 2022: $908 (lower quartile is $700, upper quartile is $1,164)
Median rent asked for vacant for-rent units in 2022: $1,154
Median gross rent in Oildale, CA in 2022: $1,191
Housing units in Oildale with a mortgage: 2,926 (167 second mortgage, 27 home equity loan, 122 both second mortgage and home equity loan)
Houses without a mortgage: 0
Median household income for houses/condos with a mortgage: $71,717
Median household income for apartments without a mortgage: $47,208
Median monthly housing costs: $1,158
Compare current foreclosures near Oildale, CA:
| Photo | Address | Area | Beds / Baths | Price | Details |
|---|---|---|---|---|---|

|
#1
Truxtun Ave
Bakersfield, CA 93301
|
1,655 sq. feet
|
1 baths 3 beds |
show details | |

|
#2
Alturas Dr
Bakersfield, CA 93305
|
1,085 sq. feet
|
1 baths 2 beds |
show details | |

|
#3
Chapultepec Avenue
Bakersfield, CA 93307
|
1,843 sq. feet
|
3 baths 4 beds |
show details | |

|
#4
Via Lugano
Bakersfield, CA 93312
|
2,377 sq. feet
|
3 baths 3 beds |
show details | |

|
#5
2707 12 Center St
Bakersfield, CA 93306
|
1,356 sq. feet
|
2 baths 3 beds |
show details | |

|
#6
Miner St
Bakersfield, CA 93305
|
1,327 sq. feet
|
1 baths 3 beds |
show details | |

|
#7
Chester Pl
Bakersfield, CA 93304
|
1,074 sq. feet
|
1 baths 2 beds |
show details | |

|
#8
Botticelli Ct
Bakersfield, CA 93306
|
2,357 sq. feet
|
2 baths 3 beds |
show details | |

|
#9
Carol Sue Ct
Bakersfield, CA 93308
|
1,890 sq. feet
|
2 baths 4 beds |
show details | |

|
#10
Lomita Verde Dr
Bakersfield, CA 93305
|
1,314 sq. feet
|
1 baths 3 beds |
show details |
| Photo | Address | Area | Beds / Baths | Price | Details |
|---|---|---|---|---|---|

|
#11
Glitter Way
Bakersfield, CA 93313
|
3,305 sq. feet
|
5 baths 5 beds |
show details | |

|
#12
Grand Central Ave
Bakersfield, CA 93311
|
1,562 sq. feet
|
2 baths 3 beds |
show details | |

|
#13
Camile Ct
Bakersfield, CA 93307
|
1,644 sq. feet
|
2 baths 3 beds |
show details | |

|
#14
Sioux Pl
Bakersfield, CA 93312
|
1,552 sq. feet
|
2 baths 4 beds |
show details | |

|
#15
Eastbourne Way
Bakersfield, CA 93309
|
- sq. feet
|
2 baths 3 beds |
show details | |

|
#16
Woodglen Dr
Bakersfield, CA 93311
|
1,612 sq. feet
|
3 baths 3 beds |
show details | |

|
#17
9th St
Bakersfield, CA 93304
|
1,536 sq. feet
|
1 baths 2 beds |
show details | |

|
#18
Jefferson St
Bakersfield, CA 93305
|
1,383 sq. feet
|
1 baths 2 beds |
show details | |

|
#19
La France Dr
Bakersfield, CA 93304
|
1,200 sq. feet
|
1 baths 3 beds |
show details | |

|
#20
Mccray St
Bakersfield, CA 93308
|
1,264 sq. feet
|
2 baths 3 beds |
show details |
| Photo | Address | Area | Beds / Baths | Price | Details |
|---|---|---|---|---|---|

|
#21
Garnsey Ave
Bakersfield, CA 93309
|
2,154 sq. feet
|
2 baths 3 beds |
show details | |

|
#22
Kickapoo Ct
Bakersfield, CA 93312
|
1,550 sq. feet
|
2 baths 4 beds |
show details | |

|
#23
Andrea Ave
Bakersfield, CA 93307
|
1,191 sq. feet
|
2 baths 3 beds |
show details | |

|
#24
Locust Ravine
Bakersfield, CA 93306
|
2,282 sq. feet
|
2 baths 3 beds |
show details | |

|
#25
Davin Park Dr
Bakersfield, CA 93308
|
3,345 sq. feet
|
3 baths 4 beds |
show details | |

|
#26
Timberpointe Dr
Bakersfield, CA 93312
|
2,877 sq. feet
|
3 baths 5 beds |
show details | |

|
#27
Elbury Ave
Bakersfield, CA 93311
|
2,614 sq. feet
|
2 baths 4 beds |
show details | |

|
#28
Hesketh Dr
Bakersfield, CA 93309
|
1,901 sq. feet
|
2 baths 3 beds |
show details | |

|
#29
Tretorn Ave
Bakersfield, CA 93313
|
1,645 sq. feet
|
2 baths 3 beds |
show details | |

|
#30
12 Morning Dr
Bakersfield, CA 93306
|
1,164 sq. feet
|
1 baths 2 beds |
show details |
| Photo | Address | Area | Beds / Baths | Price | Details |
|---|---|---|---|---|---|

|
#31
Washington St
Bakersfield, CA 93307
|
836 sq. feet
|
1 baths 2 beds |
show details | |

|
#32
Castaic Ave
Bakersfield, CA 93308
|
- sq. feet
|
2 baths 3 beds |
show details | |

|
#33
Golden Wheat Dr
Bakersfield, CA 93313
|
1,855 sq. feet
|
2 baths 3 beds |
show details | |

|
#34
Eastwind Cir
Bakersfield, CA 93306
|
1,320 sq. feet
|
2 baths 3 beds |
show details | |

|
#35
Herndon St
Bakersfield, CA 93312
|
1,287 sq. feet
|
1 baths 3 beds |
show details | |

|
#36
Canadian St
Bakersfield, CA 93304
|
1,548 sq. feet
|
2 baths 4 beds |
show details | |

|
#37
Kern Canyon Rd Spc 147
Bakersfield, CA 93306
|
1,152 sq. feet
|
2 baths 3 beds |
show details | |

|
#38
Rigby Ave
Bakersfield, CA 93307
|
1,039 sq. feet
|
1 baths 3 beds |
show details | |

|
#39
1/2 Morning Dr
Bakersfield, CA 93306
|
1,164 sq. feet
|
1 baths 2 beds |
show details | |

|
#40
Tretorn Ave
Bakersfield, CA 93313
|
2,022 sq. feet
|
2 baths 4 beds |
show details |
| Photo | Address | Area | Beds / Baths | Price | Details |
|---|---|---|---|---|---|

|
#41
Verbena Dr
Bakersfield, CA 93304
|
1,268 sq. feet
|
2 baths 3 beds |
show details | |

|
#42
Morning Dr
Bakersfield, CA 93306
|
1,164 sq. feet
|
1 baths 2 beds |
show details | |

|
#43
Arvin St
Bakersfield, CA 93308
|
1,540 sq. feet
|
1 baths 2 beds |
show details | |

|
#44
Valley Forest Ct
Bakersfield, CA 93311
|
2,379 sq. feet
|
3 baths 4 beds |
show details | |

|
#45
Avenida Del Sol
Bakersfield, CA 93307
|
1,399 sq. feet
|
2 baths 3 beds |
show details | |

|
#46
Black Knot Ct
Bakersfield, CA 93311
|
1,558 sq. feet
|
2 baths 3 beds |
show details | |

|
#47
Mayfair Ct
Bakersfield, CA 93307
|
1,007 sq. feet
|
2 baths 4 beds |
show details | |

|
#48
Sentido Dr
Bakersfield, CA 93306
|
1,375 sq. feet
|
2 baths 4 beds |
show details | |

|
#49
Shirley Ln # B
Bakersfield, CA 93307
|
532 sq. feet
|
2 baths 2 beds |
show details | |

|
Check over 1 million property listings on Foreclosure.com!
|
browse all offers | |||

Latest news about housing in Oildale, CA collected exclusively by city-data.com from local newspapers, TV, and radio stations

 | How would you rank these Central Valley cities (24 replies) |
| Bakersfield is bad compared to what? (81 replies) |
| Bakersfield Rentals (17 replies) |
| I wish Bakersfield, Ca. was Better (81 replies) |
| Moving to Bakersfield. Have not heard good things. (52 replies) |
| Good people of the Bay Area, help me dispel or confirm a stereotype? (239 replies) |
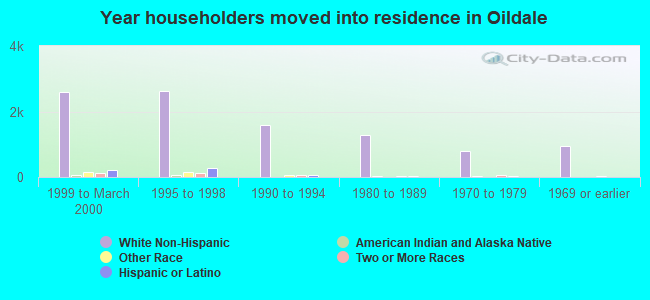
Median year apartment built: 1969
Household type by relationship:
Households: 35,149- Male householders: 6,434 (1,917 living alone), Female householders: 6,418 (1,775 living alone)
4,505 spouses (4,386 opposite-sex spouses), 1,623 unmarried partners, (1,587 opposite-sex unmarried partners), 10,257 children (9,669 natural, 79 adopted, 508 stepchildren), 1,341 grandchildren, 636 brothers or sisters, 311 parents, 0 foster children, 1,541 other relatives, 2,012 non-relatives
- In group quarters: 67
Size of family households: 2,974 2-persons, 1,730 3-persons, 1,551 4-persons, 816 5-persons, 527 6-persons, 400 7-or-more-persons.
Size of nonfamily households: 3,698 1-person, 1,151 2-persons, 120 3-persons, 20 4-persons.
3,759 married couples with children.
3,726 single-parent households (1,721 men, 2,005 women).
80.0% of residents of Oildale speak English at home.
15.0% of residents speak Spanish at home (78% speak English very well, 7% speak English well, 12% speak English not well, 3% don't speak English at all).
1.7% of residents speak other Indo-European language at home (72% speak English very well, 2% speak English well, 5% speak English not well, 21% don't speak English at all).
0.7% of residents speak Asian or Pacific Island language at home (71% speak English very well, 2% speak English well, 22% speak English not well, 5% don't speak English at all).
2.6% of residents speak other language at home (73% speak English very well, 27% speak English well).
Foreign born population: 2,127 (6.1%)
(48.2% of them are naturalized citizens)
| Here: | 5.3 |
| State: | 6.0 |
| Here: | 4.1 |
| State: | 3.9 |
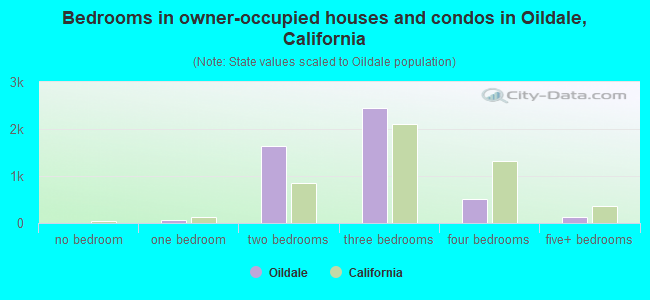
- Bedrooms in owner-occupied houses and condos in Oildale, California
- 10no bedroom
- 691 bedroom
- 1,6452 bedrooms
- 2,4403 bedrooms
- 5024 bedrooms
- 1345+ bedrooms
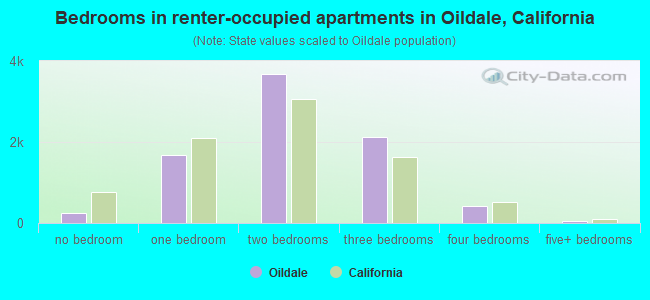
- Bedrooms in renter-occupied apartments in Oildale, California
- 251no bedroom
- 1,6911 bedroom
- 3,6682 bedrooms
- 2,1273 bedrooms
- 4164 bedrooms
- 475+ bedrooms
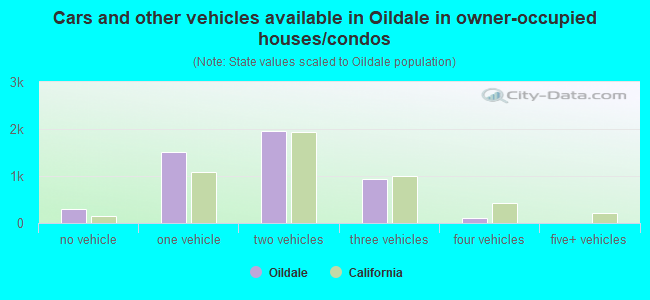
- Cars and other vehicles available in Oildale in owner-occupied houses/condos
- 294no vehicle
- 1,5141 vehicle
- 1,9532 vehicles
- 9263 vehicles
- 1064 vehicles
- 65+ vehicles
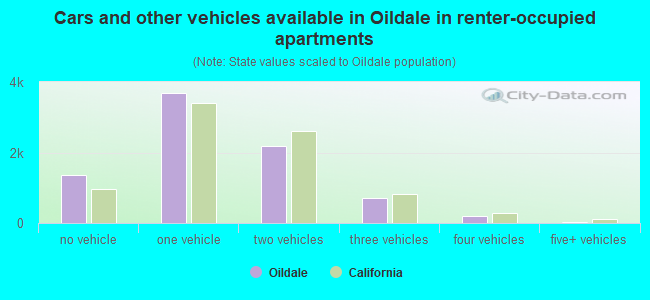
- Cars and other vehicles available in Oildale in renter-occupied apartments
- 1,371no vehicle
- 3,6801 vehicle
- 2,1982 vehicles
- 7203 vehicles
- 1974 vehicles
- 345+ vehicles
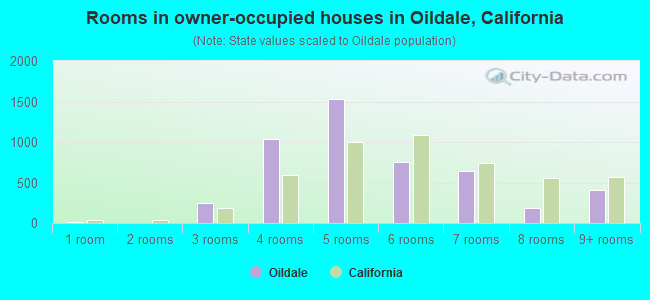
- Rooms in owner-occupied houses in Oildale, California
- 101 room
- 02 rooms
- 2413 rooms
- 1,0334 rooms
- 1,5295 rooms
- 7496 rooms
- 6447 rooms
- 1818 rooms
- 4139+ rooms
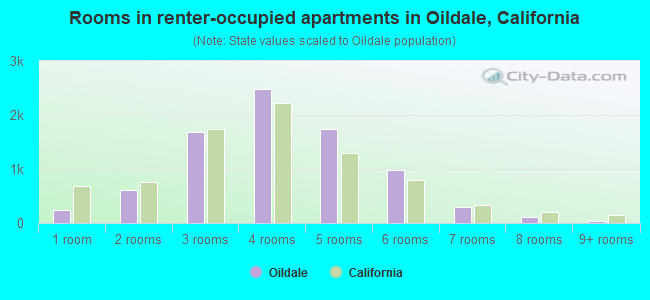
- Rooms in renter-occupied apartments in Oildale, California
- 2431 room
- 6062 rooms
- 1,6863 rooms
- 2,4904 rooms
- 1,7455 rooms
- 9886 rooms
- 2937 rooms
- 1058 rooms
- 449+ rooms
Oildale, CA household income distribution

- 914Less than $10,000
- 1,897$10,000 to $19,999
- 1,292$20,000 to $29,999
- 1,389$30,000 to $39,999
- 1,415$40,000 to $49,999
- 985$50,000 to $59,999
- 1,277$60,000 to $74,999
- 1,163$75,000 to $99,999
- 1,308$100,000 to $124,999
- 387$125,000 to $149,999
- 449$150,000 to $199,999
- 326$200,000 or more

Home value of owner - occupied houses in 2022 in Oildale, CA
-
- 163Less than $10,000
- 59$10,000 to $14,999
- 15$15,000 to $19,999
- 27$20,000 to $24,999
- 57$30,000 to $34,999
- 11$35,000 to $39,999
- 33$40,000 to $49,999
- 89$50,000 to $59,999
- 26$60,000 to $69,999
- 62$70,000 to $79,999
- 151$80,000 to $89,999
- 51$90,000 to $99,999
- 278$100,000 to $124,999
- 120$125,000 to $149,999
- 422$150,000 to $174,999
- 285$175,000 to $199,999
- 621$200,000 to $249,999
- 552$250,000 to $299,999
- 586$300,000 to $399,999
- 85$400,000 to $499,999
- 136$500,000 to $749,999
- 248$750,000 to $999,999
- 21$1,000,000 to $1,499,999
- 10$1,500,000 to $1,999,999
- 19$2,000,000 or more
Rent paid by renters in 2022 in Oildale, CA
-
- 27Less than $100
- 23$150 to $199
- 50$300 to $349
- 115$350 to $399
- 90$400 to $449
- 102$450 to $499
- 311$500 to $549
- 427$550 to $599
- 411$600 to $649
- 383$650 to $699
- 348$700 to $749
- 642$750 to $799
- 847$800 to $899
- 908$900 to $999
- 1,770$1,000 to $1,249
- 744$1,250 to $1,499
- 340$1,500 to $1,999
- 85$2,000 to $2,499
- 25$3,500 or more
- 202No cash rent
Percentage of workers working in this county: 95.2%
Number of people working at home: 470 (3.6% of all workers)
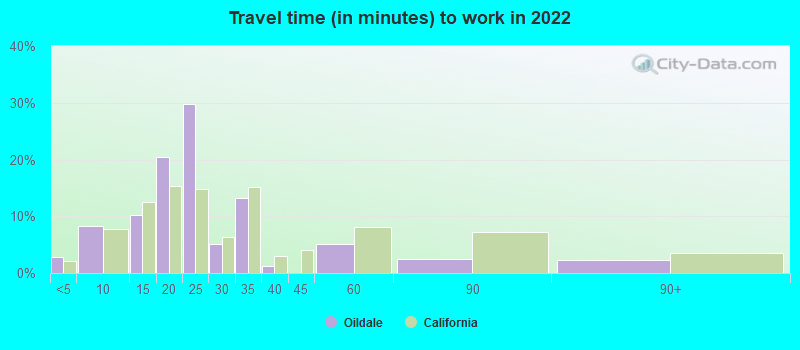
Travel time to work (commute)
- Less than 5 minutes: 214
- 5 to 9 minutes: 951
- 10 to 14 minutes: 2,802
- 15 to 19 minutes: 2,590
- 20 to 24 minutes: 2,283
- 25 to 29 minutes: 677
- 30 to 34 minutes: 1,593
- 35 to 39 minutes: 256
- 40 to 44 minutes: 206
- 45 to 59 minutes: 100
- 60 to 89 minutes: 597
- 90 or more minutes: 411
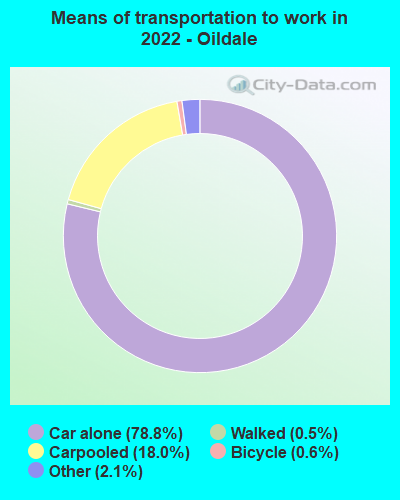
Means of transportation to work:
- Drove a car alone: 3,958 (72.1%)
- Carpooled: 904 (16.5%)
- Taxi: 138 (2.5%)
- Bicycle: 17 (0.3%)
- Walked: 27 (0.5%)
- Worked at home: 470 (8.6%)
- Unemployment by race in 2022
- Unemployment rate for White non-Hispanic residents
- 12.8%Males
- 7.8%Females
- Unemployment rate for Asian residents
- 7.4%Males
- 8.4%Females
- Unemployment rate for other race residents
- 6.7%Males
- 9.5%Females
- Unemployment rate for two or more race residents
- 10.6%Males
- 12.1%Females
- Unemployment rate for Hispanic or Latino residents
- 6.1%Males
- 7.9%Females
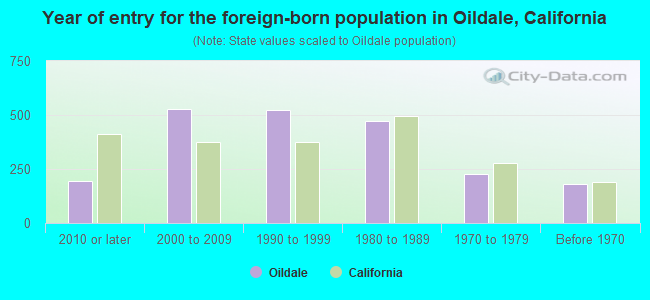
- Year of entry for the foreign-born population in Oildale, California
- 1932010 or later
- 5262000 to 2009
- 5251990 to 1999
- 4721980 to 1989
- 2271970 to 1979
- 180Before 1970
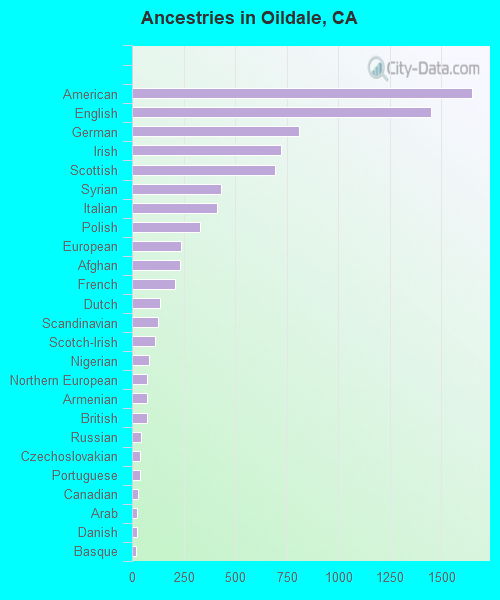
First ancestries reported:
- American: 1,649 (9.1%)
- English: 1,449 (8.0%)
- German: 812 (4.5%)
- Irish: 724 (4.0%)
- Scottish: 695 (3.8%)
- Syrian: 431 (2.4%)
- Italian: 412 (2.3%)
- Polish: 329 (1.8%)
- European: 239 (1.3%)
- Afghan: 235 (1.3%)
- French: 208 (1.2%)
- Dutch: 138 (0.8%)
- Scandinavian: 125 (0.7%)
- Scotch-Irish: 111 (0.6%)
- Nigerian: 84 (0.5%)
- Northern European: 75 (0.4%)
- Armenian: 72 (0.4%)
- British: 72 (0.4%)
- Russian: 43 (0.2%)
- Czechoslovakian: 41 (0.2%)
- Portuguese: 38 (0.2%)
- Canadian: 28 (0.2%)
- Arab: 22 (0.1%)
- Danish: 22 (0.1%)
- Basque: 18 (0.10%)
- Eastern European: 17 (0.09%)
- Celtic: 9 (0.05%)
- Hungarian: 7 (0.04%)
- African: 6 (0.03%)
- Norwegian: 1 (0.01%)
Most common places of birth for foreign-born residents (%):
| Oildale: | 50.0% (1,087) |
| California: | 37.2% (3,881,193) |
| Oildale: | 9.9% (214) |
| California: | 4.2% (440,287) |
| Oildale: | 6.8% (147) |
| California: | 0.3% (30,949) |
| Oildale: | 5.7% (124) |
| California: | 0.5% (53,260) |
| Oildale: | 3.1% (68) |
| California: | 2.0% (206,004) |
| Oildale: | 2.9% (62) |
| California: | 0.7% (73,304) |
| Oildale: | 2.6% (57) |
| California: | 0.3% (33,029) |
| Oildale: | 2.5% (55) |
| California: | 4.9% (512,335) |
| Oildale: | 2.3% (49) |
| California: | 0.7% (71,932) |
| Oildale: | 2.1% (46) |
| California: | 2.8% (290,436) |
| Oildale: | 1.7% (38) |
| California: | 0.6% (60,582) |
| Oildale: | 1.6% (35) |
| California: | 1.2% (127,477) |
Place of birth for U.S.-born residents:
- This state: 28,538
- Other state: 4,275
- Northeast: 412
- Midwest: 902
- South: 1,310
- West: 1,726
88.5% of Oildale residents lived in the same house 1 years ago.
Out of people who lived in different houses, 37.3% lived in this county.
Out of people who lived in different counties, 75.8% lived in California.
| Oildale: | 88.5% |
| State average: | 88.9% |
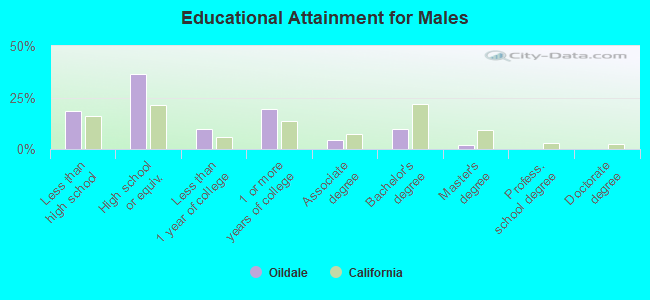
Education attainment for males 25 years and older:
- No schooling: 462
- Nursery to 4th grade: 46
- 5th and 6th grade: 21
- 7th and 8th grade: 225
- 9th grade: 289
- 10th grade: 165
- 11th grade: 456
- 12th grade, no diploma: 366
- High school graduate (or equivalency): 4,025
- Less than 1 year of college: 1,075
- Some college more than 1 year, no degree: 2,141
- Associate degree: 486
- Bachelor's degree: 1,065
- Master's degree: 197
- Professional school degree: 23
- Doctorate degree: 10
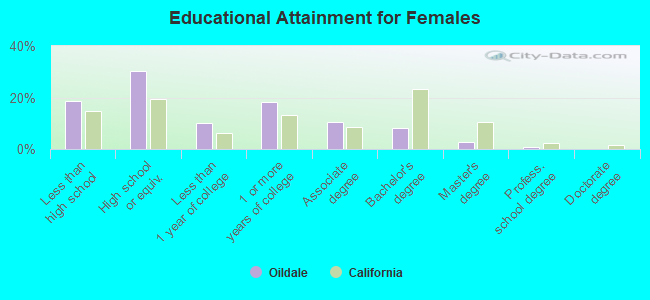
Education attainment for females 25 years and older:
- No schooling: 394
- Nursery to 4th grade: 46
- 5th and 6th grade: 54
- 7th and 8th grade: 292
- 9th grade: 23
- 10th grade: 278
- 11th grade: 468
- 12th grade, no diploma: 652
- High school graduate (or equivalency): 3,613
- Less than 1 year of college: 1,205
- Some college more than 1 year, no degree: 2,176
- Associate degree: 1,248
- Bachelor's degree: 964
- Master's degree: 320
- Professional school degree: 112
- Doctorate degree: 19
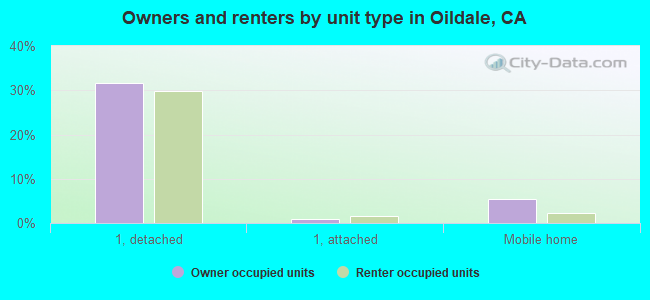
Housing units in structures:
- One, detached: 9,068
- One, attached: 360
- Two: 1,409
- 3 or 4: 1,166
- 5 to 9: 329
- 10 to 19: 211
- 20 to 49: 108
- 50 or more: 239
- Mobile homes: 1,126
- Boats, RVs, vans, etc.: 73
Median worth of mobile homes: $41,330
Housing units lacking complete kitchen facilities in 2022: 4.3%
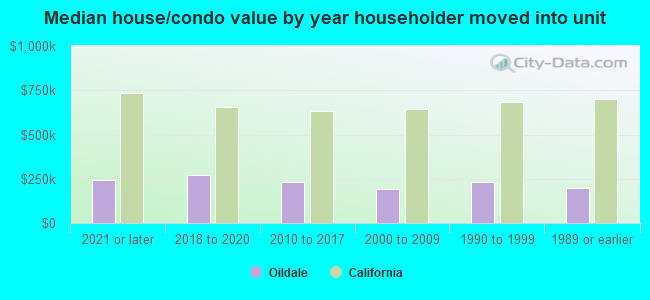
House/condo owner moved in on average 9 years ago
Renter moved in on average 2 years ago
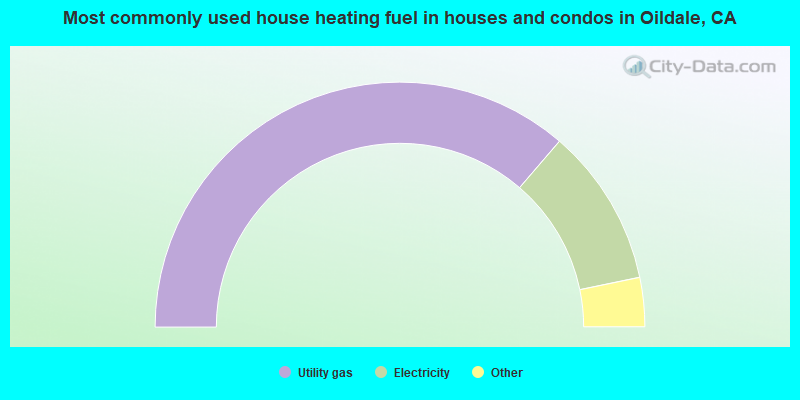
- 72.6%Utility gas
- 20.9%Electricity
- 2.8%Solar energy
- 1.4%Bottled, tank, or LP gas
- 1.3%No fuel used
- 0.6%Fuel oil, kerosene, etc.
- 0.3%Other fuel
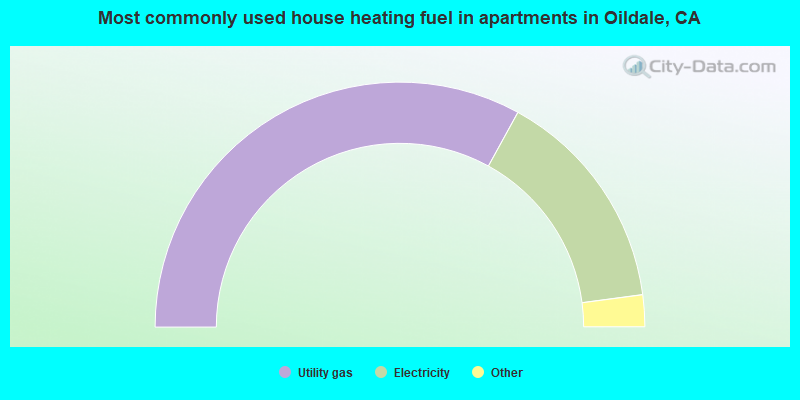
- 66.0%Utility gas
- 29.8%Electricity
- 2.4%No fuel used
- 0.9%Bottled, tank, or LP gas
- 0.4%Solar energy
- 0.4%Other fuel
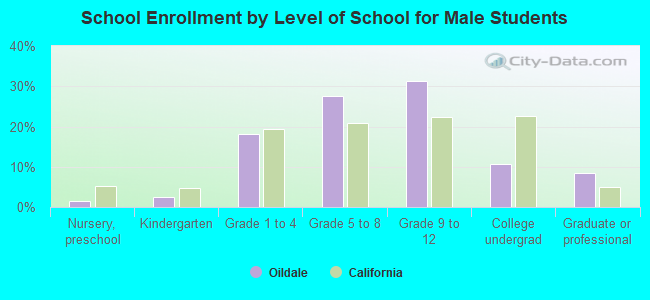
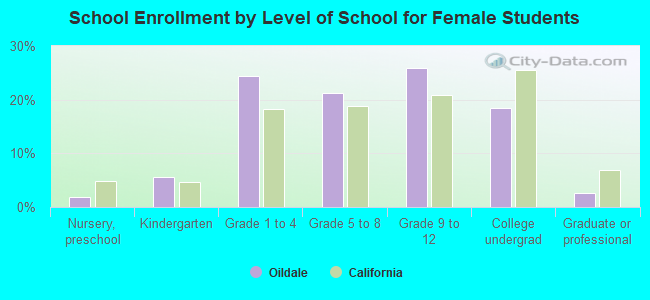
Private vs. public school enrollment:
| Here: | 1.8% |
| California: | 10.5% |
| Here: | 3.4% |
| California: | 8.5% |
| Here: | 3.0% |
| California: | 15.9% |