Oglesby, IL (Illinois) Houses and Residents
| Oglesby: | $131,201 |
| Illinois: | $251,600 |
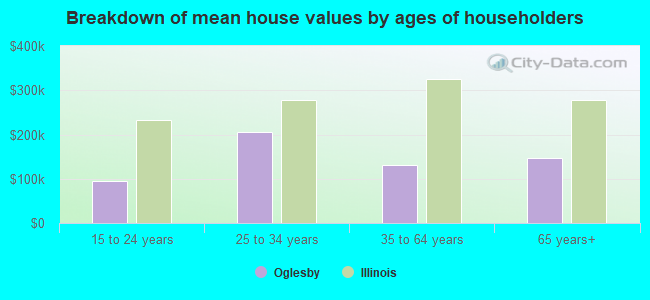
Mean price in 2022:
Detached houses: $147,570
Here: $147,570 State: $310,164 Townhouses or other attached units: $145,334
Here: $145,334 State: $286,230 Mobile homes: $51,666
Here: $51,666 State: $78,855
Total population: 3,676 (Urban population: 3,199 (all inside urban clusters), Rural population: 405 (all nonfarm))
Houses: 1,817 (1,638 occupied: 1,275 owner occupied, 364 renter occupied)
| % of renters here: | 22% |
| State: | 33% |
Housing density: 454 houses/condos per square mile
Median price asked for vacant for-sale houses and condos in 2022: $122,663.
Median contract rent in 2022: $514 (lower quartile is $432, upper quartile is $695)
Median rent asked for vacant for-rent units in 2022: $1,181
Median gross rent in Oglesby, IL in 2022: $689
Housing units in Oglesby with a mortgage: 730 (82 second mortgage, 0 home equity loan, 32 both second mortgage and home equity loan)
Houses without a mortgage: 15
Median household income for houses/condos with a mortgage: $86,226
Median household income for apartments without a mortgage: $49,728
Median monthly housing costs: $812
Compare current foreclosures near Oglesby, IL:
| Photo | Address | Area | Beds / Baths | Price | Details |
|---|---|---|---|---|---|

|
#1
E 1st St
Oglesby, IL 61348
|
- sq. feet
|
- baths - beds |
show details | |

|
#2
Cedar Creek Ln
Oglesby, IL 61348
|
- sq. feet
|
- baths - beds |
show details | |

|
#3
Field Ave
Oglesby, IL 61348
|
- sq. feet
|
- baths - beds |
show details | |

|
#4
E 450th Rd
Oglesby, IL 61348
|
- sq. feet
|
- baths - beds |
show details | |

|
#5
Sunset Blvd
Oglesby, IL 61348
|
- sq. feet
|
- baths - beds |
show details | |

|
#6
Cerulla Cir
Oglesby, IL 61348
|
- sq. feet
|
- baths - beds |
show details | |

|
#7
W 2nd St
Oglesby, IL 61348
|
- sq. feet
|
- baths - beds |
show details | |

|
#8
N School Ave
Oglesby, IL 61348
|
- sq. feet
|
- baths - beds |
show details | |

|
#9
E Porter St
Oglesby, IL 61348
|
- sq. feet
|
- baths - beds |
show details | |

|
#10
Lehigh Ave
Oglesby, IL 61348
|
- sq. feet
|
- baths - beds |
show details |
| Photo | Address | Area | Beds / Baths | Price | Details |
|---|---|---|---|---|---|

|
#11
N Columbia Ave
Oglesby, IL 61348
|
- sq. feet
|
- baths - beds |
show details | |

|
#12
Clark St
Oglesby, IL 61348
|
- sq. feet
|
- baths - beds |
show details | |

|
#13
E 4th St
Spring Valley, IL 61362
|
- sq. feet
|
1 baths 3 beds |
show details | |

|
#14
Palmor Dr
Ottawa, IL 61350
|
1,340 sq. feet
|
1 baths 2 beds |
show details | |

|
#15
Caton Rd
Ottawa, IL 61350
|
1,258 sq. feet
|
1 baths 3 beds |
show details | |

|
#16
Anita Dr
Ottawa, IL 61350
|
1,344 sq. feet
|
1 baths 3 beds |
show details | |

|
#17
Lincoln St
Seatonville, IL 61359
|
2,308 sq. feet
|
3 baths 4 beds |
show details | |

|
#18
1st Ave
Ottawa, IL 61350
|
1,152 sq. feet
|
1 baths 2 beds |
show details | |

|
#19
2nd St
La Salle, IL 61301
|
- sq. feet
|
2 baths 3 beds |
show details | |

|
#20
State St
Ottawa, IL 61350
|
1,444 sq. feet
|
2 baths 3 beds |
show details |
| Photo | Address | Area | Beds / Baths | Price | Details |
|---|---|---|---|---|---|

|
#21
Reading St
Streator, IL 61364
|
1,350 sq. feet
|
2 baths 3 beds |
show details | |

|
#22
9th St
La Salle, IL 61301
|
2,771 sq. feet
|
- baths - beds |
show details | |

|
#23
Pike St
Peru, IL 61354
|
672 sq. feet
|
- baths - beds |
show details | |

|
#24
Section St
Streator, IL 61364
|
1,800 sq. feet
|
- baths 3 beds |
show details | |

|
#25
E 6th St
Spring Valley, IL 61362
|
- sq. feet
|
- baths - beds |
show details | |

|
#26
E 1st St
Spring Valley, IL 61362
|
- sq. feet
|
- baths - beds |
show details | |

|
#27
Gary St
Leonore, IL 61332
|
- sq. feet
|
- baths - beds |
show details | |

|
#28
N 17th Rd
Tonica, IL 61370
|
- sq. feet
|
- baths - beds |
show details | |

|
#29
2nd St
Mark, IL 61340
|
- sq. feet
|
- baths - beds |
show details | |

|
#30
N Main St
Lostant, IL 61334
|
- sq. feet
|
- baths - beds |
show details |
| Photo | Address | Area | Beds / Baths | Price | Details |
|---|---|---|---|---|---|

|
#31
Pontiac St
Tonica, IL 61370
|
- sq. feet
|
- baths - beds |
show details | |

|
#32
Grant Ave Apt 114
La Salle, IL 61301
|
- sq. feet
|
- baths - beds |
show details | |

|
#33
Fillmore St
Ottawa, IL 61350
|
- sq. feet
|
- baths - beds |
show details | |

|
#34
E Erie St
Spring Valley, IL 61362
|
- sq. feet
|
- baths - beds |
show details | |

|
#35
E 4th St
Depue, IL 61322
|
- sq. feet
|
- baths - beds |
show details | |

|
#36
Catherine St
Ottawa, IL 61350
|
- sq. feet
|
- baths - beds |
show details | |

|
#37
Columbus St Apt 7
Ottawa, IL 61350
|
- sq. feet
|
- baths - beds |
show details | |

|
#38
W Fremont St
Ottawa, IL 61350
|
- sq. feet
|
- baths - beds |
show details | |

|
#39
4th Ave
Ottawa, IL 61350
|
- sq. feet
|
- baths - beds |
show details | |

|
#40
E 4th St
Depue, IL 61322
|
- sq. feet
|
- baths - beds |
show details |
| Photo | Address | Area | Beds / Baths | Price | Details |
|---|---|---|---|---|---|

|
#41
Claire Ln
Utica, IL 61373
|
- sq. feet
|
- baths - beds |
show details | |

|
#42
7th Ave
Ottawa, IL 61350
|
- sq. feet
|
- baths - beds |
show details | |

|
#43
1/2 Finley Cir
Grand Ridge, IL 61325
|
- sq. feet
|
- baths - beds |
show details | |

|
#44
E Stevenson Rd
Ottawa, IL 61350
|
- sq. feet
|
- baths - beds |
show details | |

|
#45
E 1919th Rd
Ottawa, IL 61350
|
- sq. feet
|
- baths - beds |
show details | |

|
#46
E High St
Hennepin, IL 61327
|
- sq. feet
|
- baths - beds |
show details | |

|
#47
N State Route 23
Ottawa, IL 61350
|
- sq. feet
|
- baths - beds |
show details | |

|
#48
W Stanton St
Streator, IL 61364
|
- sq. feet
|
- baths - beds |
show details | |

|
#49
Roberts Rd
Magnolia, IL 61336
|
- sq. feet
|
- baths - beds |
show details | |

|
Check over 1 million property listings on Foreclosure.com!
|
browse all offers | |||

Latest news about housing in Oglesby, IL collected exclusively by city-data.com from local newspapers, TV, and radio stations

 | La Salle or Peru (23 replies) |
| Memories of Jeffrey Manor?? (58 replies) |
| is South Shore Being Gentrified? (26 replies) |
| Rent car for stay in Arlington Heights? Visiting downtown Chicago. (12 replies) |
| Job in Oglesby, IL 61348 (3 replies) |
| Towns in LaSalle county for busy family (9 replies) |

Median year apartment built: 1971
Household type by relationship:
Households: 3,690- Male householders: 850 (244 living alone), Female householders: 764 (280 living alone)
662 spouses (653 opposite-sex spouses), 180 unmarried partners, (180 opposite-sex unmarried partners), 1,175 children (1,096 natural, 0 adopted, 78 stepchildren), 16 grandchildren, 0 brothers or sisters, 4 parents, 0 foster children, 8 other relatives, 25 non-relatives
Size of family households: 553 2-persons, 211 3-persons, 87 4-persons, 65 5-persons, 28 6-persons.
Size of nonfamily households: 544 1-person, 103 2-persons.
467 married couples with children.
350 single-parent households (108 men, 242 women).
89.1% of residents of Oglesby speak English at home.
10.0% of residents speak Spanish at home (86% speak English very well, 11% speak English well, 3% speak English not well).
0.2% of residents speak other Indo-European language at home (100% speak English well).
0.3% of residents speak other language at home (100% speak English very well).
Foreign born population: 139 (3.8%)
(33.1% of them are naturalized citizens)
| Here: | 5.6 |
| State: | 6.4 |
| Here: | 4.1 |
| State: | 4.1 |
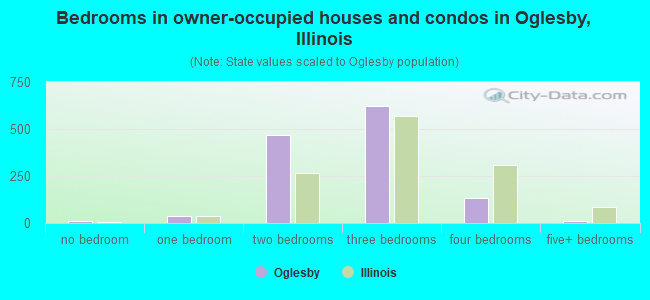
- Bedrooms in owner-occupied houses and condos in Oglesby, Illinois
- 8no bedroom
- 351 bedroom
- 4662 bedrooms
- 6203 bedrooms
- 1354 bedrooms
- 115+ bedrooms
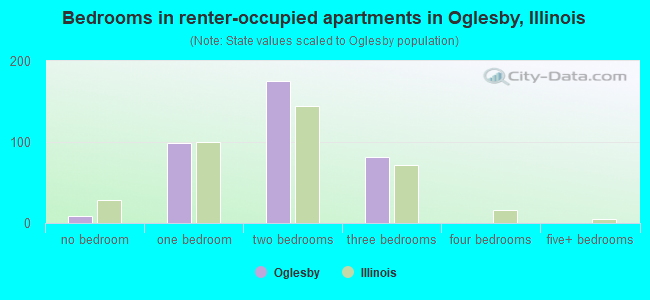
- Bedrooms in renter-occupied apartments in Oglesby, Illinois
- 9no bedroom
- 991 bedroom
- 1752 bedrooms
- 813 bedrooms
- 04 bedrooms
- 05+ bedrooms
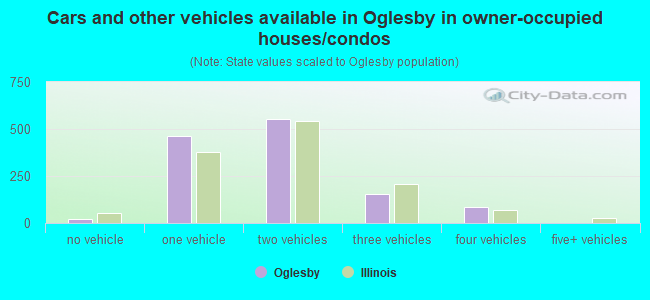
- Cars and other vehicles available in Oglesby in owner-occupied houses/condos
- 22no vehicle
- 4631 vehicle
- 5522 vehicles
- 1533 vehicles
- 854 vehicles
- 05+ vehicles
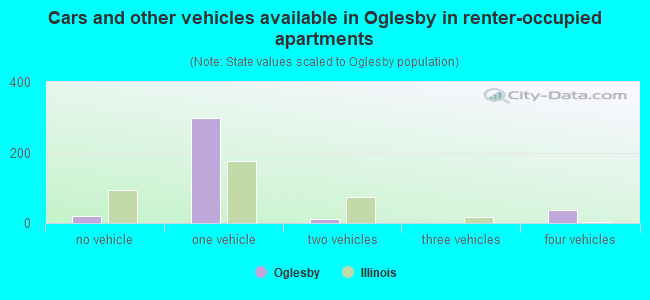
- Cars and other vehicles available in Oglesby in renter-occupied apartments
- 19no vehicle
- 2991 vehicle
- 102 vehicles
- 03 vehicles
- 374 vehicles
- 05+ vehicles
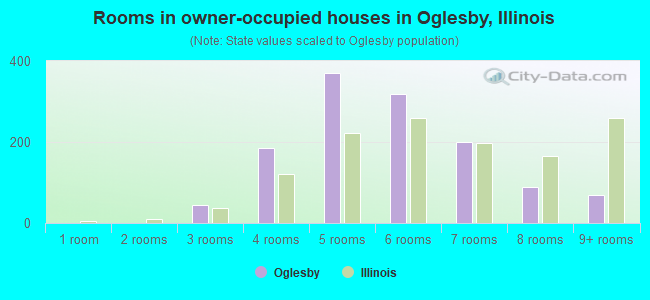
- Rooms in owner-occupied houses in Oglesby, Illinois
- 01 room
- 02 rooms
- 453 rooms
- 1844 rooms
- 3705 rooms
- 3186 rooms
- 1997 rooms
- 898 rooms
- 709+ rooms
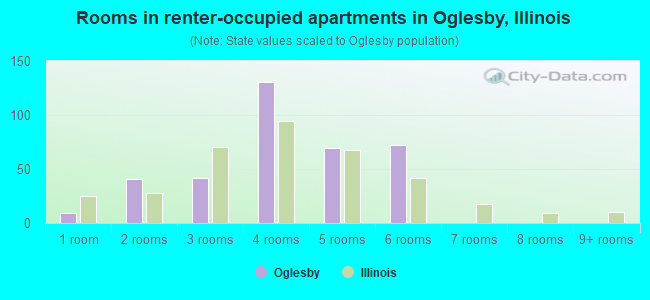
- Rooms in renter-occupied apartments in Oglesby, Illinois
- 91 room
- 412 rooms
- 423 rooms
- 1314 rooms
- 695 rooms
- 726 rooms
- 07 rooms
- 08 rooms
- 09+ rooms
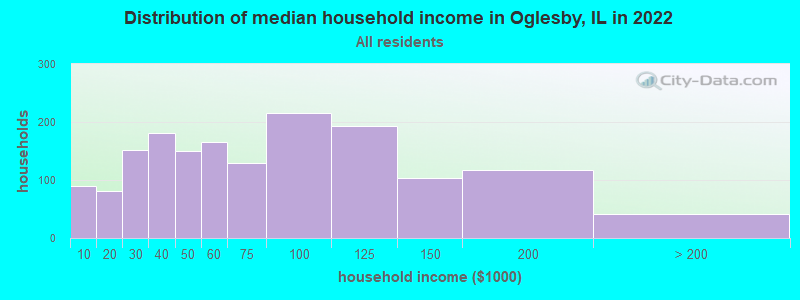
Oglesby, IL household income distribution

- 89Less than $10,000
- 81$10,000 to $19,999
- 152$20,000 to $29,999
- 181$30,000 to $39,999
- 150$40,000 to $49,999
- 166$50,000 to $59,999
- 129$60,000 to $74,999
- 215$75,000 to $99,999
- 193$100,000 to $124,999
- 103$125,000 to $149,999
- 117$150,000 to $199,999
- 42$200,000 or more
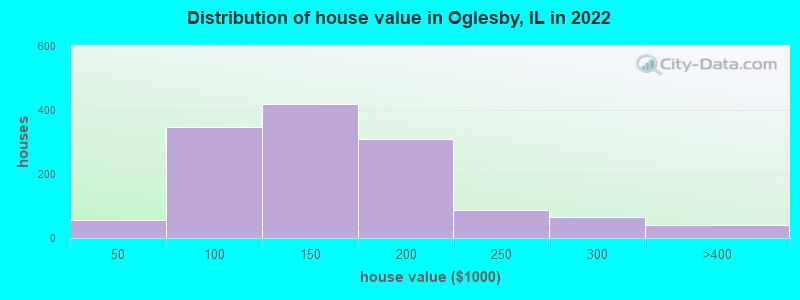
Home value of owner - occupied houses in 2022 in Oglesby, IL
-
- 25Less than $10,000
- 12$20,000 to $24,999
- 18$40,000 to $49,999
- 31$50,000 to $59,999
- 15$60,000 to $69,999
- 39$70,000 to $79,999
- 173$80,000 to $89,999
- 67$90,000 to $99,999
- 234$100,000 to $124,999
- 185$125,000 to $149,999
- 253$150,000 to $174,999
- 55$175,000 to $199,999
- 87$200,000 to $249,999
- 66$250,000 to $299,999
- 42$300,000 to $399,999
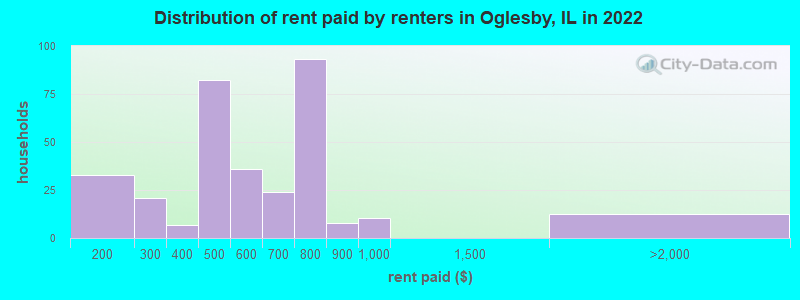
Rent paid by renters in 2022 in Oglesby, IL
-
- 32$100 to $149
- 21$250 to $299
- 7$350 to $399
- 59$400 to $449
- 22$450 to $499
- 35$550 to $599
- 24$650 to $699
- 43$700 to $749
- 49$750 to $799
- 7$800 to $899
- 10$900 to $999
- 12$1,500 to $1,999
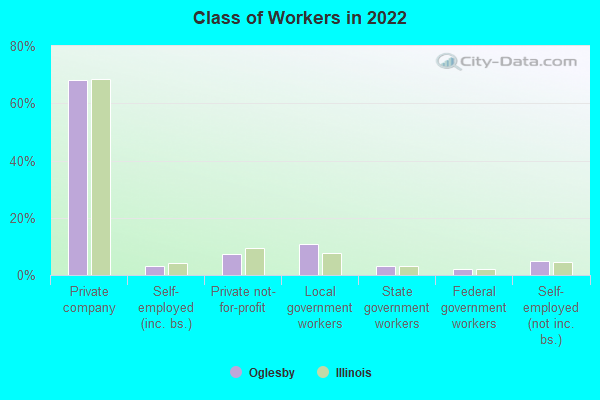
Percentage of workers working in this county: 86.3%
Number of people working at home: 90 (5.4% of all workers)
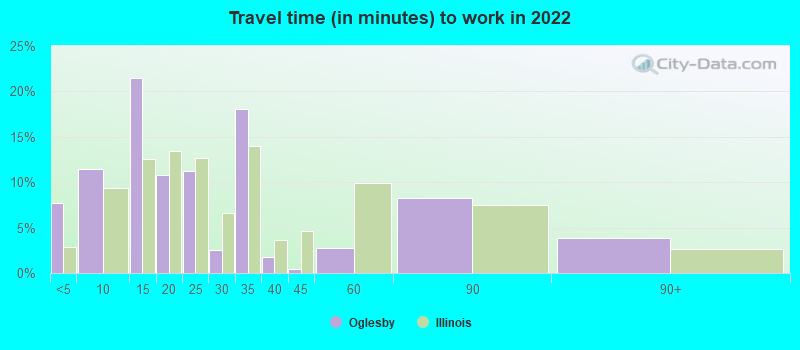
Travel time to work (commute)
- Less than 5 minutes: 125
- 5 to 9 minutes: 130
- 10 to 14 minutes: 309
- 15 to 19 minutes: 350
- 20 to 24 minutes: 210
- 25 to 29 minutes: 135
- 30 to 34 minutes: 92
- 35 to 39 minutes: 0
- 40 to 44 minutes: 14
- 45 to 59 minutes: 58
- 60 to 89 minutes: 46
- 90 or more minutes: 33
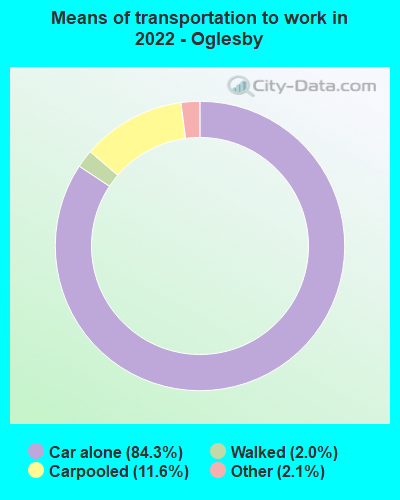
Means of transportation to work:
- Drove a car alone: 1,501 (81.8%)
- Carpooled: 186 (10.1%)
- Taxi: 84 (4.6%)
- Walked: 27 (1.5%)
- Worked at home: 55 (3.0%)
- Unemployment by race in 2022
- Unemployment rate for White non-Hispanic residents
- 1.8%Males
- 1.1%Females
- Unemployment rate for two or more race residents
- 14.0%Males
- Unemployment rate for Hispanic or Latino residents
- 12.2%Males
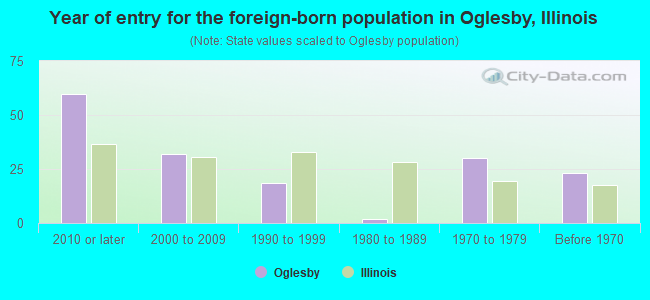
- Year of entry for the foreign-born population in Oglesby, Illinois
- 602010 or later
- 322000 to 2009
- 181990 to 1999
- 21980 to 1989
- 301970 to 1979
- 23Before 1970
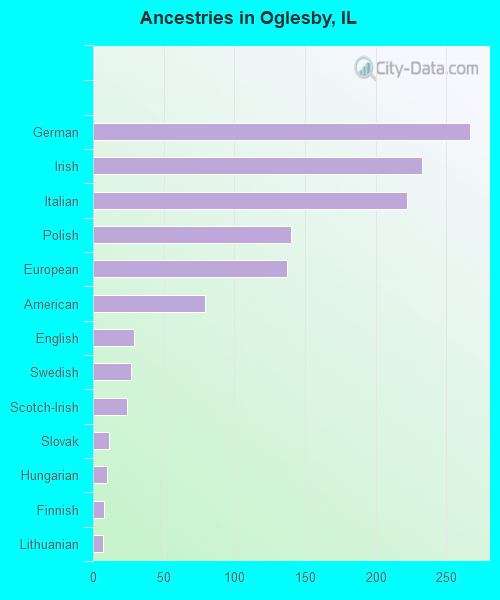
First ancestries reported:
- German: 267 (16.4%)
- Irish: 233 (14.3%)
- Italian: 222 (13.6%)
- Polish: 140 (8.6%)
- European: 137 (8.4%)
- American: 79 (4.8%)
- English: 29 (1.8%)
- Swedish: 27 (1.7%)
- Scotch-Irish: 24 (1.5%)
- Slovak: 11 (0.7%)
- Hungarian: 10 (0.6%)
- Finnish: 8 (0.5%)
- Lithuanian: 7 (0.4%)
Most common places of birth for foreign-born residents (%):
| Oglesby: | 90.4% (103) |
| Illinois: | 34.7% (626,958) |
| Oglesby: | 11.4% (13) |
| Illinois: | 0.0% (422) |
Place of birth for U.S.-born residents:
- This state: 3,211
- Other state: 341
- Northeast: 3
- Midwest: 303
- South: 35
- West: 48
83.6% of Oglesby residents lived in the same house 1 years ago.
Out of people who lived in different houses, 46.0% lived in this county.
Out of people who lived in different counties, 25.0% lived in Illinois.
| Oglesby: | 83.6% |
| State average: | 88.3% |
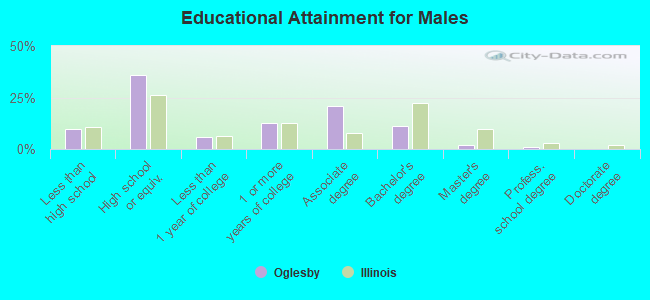
Education attainment for males 25 years and older:
- No schooling: 20
- Nursery to 4th grade: 32
- 5th and 6th grade: 0
- 7th and 8th grade: 8
- 9th grade: 0
- 10th grade: 0
- 11th grade: 54
- 12th grade, no diploma: 7
- High school graduate (or equivalency): 445
- Less than 1 year of college: 72
- Some college more than 1 year, no degree: 157
- Associate degree: 257
- Bachelor's degree: 140
- Master's degree: 25
- Professional school degree: 14
- Doctorate degree: 0
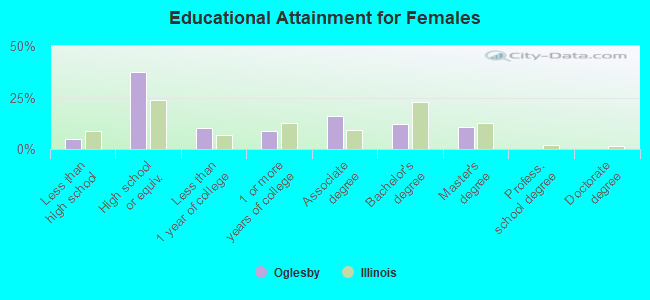
Education attainment for females 25 years and older:
- No schooling: 23
- Nursery to 4th grade: 0
- 5th and 6th grade: 0
- 7th and 8th grade: 16
- 9th grade: 0
- 10th grade: 3
- 11th grade: 24
- 12th grade, no diploma: 0
- High school graduate (or equivalency): 486
- Less than 1 year of college: 132
- Some college more than 1 year, no degree: 111
- Associate degree: 208
- Bachelor's degree: 160
- Master's degree: 138
- Professional school degree: 0
- Doctorate degree: 0


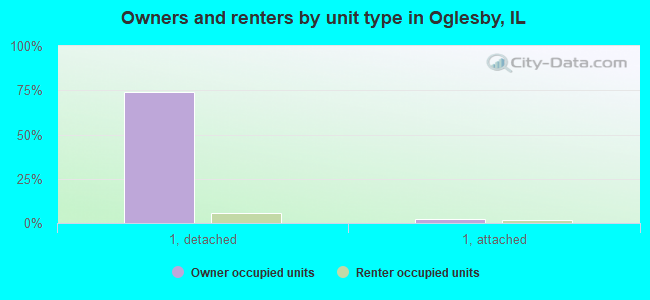
Housing units in structures:
- One, detached: 1,351
- One, attached: 118
- Two: 154
- 3 or 4: 101
- 5 to 9: 57
- Mobile homes: 35
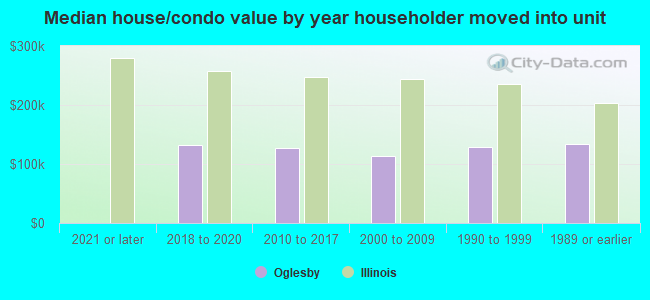
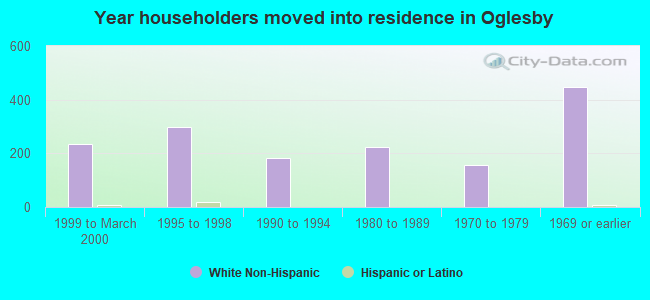
House/condo owner moved in on average 14 years ago
Renter moved in on average 0 years ago
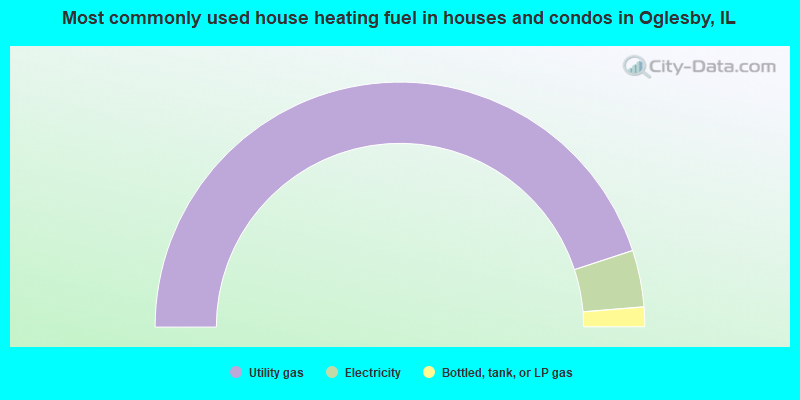
- 89.9%Utility gas
- 7.5%Electricity
- 2.6%Bottled, tank, or LP gas
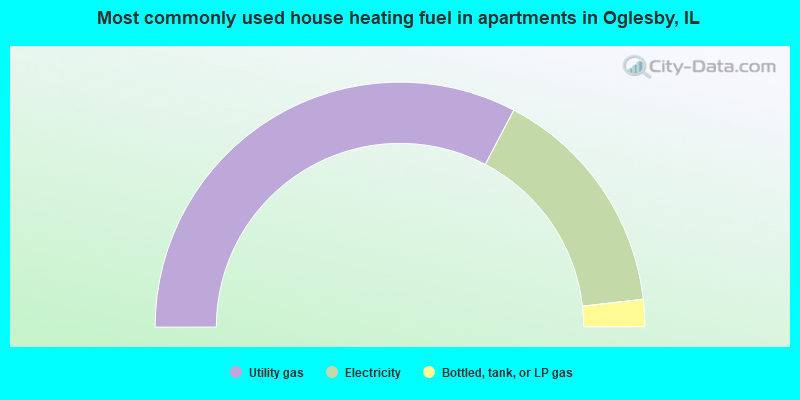
- 65.4%Utility gas
- 31.0%Electricity
- 3.6%Bottled, tank, or LP gas
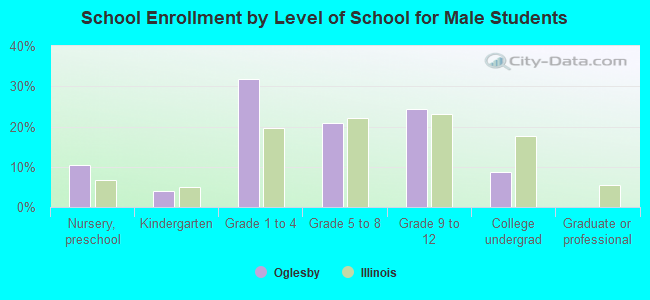
Private vs. public school enrollment:
| Here: | 11.0% |
| Illinois: | 13.3% |
| Here: | 5.1% |
| Illinois: | 9.9% |
| Here: | 16.2% |
| Illinois: | 27.4% |