Housing density: 1,724 houses/condos per square mile
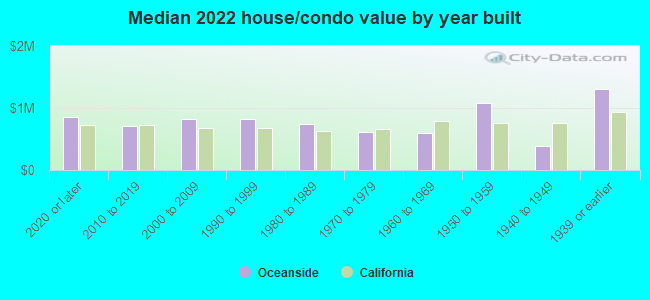
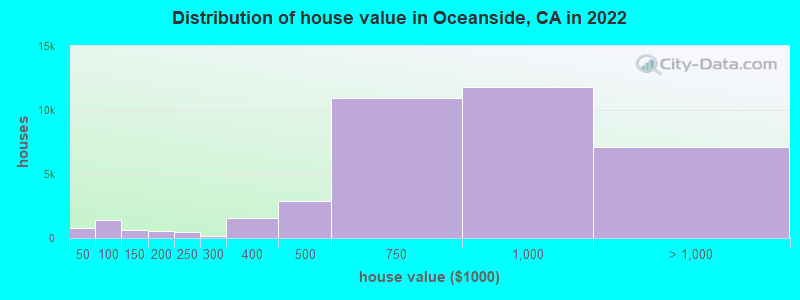
Median price asked for vacant for-sale houses and condos in 2022: $1,209,657.
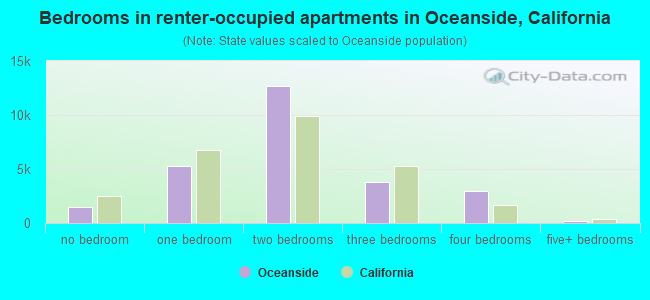
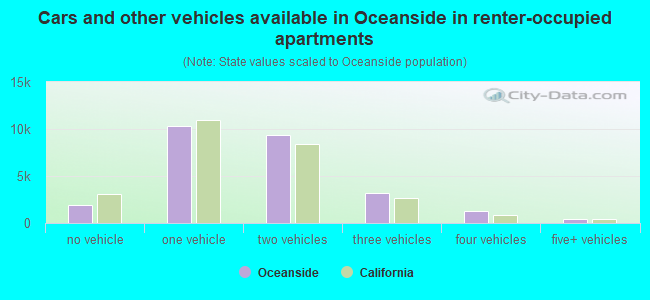
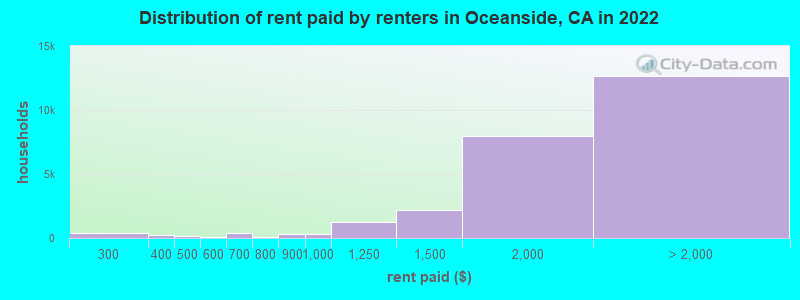
Median contract rent in 2022: $1,947 (lower quartile is $1,508, upper quartile is over $2,000)
Median rent asked for vacant for-rent units in 2022: $1,854
Median gross rent in Oceanside, CA in 2022: over $2,000
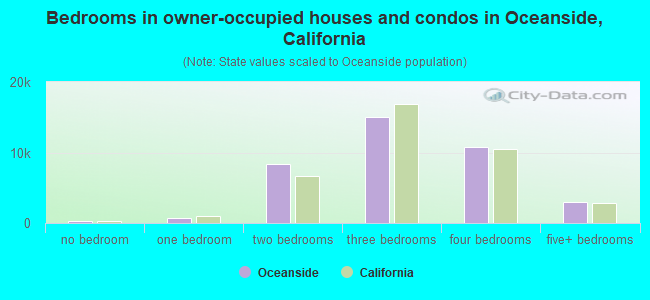
Housing units in Oceanside with a mortgage: 25,605 (1,843 second mortgage, 48 home equity loan, 1,538 both second mortgage and home equity loan) Houses without a mortgage: 443
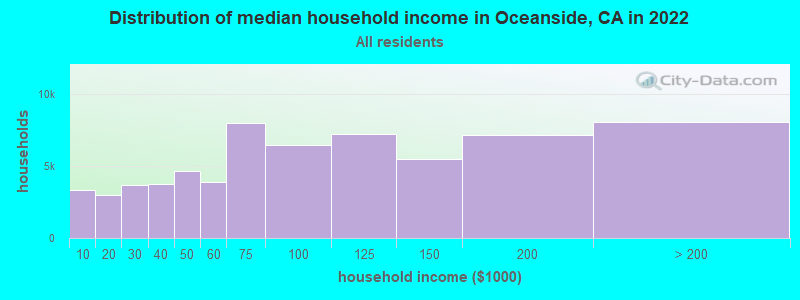
Median household income for houses/condos with a mortgage: $120,152
Median household income for apartments without a mortgage: $73,466
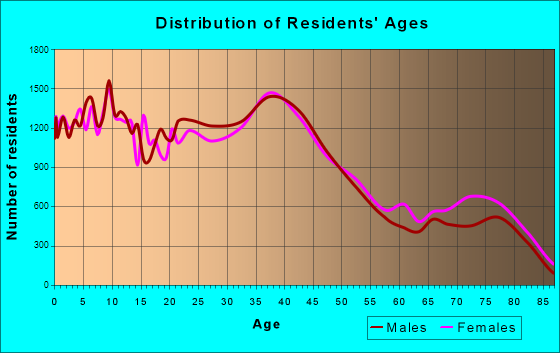
24,084 married couples with children.
7,489 single-parent households (2,260 men, 5,229 women).
65.6% of residents of Oceanside speak English at home.
25.3% of residents speak Spanish at home (63% speak English very well, 15% speak English well, 11% speak English not well, 10% don't speak English at all).
3.0% of residents speak other Indo-European language at home (74% speak English very well, 21% speak English well, 4% speak English not well).
5.5% of residents speak Asian or Pacific Island language at home (51% speak English very well, 30% speak English well, 16% speak English not well, 3% don't speak English at all).
0.4% of residents speak other language at home (80% speak English very well, 15% speak English well, 5% speak English not well).
Foreign born population: 37,102 (21.5%)
(60.9% of them are naturalized citizens)
Percentage of workers working in this county: 95.5% Number of people working at home: 15,470 (17.8% of all workers)
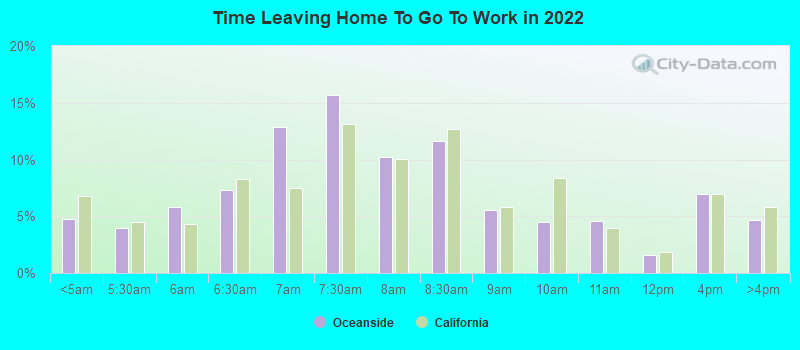
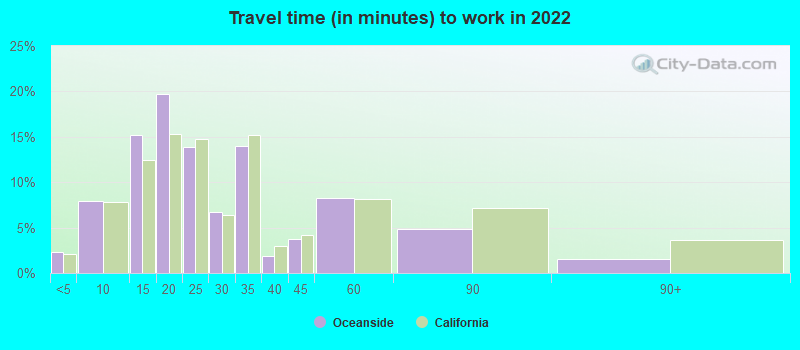
Travel time to work (commute)
Less than 5 minutes: 1,510
5 to 9 minutes: 4,037
10 to 14 minutes: 8,499
15 to 19 minutes: 10,309
20 to 24 minutes: 13,585
25 to 29 minutes: 4,898
30 to 34 minutes: 11,910
35 to 39 minutes: 2,150
40 to 44 minutes: 4,143
45 to 59 minutes: 5,380
60 to 89 minutes: 3,815
90 or more minutes: 1,177
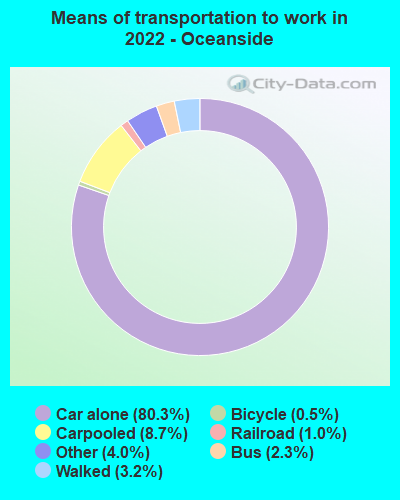
Means of transportation to work:
Drove a car alone: 39,185 (61.0%)
Carpooled: 4,240 (6.6%)
Bus: 1,117 (1.7%)
Light rail, streetcar or trolley: 469 (0.7%)
Taxi: 1,958 (3.0%)
Bicycle: 253 (0.4%)
Walked: 1,568 (2.4%)
Worked at home: 15,470 (24.1%)
Unemployment by race in 2022
Unemployment rate for White non-Hispanic residents
3.1%Males
2.8%Females
Unemployment rate for Black residents
2.8%Males
7.7%Females
Unemployment rate for American Indian and Alaska Native residents
1.1%Males
10.3%Females
Unemployment rate for Asian residents
3.9%Females
Unemployment rate for other race residents
3.5%Males
4.1%Females
Unemployment rate for two or more race residents
3.4%Males
4.7%Females
Unemployment rate for Hispanic or Latino residents
2.7%Males
3.7%Females
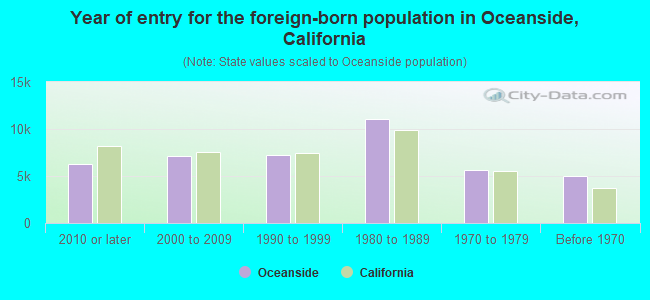
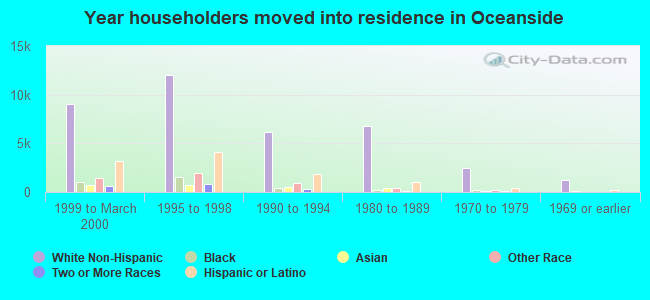
Year of entry for the foreign-born population in Oceanside, California
6,2762010 or later
7,1582000 to 2009
7,2601990 to 1999
11,0331980 to 1989
5,6581970 to 1979
5,014Before 1970
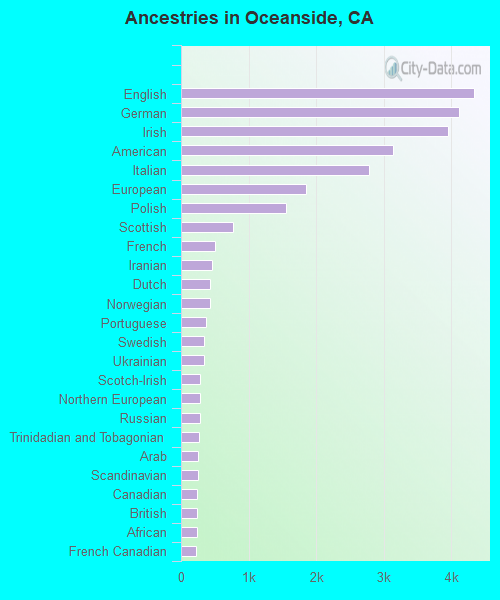
First ancestries reported:
English: 4,343 (4.8%)
German: 4,116 (4.5%)
Irish: 3,948 (4.3%)
American: 3,145 (3.5%)
Italian: 2,777 (3.1%)
European: 1,854 (2.0%)
Polish: 1,549 (1.7%)
Scottish: 770 (0.8%)
French: 499 (0.5%)
Iranian: 453 (0.5%)
Dutch: 428 (0.5%)
Norwegian: 426 (0.5%)
Portuguese: 374 (0.4%)
Swedish: 346 (0.4%)
Ukrainian: 336 (0.4%)
Scotch-Irish: 287 (0.3%)
Northern European: 283 (0.3%)
Russian: 280 (0.3%)
Trinidadian and Tobagonian: 260 (0.3%)
Arab: 255 (0.3%)
Scandinavian: 245 (0.3%)
Canadian: 242 (0.3%)
British: 233 (0.3%)
African: 230 (0.3%)
French Canadian: 216 (0.2%)
Brazilian: 216 (0.2%)
Swiss: 175 (0.2%)
Hungarian: 166 (0.2%)
Danish: 165 (0.2%)
Lebanese: 149 (0.2%)
Turkish: 144 (0.2%)
Kenyan: 144 (0.2%)
Serbian: 141 (0.2%)
Jamaican: 138 (0.2%)
Belgian: 137 (0.2%)
Afghan: 134 (0.1%)
Eastern European: 129 (0.1%)
Croatian: 122 (0.1%)
Welsh: 121 (0.1%)
Basque: 101 (0.1%)
Finnish: 100 (0.1%)
Lithuanian: 92 (0.1%)
Austrian: 87 (0.10%)
Greek: 83 (0.09%)
Haitian: 71 (0.08%)
Slavic: 55 (0.06%)
Egyptian: 52 (0.06%)
Israeli: 47 (0.05%)
Armenian: 46 (0.05%)
Romanian: 43 (0.05%)
Assyrian: 37 (0.04%)
Czech: 37 (0.04%)
Slovak: 33 (0.04%)
Macedonian: 32 (0.04%)
Jordanian: 31 (0.03%)
Ethiopian: 31 (0.03%)
Yugoslavian: 29 (0.03%)
Icelander: 20 (0.02%)
Dutch West Indian: 18 (0.02%)
Moroccan: 14 (0.02%)
Syrian: 13 (0.01%)
South African: 11 (0.01%)
Guyanese: 11 (0.01%)
Latvian: 11 (0.01%)
Bulgarian: 7 (0.01%)
Barbadian: 7 (0.01%)
Pennsylvania German: 6 (0.01%)
New Zealander: 5 (0.01%)
Most common places of birth for foreign-born residents (%):
Mexico
Oceanside:
48.2% (16,850)
California:
37.2% (3,881,193)
Philippines
Oceanside:
10.0% (3,510)
California:
7.8% (818,297)
Canada
Oceanside:
3.9% (1,349)
California:
1.2% (127,477)
Vietnam
Oceanside:
3.5% (1,210)
California:
4.9% (512,335)
China, excluding Hong Kong and Taiwan
Oceanside:
2.3% (808)
California:
6.6% (684,672)
Korea
Oceanside:
1.8% (615)
California:
3.0% (315,248)
Japan
Oceanside:
1.5% (526)
California:
1.0% (103,575)
Place of birth for U.S.-born residents:
This state: 85,623
Other state: 46,431
Northeast: 12,054
Midwest: 14,059
South: 12,723
West: 7,595
86.5% of Oceanside residents lived in the same house 1 years ago. Out of people who lived in different houses, 38.2% lived in this county. Out of people who lived in different counties, 45.1% lived in California.
Oceanside:
86.5%
State average:
88.9%
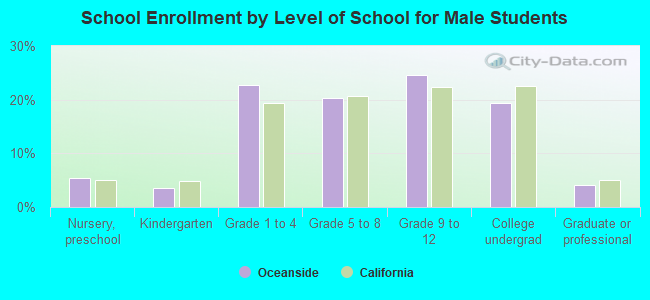
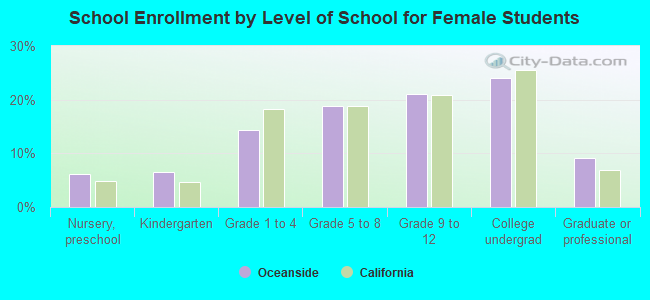
Education attainment for males 25 years and older:
No schooling: 707
Nursery to 4th grade: 429
5th and 6th grade: 1,851
7th and 8th grade: 368
9th grade: 747
10th grade: 90
11th grade: 568
12th grade, no diploma: 1,961
High school graduate (or equivalency): 13,169
Less than 1 year of college: 5,212
Some college more than 1 year, no degree: 9,283
Associate degree: 4,197
Bachelor's degree: 16,441
Master's degree: 4,928
Professional school degree: 477
Doctorate degree: 1,036
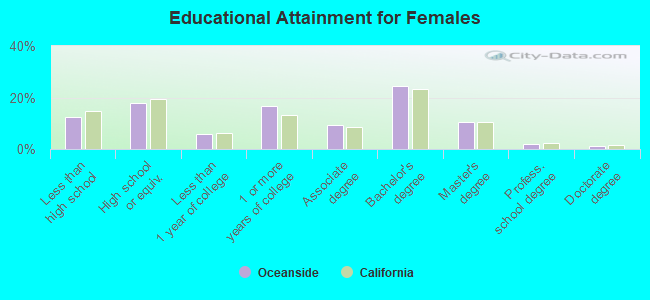
Education attainment for females 25 years and older:
No schooling: 1,624
Nursery to 4th grade: 555
5th and 6th grade: 2,242
7th and 8th grade: 596
9th grade: 665
10th grade: 168
11th grade: 853
12th grade, no diploma: 958
High school graduate (or equivalency): 10,946
Less than 1 year of college: 3,502
Some college more than 1 year, no degree: 10,366
Associate degree: 5,814
Bachelor's degree: 15,031
Master's degree: 6,378
Professional school degree: 1,184
Doctorate degree: 712
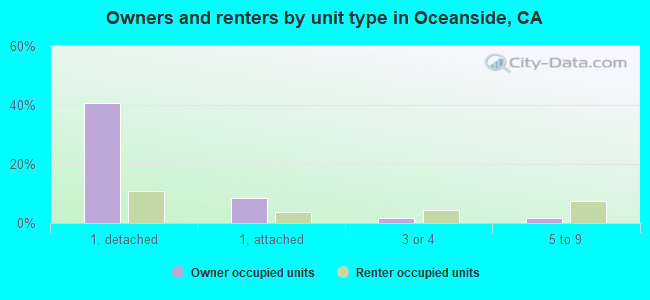
Housing units in structures:
One, detached: 35,759
One, attached: 8,344
Two: 1,774
3 or 4: 4,088
5 to 9: 6,472
10 to 19: 4,497
20 to 49: 2,592
50 or more: 3,341
Mobile homes: 3,107
Median worth of mobile homes: $195,600
Housing units lacking complete plumbing facilities in 2022: 0.4%
Housing units lacking complete kitchen facilities in 2022: 0.3%
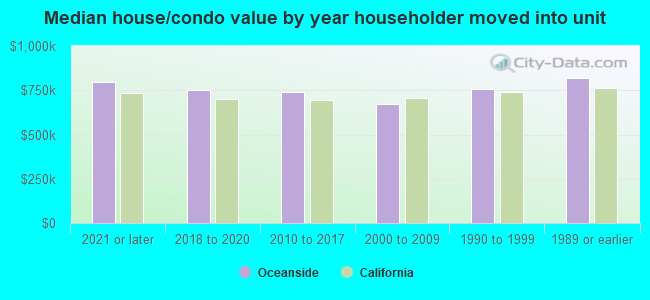
House/condo owner moved in on average 11 years ago