Ocean City, NJ (New Jersey) Houses and Residents
Estimated median house or condo value in 2022: $800,916 (it was $215,200 in 2000 )
Ocean City:
$800,916New Jersey:
$428,900
Lower value quartile - upper value quartile: $575,017 - $1,165,286Mean price in 2022: Detached houses: $1,018,571 Here:
$1,018,571State:
$537,591
Townhouses or other attached units: $711,246 Here:
$711,246State:
$381,113
In 2-unit structures: $821,878 Here:
$821,878State:
$444,476
In 3-to-4-unit structures: $555,569 Here:
$555,569State:
$457,463
In 5-or-more-unit structures: $438,474 Here:
$438,474State:
$368,745
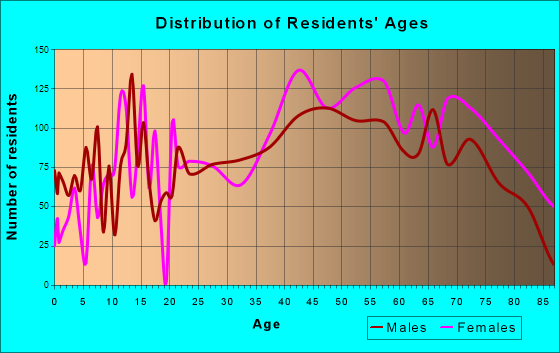
Total population: 11,374 (All urban)
Houses: 20,806 (5,514 occupied: 4,466 owner occupied, 1,729 renter occupied )
% of renters here:
28%State:
35%
Housing density: 3,007 houses/condos per square mile
Median price asked for vacant for-sale houses and condos in 2022: $572,559.
Median contract rent in 2022: $1,377 (lower quartile is $930, upper quartile is $1,807)
Median rent asked for vacant for-rent units in 2022: $3,168
Median gross rent in Ocean City, NJ in 2022: $1,459
Housing units in Ocean City with a mortgage: 2,024 (199 second mortgage, 0 home equity loan, 184 both second mortgage and home equity loan )Houses without a mortgage: 117
Median household income for houses/condos with a mortgage: $157,906
Median household income for apartments without a mortgage: $102,020
Median monthly housing costs: $1,483
Data:
Median house or condo value ($)
Median house or condo value ($ change since 2000)
Median house or condo value ($) - White
Median house or condo value ($) - Black or African American
Median house or condo value ($) - Asian
Median house or condo value ($) - Hispanic or Latino
Median house or condo value ($) - American Indian and Alaska Native
Median house or condo value ($) - Multirace
Median house or condo value ($) - Other Race
Median price asked for mobile homes ($)
Household density (households per square mile)
Mean house or condo value by units in structure - 1, detached ($)
Mean house or condo value by units in structure - 1, attached ($)
Mean house or condo value by units in structure - 2 ($)
Mean house or condo value by units in structure by units in structure - 3 or 4 ($)
Mean house or condo value by units in structure - 5 or more ($)
Mean house or condo value by units in structure - Boat, RV, van, etc. ($)
Mean house or condo value by units in structure - Mobile home ($)
Median contract rent ($)
Median contract rent - Lower quartile ($)
Median contract rent - Upper quartile ($)
Median gross rent ($)
Urban houses (%)
Rural houses (%)
Houses occupied (%)
Houses occupied (% change since 2000)
Houses owner occupied (%)
Houses owner occupied (% change since 2000)
Houses renter occupied (%)
Houses renter occupied (% change since 2000)
Vacant housing units - For rent (%)
Vacant housing units - For rent (% change since 2000)
Vacant housing units - For sale only (%)
Vacant housing units - For sale only (% change since 2000)
Vacant housing units - Rented or sold, not occupied (%)
Vacant housing units - Rented or sold, not occupied (% change since 2000)
Vacant housing units - For seasonal, recreational, or occasional use (%)
Vacant housing units - For seasonal, recreational, or occasional use (% change since 2000)
Vacant housing units - For migrant workers (%)
Vacant housing units - For migrant workers (% change since 2000)
Vacant housing units - Other vacant (%)
Vacant housing units - Other vacant (% change since 2000)
Median monthly housing costs ($)
Median household income for houses/condos with a mortgage ($)
Median household income for houses/condos without a mortgage ($)
Median household income ($)
Median household income ($) - White
Median household income ($) - Black or African American
Median household income ($) - Asian
Median household income ($) - Hispanic or Latino
Median household income ($) - American Indian and Alaska Native
Median household income ($) - Multirace
Median household income ($) - Other Race
Mortgage status - with mortgage (%)
Mortgage status - with second mortgage (%)
Mortgage status - with home equity loan (%)
Mortgage status - with both second mortgage and home equity loan (%)
Mortgage status - without a mortgage (%)
Median year house/condo built
Median year apartment built
Household type by relationship - Male householder living alone (%)
Household type by relationship - Male householder not living alone (%)
Household type by relationship - Female householder living alone (%)
Household type by relationship - Female householder not living alone (%)
Household type by relationship - Opposite-Sex spouse (%)
Household type by relationship - Same-Sex spouse (%)
Household type by relationship - Opposite-Sex unmarried partner (%)
Household type by relationship - Same-Sex unmarried partner (%)
Household type by relationship - In group quarters (%)
Size of family households - 2-person household (%)
Size of family households - 3-person household (%)
Size of family households - 4-person household (%)
Size of family households - 5-person household (%)
Size of family households - 6-person household (%)
Size of family households - 7-or-more-person household (%)
Size of nonfamily households - 1-person household (%)
Size of nonfamily households - 2-person household (%)
Size of nonfamily households - 3-person household (%)
Size of nonfamily households - 4-person household (%)
Size of nonfamily households - 5-person household (%)
Size of nonfamily households - 6-person household (%)
Size of nonfamily households - 7-or-moreperson household (%)
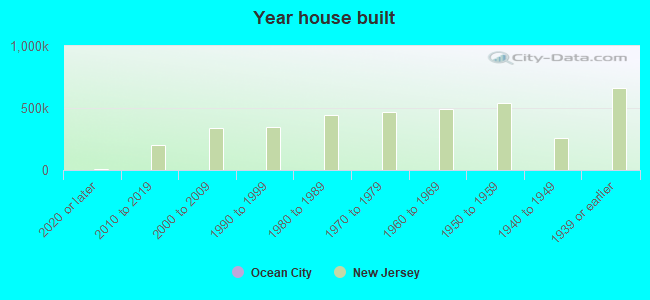
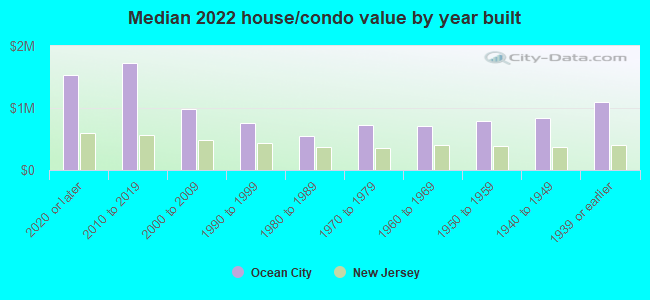
Year house built - Built 2010 or later (%)
Year house built - Built 2000 to 2009 (%)
Year house built - Built 1990 to 1999 (%)
Year house built - Built 1980 to 1989 (%)
Year house built - Built 1970 to 1979 (%)
Year house built - Built 1960 to 1969 (%)
Year house built - Built 1950 to 1959 (%)
Year house built - Built 1940 to 1949 (%)
Year house built - Built 1939 or earlier (%)
Median number of rooms in houses and condos
Median number of rooms in apartments
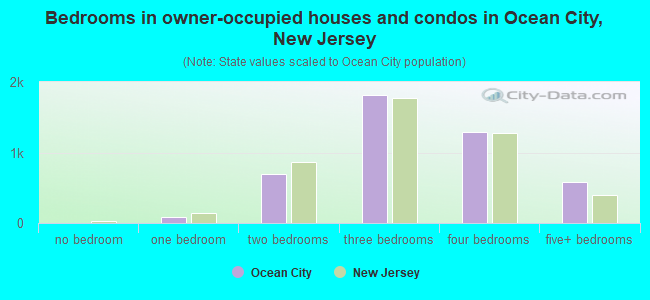
Median number of bedrooms in owner occupied houses
Mean number of bedrooms in owner occupied houses
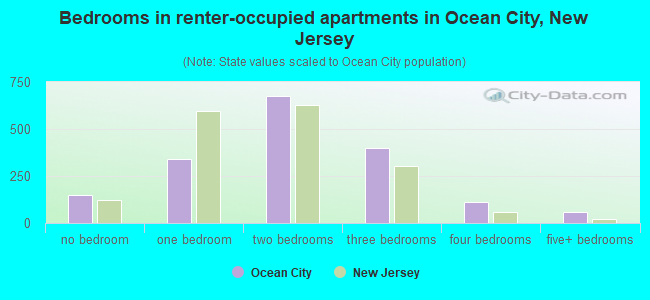
Median number of bedrooms in renter occupied houses
Mean number of bedrooms in renter occupied houses
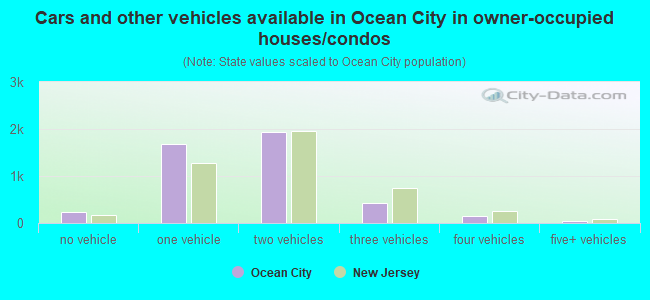
Median number of vehichles in owner occupied houses
Mean number of vehichles in owner occupied houses
Median number of vehichles in renter occupied houses
Mean number of vehichles in renter occupied houses
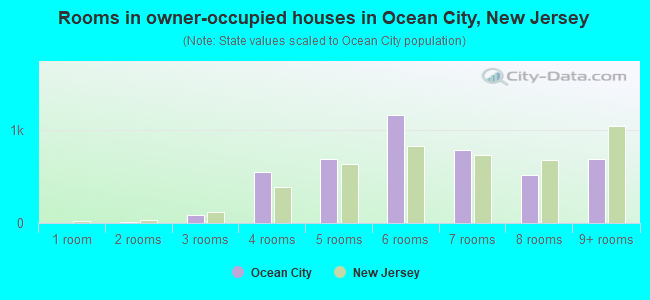
Rooms in owner-occupied houses - 1 room (%)
Rooms in owner-occupied houses - 2 rooms (%)
Rooms in owner-occupied houses - 3 rooms (%)
Rooms in owner-occupied houses - 4 rooms (%)
Rooms in owner-occupied houses - 5 rooms (%)
Rooms in owner-occupied houses - 6 rooms (%)
Rooms in owner-occupied houses - 7 rooms (%)
Rooms in owner-occupied houses - 8 rooms (%)
Rooms in owner-occupied houses - 9+ rooms (%)
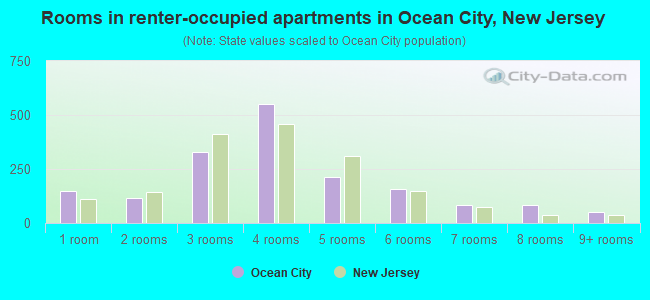
Rooms in renter-occupied houses - 1 room (%)
Rooms in renter-occupied houses - 2 rooms (%)
Rooms in renter-occupied houses - 3 rooms (%)
Rooms in renter-occupied houses - 4 rooms (%)
Rooms in renter-occupied houses - 5 rooms (%)
Rooms in renter-occupied houses - 6 rooms (%)
Rooms in renter-occupied houses - 7 rooms (%)
Rooms in renter-occupied houses - 8 rooms (%)
Rooms in renter-occupied houses - 9+ rooms (%)
Bedrooms in owner-occupied houses - no bedrooms (%)
Bedrooms in owner-occupied houses - 1 bedroom (%)
Bedrooms in owner-occupied houses - 2 bedrooms (%)
Bedrooms in owner-occupied houses - 3 bedrooms (%)
Bedrooms in owner-occupied houses - 4 bedrooms (%)
Bedrooms in owner-occupied houses - 5+ bedrooms (%)
Bedrooms in renter-occupied houses - no bedrooms (%)
Bedrooms in renter-occupied houses - 1 bedroom (%)
Bedrooms in renter-occupied houses - 2 bedrooms (%)
Bedrooms in renter-occupied houses - 3 bedrooms (%)
Bedrooms in renter-occupied houses - 4 bedrooms (%)
Bedrooms in renter-occupied houses - 5+ bedrooms (%)
Vehicles available in owner-occupied houses - no vehicle available (%)
Vehicles available in owner-occupied houses - 1 vehicle available(%)
Vehicles available in owner-occupied houses - 2 Vehicles available (%)
Vehicles available in owner-occupied houses - 3 Vehicles available (%)
Vehicles available in owner-occupied houses - 4 Vehicles available (%)
Vehicles available in owner-occupied houses - 5+ Vehicles available (%)
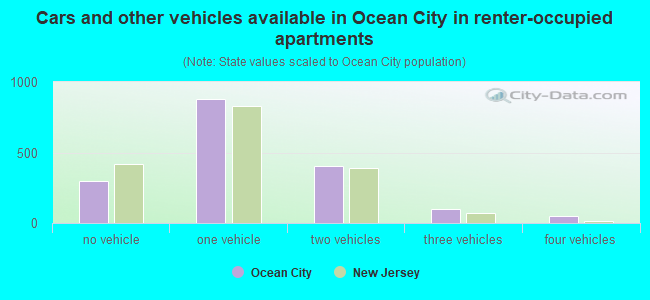
Vehicles available in renter-occupied houses - no vehicle available (%)
Vehicles available in renter-occupied houses - 1 vehicle available (%)
Vehicles available in renter-occupied houses - 2 Vehicles available (%)
Vehicles available in renter-occupied houses - 3 Vehicles available (%)
Vehicles available in renter-occupied houses - 4 Vehicles available (%)
Vehicles available in renter-occupied houses - 5+ Vehicles available (%)
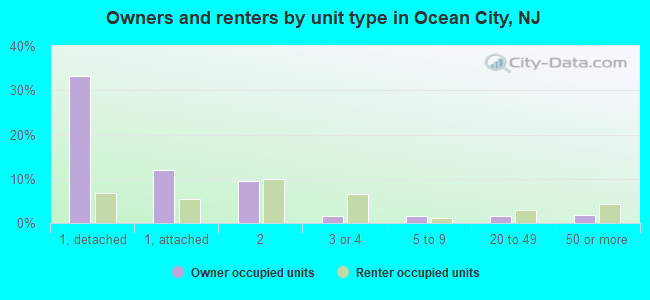
Housing units in structures - 1, detached (%)
Housing units in structures - 1, attached (%)
Housing units in structures - 2 (%)
Housing units in structures - 3 or 4 (%)
Housing units in structures - 5 to 9 (%)
Housing units in structures - 10 to 19 (%)
Housing units in structures - 20 to 49 (%)
Housing units in structures - 50 or more (%)
Housing units in structures - Mobile home (%)
Housing units in structures - Boat, RV, van, etc. (%)
Housing units in structures - Owners - 1, detached (%)
Housing units in structures - Owners - 1, attached (%)
Housing units in structures - Owners - 2 (%)
Housing units in structures - Owners - 3 or 4 (%)
Housing units in structures - Owners - 5 to 9 (%)
Housing units in structures - Owners - 10 to 19 (%)
Housing units in structures - Owners - 20 to 49 (%)
Housing units in structures - Owners - 50 or more (%)
Housing units in structures - Owners - Mobile home (%)
Housing units in structures - Owners - Boat, RV, van, etc. (%)
Housing units in structures - Renters - 1, detached (%)
Housing units in structures - Renters - 1, attached (%)
Housing units in structures - Renters - 2 (%)
Housing units in structures - Renters - 3 or 4 (%)
Housing units in structures - Renters - 5 to 9 (%)
Housing units in structures - Renters - 10 to 19 (%)
Housing units in structures - Renters - 20 to 49 (%)
Housing units in structures - Renters - 50 or more (%)
Housing units in structures - Renters - Mobile home (%)
Housing units in structures - Renters - Boat, RV, van, etc. (%)
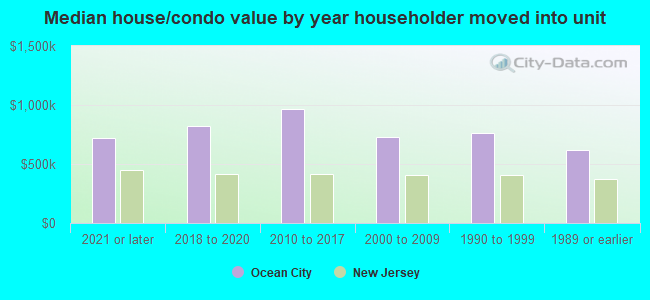
House/condo owner moved in on average (years ago)
Renter moved in on average (years ago)
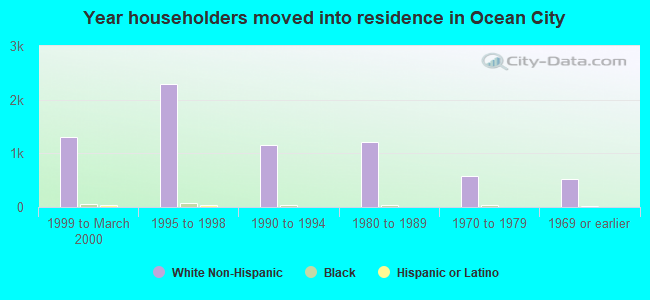
Year householder moved into unit - Moved in 1999 to March 2000 (%)
Year householder moved into unit - Moved in 1999 to March 2000 (%) - White
Year householder moved into unit - Moved in 1999 to March 2000 (%) - Black or African American
Year householder moved into unit - Moved in 1999 to March 2000 (%) - Asian
Year householder moved into unit - Moved in 1999 to March 2000 (%) - Hispanic or Latino
Year householder moved into unit - Moved in 1999 to March 2000 (%) - American Indian and Alaska Native
Year householder moved into unit - Moved in 1999 to March 2000 (%) - Multirace
Year householder moved into unit - Moved in 1999 to March 2000 (%) - Other Race
Year householder moved into unit - Moved in 1995 to 1998 (%)
Year householder moved into unit - Moved in 1995 to 1998 (%) - White
Year householder moved into unit - Moved in 1995 to 1998 (%) - Black or African American
Year householder moved into unit - Moved in 1995 to 1998 (%) - Asian
Year householder moved into unit - Moved in 1995 to 1998 (%) - Hispanic or Latino
Year householder moved into unit - Moved in 1995 to 1998 (%) - American Indian and Alaska Native
Year householder moved into unit - Moved in 1995 to 1998 (%) - Multirace
Year householder moved into unit - Moved in 1995 to 1998 (%) - Other Race
Year householder moved into unit - Moved in 1990 to 1994 (%)
Year householder moved into unit - Moved in 1990 to 1994 (%) - White
Year householder moved into unit - Moved in 1990 to 1994 (%) - Black or African American
Year householder moved into unit - Moved in 1990 to 1994 (%) - Asian
Year householder moved into unit - Moved in 1990 to 1994 (%) - Hispanic or Latino
Year householder moved into unit - Moved in 1990 to 1994 (%) - American Indian and Alaska Native
Year householder moved into unit - Moved in 1990 to 1994 (%) - Multirace
Year householder moved into unit - Moved in 1990 to 1994 (%) - Other Race
Year householder moved into unit - Moved in 1980 to 1989 (%)
Year householder moved into unit - Moved in 1980 to 1989 (%) - White
Year householder moved into unit - Moved in 1980 to 1989 (%) - Black or African American
Year householder moved into unit - Moved in 1980 to 1989 (%) - Asian
Year householder moved into unit - Moved in 1980 to 1989 (%) - Hispanic or Latino
Year householder moved into unit - Moved in 1980 to 1989 (%) - American Indian and Alaska Native
Year householder moved into unit - Moved in 1980 to 1989 (%) - Multirace
Year householder moved into unit - Moved in 1980 to 1989 (%) - Other Race
Year householder moved into unit - Moved in 1970 to 1979 (%)
Year householder moved into unit - Moved in 1970 to 1979 (%) - White
Year householder moved into unit - Moved in 1970 to 1979 (%) - Black or African American
Year householder moved into unit - Moved in 1970 to 1979 (%) - Asian
Year householder moved into unit - Moved in 1970 to 1979 (%) - Hispanic or Latino
Year householder moved into unit - Moved in 1970 to 1979 (%) - American Indian and Alaska Native
Year householder moved into unit - Moved in 1970 to 1979 (%) - Multirace
Year householder moved into unit - Moved in 1970 to 1979 (%) - Other Race
Year householder moved into unit - Moved in 1969 or earlier (%)
Year householder moved into unit - Moved in 1969 or earlier (%) - White
Year householder moved into unit - Moved in 1969 or earlier (%) - Black or African American
Year householder moved into unit - Moved in 1969 or earlier (%) - Asian
Year householder moved into unit - Moved in 1969 or earlier (%) - Hispanic or Latino
Year householder moved into unit - Moved in 1969 or earlier (%) - American Indian and Alaska Native
Year householder moved into unit - Moved in 1969 or earlier (%) - Multirace
Year householder moved into unit - Moved in 1969 or earlier (%) - Other Race
Housing units lacking complete plumbing facilities (%)
Housing units lacking complete kitchen facilities (%)
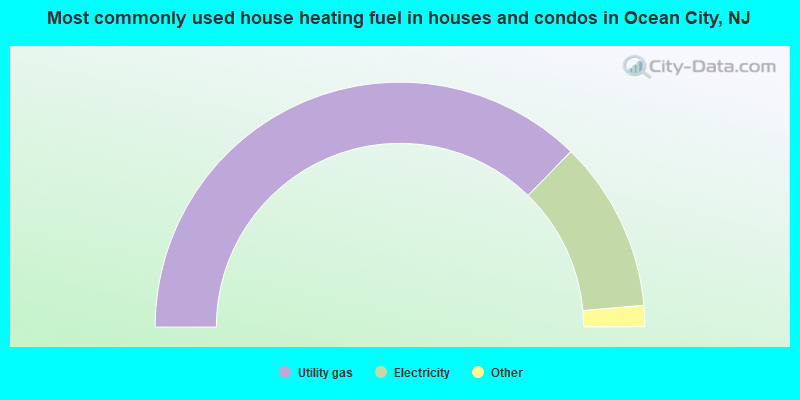
House heating fuel used in houses and condos - Utility gas (%)
House heating fuel used in houses and condos - Bottled, tank, or LP gas (%)
House heating fuel used in houses and condos - Electricity (%)
House heating fuel used in houses and condos - Fuel oil, kerosene, etc. (%)
House heating fuel used in houses and condos - Coal or coke (%)
House heating fuel used in houses and condos - Wood (%)
House heating fuel used in houses and condos - Solar energy (%)
House heating fuel used in houses and condos - Other fuel (%)
House heating fuel used in houses and condos - No fuel used (%)
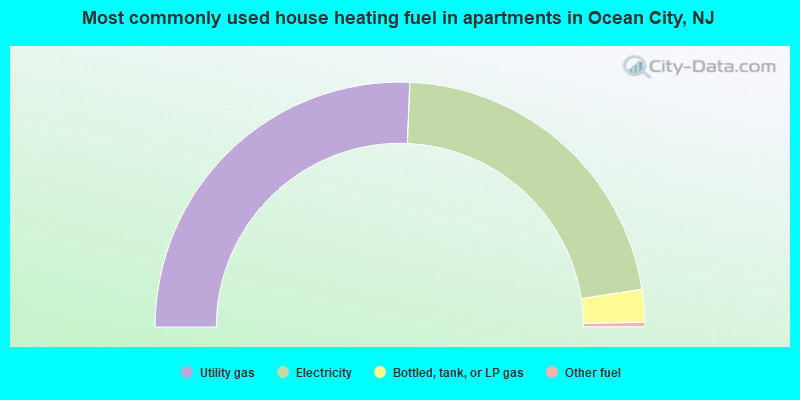
House heating fuel used in apartments - Utility gas (%)
House heating fuel used in apartments - Bottled, tank, or LP gas (%)
House heating fuel used in apartments - Electricity (%)
House heating fuel used in apartments - Fuel oil, kerosene, etc. (%)
House heating fuel used in apartments - Coal or coke (%)
House heating fuel used in apartments - Wood (%)
House heating fuel used in apartments - Solar energy (%)
House heating fuel used in apartments - Other fuel (%)
House heating fuel used in apartments - No fuel used (%)
Median year house/condo built: 1978Median year apartment built: 1981Household type by relationship:
Households: 11,275
Male householders: 2,710 (881 living alone ), Female householders: 2,817 (1,228 living alone )2,847 spouses (2,836 opposite-sex spouses ), 152 unmarried partners , (152 opposite-sex unmarried partners ), 2,274 children (2,203 natural , 42 adopted , 29 stepchildren ), 190 grandchildren , 17 brothers or sisters , 68 parents , 0 foster children , 23 other relatives , 35 non-relatives In group quarters: 139
Size of family households: 2,256 2-persons , 538 3-persons , 516 4-persons , 182 5-persons , 35 6-persons , 6 7-or-more-persons .
Size of nonfamily households: 2,519 1-person , 149 2-persons .
1,224 married couples with children. single-parent households (66 men , 359 women ).
90.9% of residents of Ocean City speak English at home. of residents speak Spanish at home (68% speak English very well , 22% speak English well , 6% speak English not well , 4% don't speak English at all ).of residents speak other Indo-European language at home (98% speak English very well , 2% speak English well ).of residents speak Asian or Pacific Island language at home (100% speak English very well ).of residents speak other language at home (100% speak English very well ).
Foreign born population: 561 (5.0%)of them are naturalized citizens )
Median number of rooms in houses and condos:
Median number of rooms in apartments
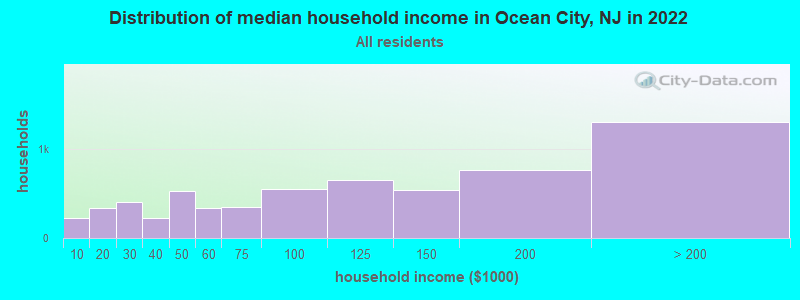
Ocean City, NJ household income distribution 228 Less than $10,000334 $10,000 to $19,999406 $20,000 to $29,999227 $30,000 to $39,999524 $40,000 to $49,999331 $50,000 to $59,999353 $60,000 to $74,999549 $75,000 to $99,999650 $100,000 to $124,999533 $125,000 to $149,999765 $150,000 to $199,9991,300 $200,000 or more
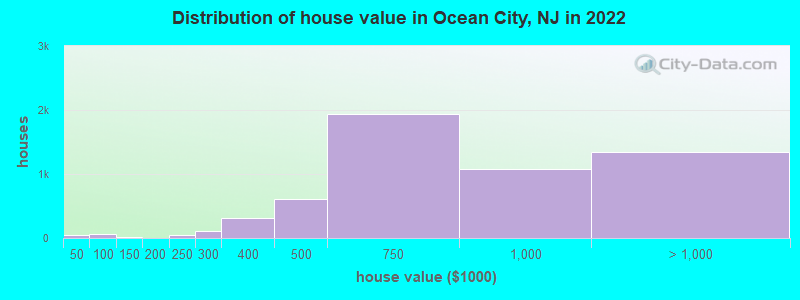
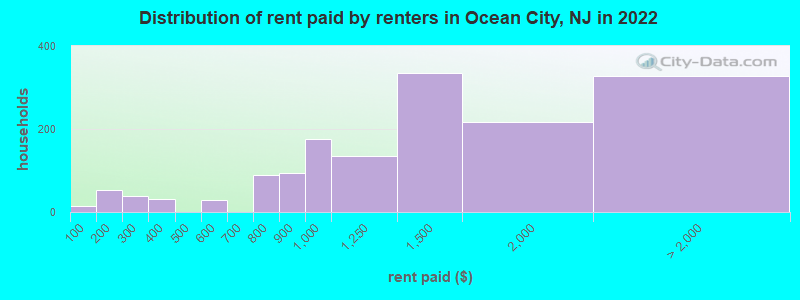
Home value of owner - occupied houses in 2022 in Ocean City, NJ 17 Less than $10,00018 $10,000 to $14,99912 $40,000 to $49,9995 $60,000 to $69,99927 $70,000 to $79,99911 $90,000 to $99,9997 $100,000 to $124,9994 $125,000 to $149,9995 $175,000 to $199,99944 $200,000 to $249,999116 $250,000 to $299,999313 $300,000 to $399,999609 $400,000 to $499,9991,935 $500,000 to $749,9991,082 $750,000 to $999,999564 $1,000,000 to $1,499,999316 $1,500,000 to $1,999,999465 $2,000,000 or moreRent paid by renters in 2022 in Ocean City, NJ 15 Less than $10012 $100 to $14941 $150 to $19912 $200 to $24925 $250 to $2999 $300 to $34921 $350 to $39919 $500 to $54910 $550 to $59940 $700 to $74950 $750 to $79994 $800 to $899174 $900 to $999135 $1,000 to $1,249336 $1,250 to $1,499217 $1,500 to $1,99948 $2,000 to $2,49945 $2,500 to $2,99954 $3,500 or more178 No cash rent
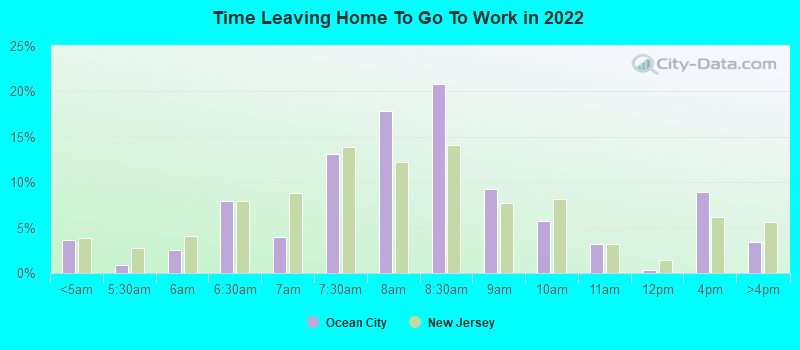
Percentage of workers working in this county: 55.9%Number of people working at home: 915 (17.5% of all workers )
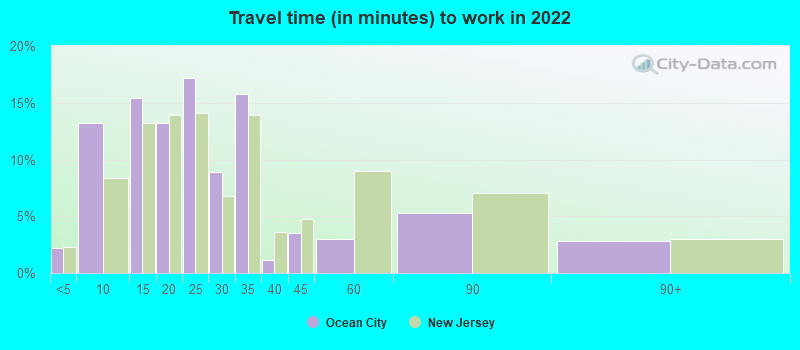
Travel time to work (commute)
Less than 5 minutes: 1195 to 9 minutes: 92510 to 14 minutes: 62915 to 19 minutes: 29020 to 24 minutes: 31125 to 29 minutes: 30130 to 34 minutes: 59735 to 39 minutes: 10640 to 44 minutes: 13645 to 59 minutes: 30660 to 89 minutes: 59390 or more minutes: 172
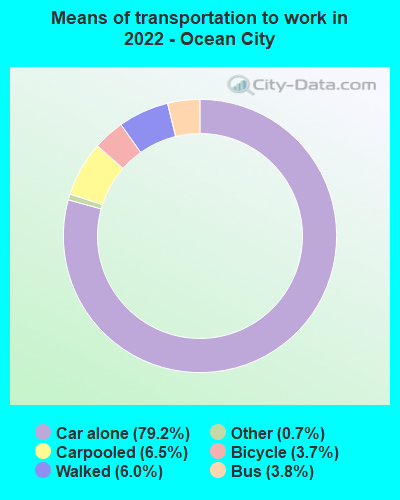
Means of transportation to work:
Drove a car alone: 4,772 (66.6%)Carpooled: 451 (6.3%)Bus : 218 (3.0%)Ferryboat: 4 (0.1%)Taxi: 49 (0.7%)Bicycle: 244 (3.4%)Walked: 435 (6.1%)Worked at home: 915 (12.8%)
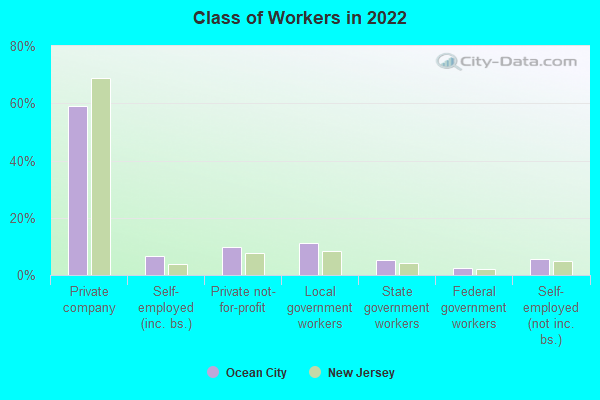
Unemployment by race in 2022
Unemployment rate for White non-Hispanic residents 2.7% Males1.0% FemalesUnemployment rate for two or more race residents 17.4% MalesUnemployment rate for Hispanic or Latino residents 5.0% Males
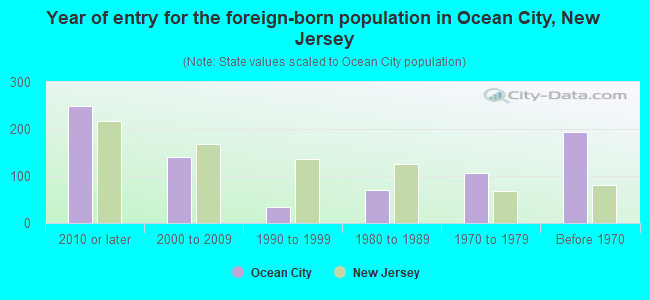
Year of entry for the foreign-born population in Ocean City, New Jersey
248 2010 or later 140 2000 to 2009 35 1990 to 1999 71 1980 to 1989 107 1970 to 1979 194 Before 1970
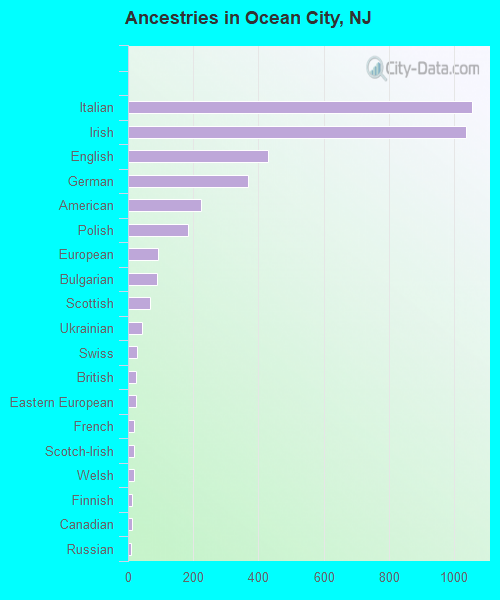
First ancestries reported:
Italian: 1,055 (21.2%)
Irish: 1,038 (20.9%)
English: 431 (8.7%)
German: 367 (7.4%)
American: 223 (4.5%)
Polish: 184 (3.7%)
European: 93 (1.9%)
Bulgarian: 88 (1.8%)
Scottish: 67 (1.3%)
Ukrainian: 43 (0.9%)
Swiss: 27 (0.5%)
British: 24 (0.5%)
Eastern European: 24 (0.5%)
French: 19 (0.4%)
Scotch-Irish: 17 (0.3%)
Welsh: 17 (0.3%)
Finnish: 12 (0.2%)
Canadian: 11 (0.2%)
Russian: 10 (0.2%)
Australian: 8 (0.2%)
Lithuanian: 8 (0.2%)
Maltese: 8 (0.2%)
Dutch: 7 (0.1%)
Scandinavian: 6 (0.1%)
Albanian: 6 (0.1%)
Luxembourger: 5 (0.1%)
Greek: 5 (0.1%)
Romanian: 5 (0.1%)
Hungarian: 5 (0.1%)
Norwegian: 4 (0.08%)
Slovak: 4 (0.08%)
Armenian: 3 (0.06%)
Northern European: 3 (0.06%)
Brazilian: 1 (0.02%)
Portuguese: 1 (0.02%) Most common places of birth for foreign-born residents (%): Mexico Ocean City:
51.0% (262)New Jersey:
4.8% (102,527)
Bulgaria Ocean City:
6.6% (34)New Jersey:
0.2% (3,249)
Germany Ocean City:
6.2% (32)New Jersey:
0.8% (17,217)
Guatemala Ocean City:
5.8% (30)New Jersey:
2.2% (46,813)
Italy Ocean City:
4.1% (21)New Jersey:
1.5% (33,198)
England Ocean City:
3.7% (19)New Jersey:
0.5% (10,886)
Ireland Ocean City:
2.7% (14)New Jersey:
0.4% (8,146)
Guyana Ocean City:
2.3% (12)New Jersey:
1.2% (26,173)
Greece Ocean City:
2.1% (11)New Jersey:
0.3% (7,501)
Portugal Ocean City:
2.1% (11)New Jersey:
1.3% (28,871)
Philippines Ocean City:
1.9% (10)New Jersey:
4.0% (85,934)
Canada Ocean City:
1.9% (10)New Jersey:
0.9% (18,317)
Other Eastern Europe Ocean City:
1.6% (8)New Jersey:
0.4% (7,791)
Place of birth for U.S.-born residents:
This state: 4,043Other state: 6,772Northeast: 5,453Midwest: 248South: 915West: 98 86.2% of Ocean City residents lived in the same house 1 years ago.
Out of people who lived in different houses, 19.2% lived in this county.
Out of people who lived in different counties, 54.4% lived in New Jersey.
Ocean City:
86.2%State average:
90.4%
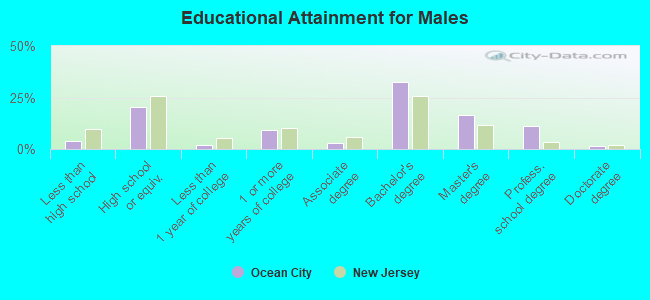
Education attainment for males 25 years and older:
No schooling: 43Nursery to 4th grade: 05th and 6th grade: 87th and 8th grade: 289th grade: 010th grade: 6011th grade: 2912th grade, no diploma: 7High school graduate (or equivalency): 901Less than 1 year of college: 76Some college more than 1 year, no degree: 406Associate degree: 130Bachelor's degree: 1,430Master's degree: 727Professional school degree: 494Doctorate degree: 62
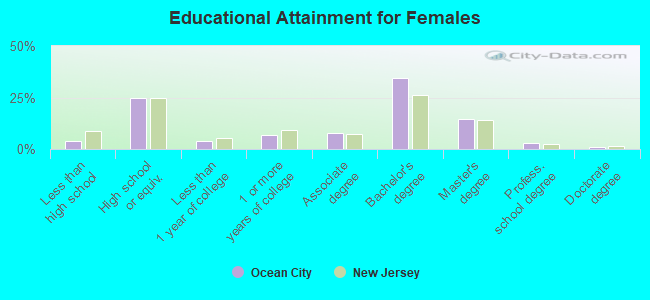
Education attainment for females 25 years and older:
No schooling: 43Nursery to 4th grade: 05th and 6th grade: 367th and 8th grade: 349th grade: 010th grade: 2611th grade: 2412th grade, no diploma: 27High school graduate (or equivalency): 1,225Less than 1 year of college: 196Some college more than 1 year, no degree: 344Associate degree: 394Bachelor's degree: 1,708Master's degree: 720Professional school degree: 152Doctorate degree: 46
Housing units in structures:
One, detached: 6,119One, attached: 9,014Two: 2,5923 or 4: 6995 to 9: 52010 to 19: 50720 to 49: 59150 or more: 746Mobile homes: 14Housing units lacking complete plumbing facilities in 2022: 0.2%Housing units lacking complete kitchen facilities in 2022: 1.3%House/condo owner moved in on average 10 years ago
Renter moved in on average 3 years ago
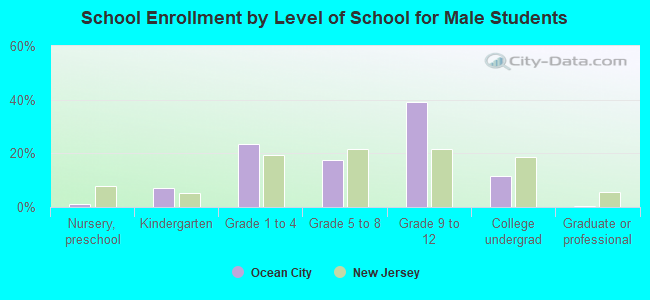
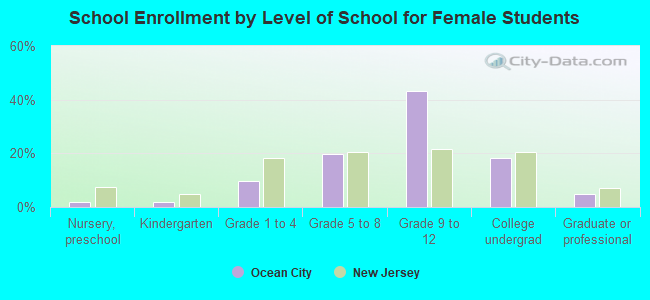
Private vs. public school enrollment:
Students in private schools in grades 1 to 8 (elementary and middle school): 127 Here:
17.2%New Jersey:
12.3%
Students in private schools in grades 9 to 12 (high school): 148 Here:
16.7%New Jersey:
13.1%
Students in private undergraduate colleges: 47 Here:
16.4%New Jersey:
33.2%