Housing density: 3,483 houses/condos per square mile
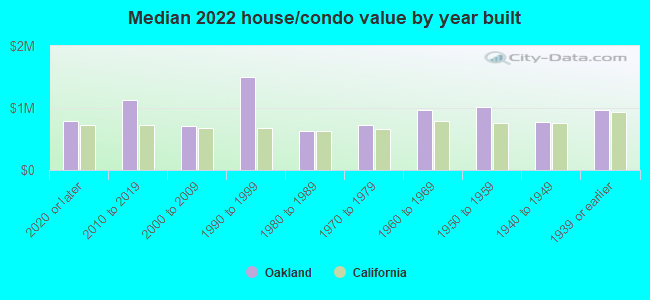
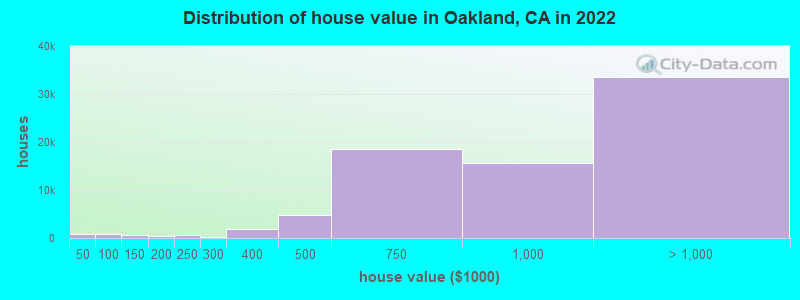
Median price asked for vacant for-sale houses and condos in 2022: $1,172,840.
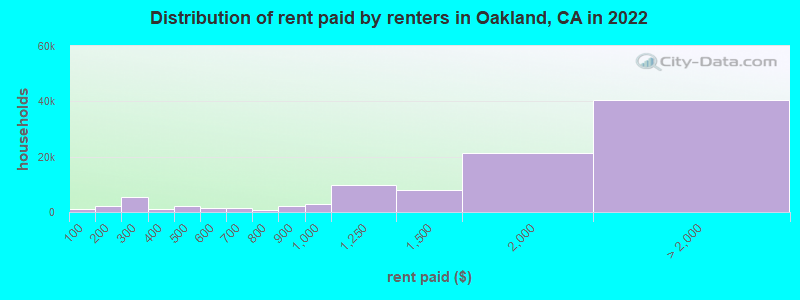
Median contract rent in 2022: $1,741 (lower quartile is $1,083, upper quartile is over $2,000)
Median rent asked for vacant for-rent units in 2022: $3,155
Median gross rent in Oakland, CA in 2022: $1,838
Housing units in Oakland with a mortgage: 55,564 (6,252 second mortgage, 315 home equity loan, 5,141 both second mortgage and home equity loan) Houses without a mortgage: 1,060
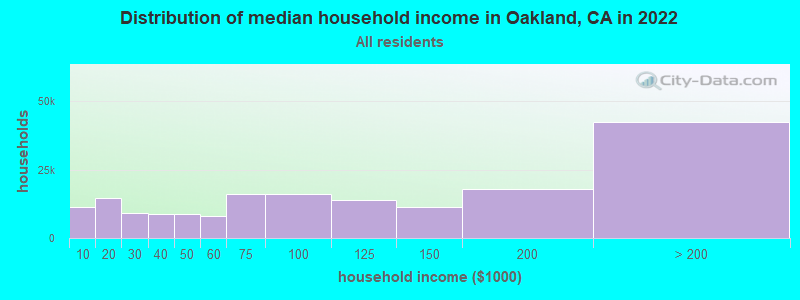
Median household income for houses/condos with a mortgage: $187,809
Median household income for apartments without a mortgage: $93,235
45,450 married couples with children.
21,253 single-parent households (5,361 men, 15,892 women).
62.7% of residents of Oakland speak English at home.
21.8% of residents speak Spanish at home (53% speak English very well, 21% speak English well, 16% speak English not well, 10% don't speak English at all).
3.3% of residents speak other Indo-European language at home (82% speak English very well, 14% speak English well, 3% speak English not well).
10.5% of residents speak Asian or Pacific Island language at home (40% speak English very well, 18% speak English well, 25% speak English not well, 16% don't speak English at all).
1.7% of residents speak other language at home (57% speak English very well, 21% speak English well, 12% speak English not well, 10% don't speak English at all).
Foreign born population: 112,691 (26.2%)
(50.1% of them are naturalized citizens)
Percentage of workers working in this county: 78.9% Number of people working at home: 70,598 (30.7% of all workers)
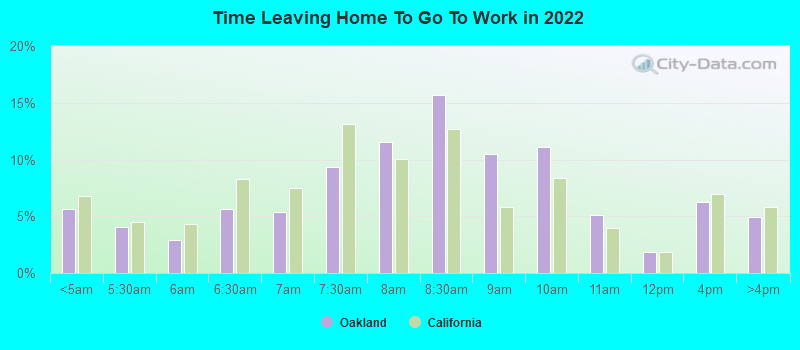
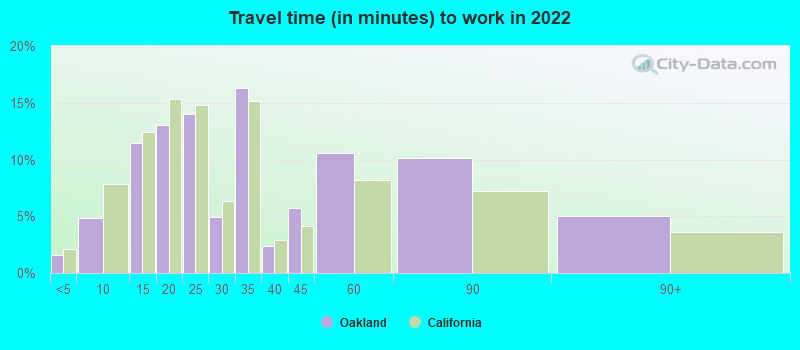
Travel time to work (commute)
Less than 5 minutes: 2,388
5 to 9 minutes: 7,107
10 to 14 minutes: 18,166
15 to 19 minutes: 22,600
20 to 24 minutes: 24,115
25 to 29 minutes: 9,017
30 to 34 minutes: 27,801
35 to 39 minutes: 4,378
40 to 44 minutes: 6,826
45 to 59 minutes: 18,409
60 to 89 minutes: 15,506
90 or more minutes: 2,906
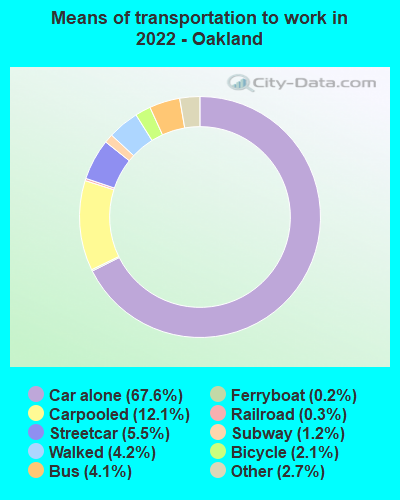
Means of transportation to work:
Drove a car alone: 99,300 (45.6%)
Carpooled: 17,821 (8.2%)
Bus: 6,076 (2.8%)
Subway or elevated rail: 8,022 (3.7%)
Long-distance train or commuter rail: 1,733 (0.8%)
Light rail, streetcar or trolley: 497 (0.2%)
Ferryboat: 248 (0.1%)
Taxi: 3,968 (1.8%)
Bicycle: 3,119 (1.4%)
Walked: 6,176 (2.8%)
Worked at home: 70,598 (32.5%)
Unemployment by race in 2022
Unemployment rate for White non-Hispanic residents
3.0%Males
2.2%Females
Unemployment rate for Black residents
6.5%Males
7.1%Females
Unemployment rate for American Indian and Alaska Native residents
2.3%Males
1.6%Females
Unemployment rate for Asian residents
7.2%Males
3.6%Females
Unemployment rate for other race residents
3.7%Males
3.3%Females
Unemployment rate for two or more race residents
6.2%Males
2.7%Females
Unemployment rate for Hispanic or Latino residents
4.1%Males
3.9%Females
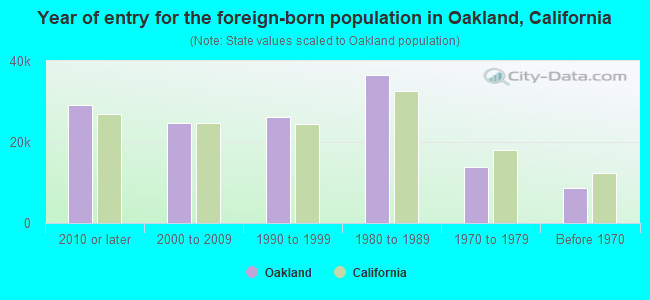
Year of entry for the foreign-born population in Oakland, California
29,1742010 or later
24,7482000 to 2009
26,0721990 to 1999
36,6301980 to 1989
13,9211970 to 1979
8,760Before 1970
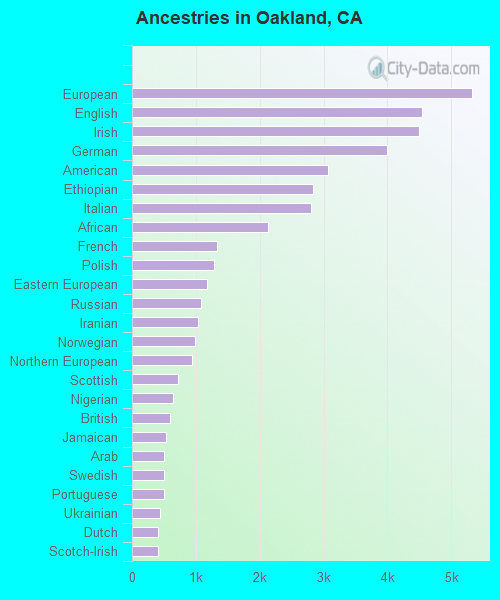
First ancestries reported:
European: 5,326 (2.2%)
English: 4,544 (1.9%)
Irish: 4,493 (1.9%)
German: 4,000 (1.7%)
American: 3,063 (1.3%)
Ethiopian: 2,838 (1.2%)
Italian: 2,808 (1.2%)
African: 2,134 (0.9%)
French: 1,327 (0.5%)
Polish: 1,283 (0.5%)
Eastern European: 1,173 (0.5%)
Russian: 1,082 (0.4%)
Iranian: 1,032 (0.4%)
Norwegian: 984 (0.4%)
Northern European: 945 (0.4%)
Scottish: 727 (0.3%)
Nigerian: 636 (0.3%)
British: 598 (0.2%)
Jamaican: 526 (0.2%)
Arab: 507 (0.2%)
Swedish: 503 (0.2%)
Portuguese: 496 (0.2%)
Ukrainian: 431 (0.2%)
Dutch: 406 (0.2%)
Scotch-Irish: 406 (0.2%)
Greek: 338 (0.1%)
Afghan: 335 (0.1%)
Scandinavian: 295 (0.1%)
Syrian: 291 (0.1%)
Belgian: 290 (0.1%)
Finnish: 223 (0.09%)
West Indian: 218 (0.09%)
Liberian: 214 (0.09%)
Danish: 205 (0.08%)
Swiss: 204 (0.08%)
Turkish: 200 (0.08%)
Armenian: 170 (0.07%)
Hungarian: 164 (0.07%)
Haitian: 158 (0.07%)
Sierra Leonean: 153 (0.06%)
South African: 151 (0.06%)
Welsh: 142 (0.06%)
Canadian: 142 (0.06%)
Jordanian: 136 (0.06%)
Egyptian: 131 (0.05%)
French Canadian: 126 (0.05%)
Ghanaian: 123 (0.05%)
Lithuanian: 120 (0.05%)
Brazilian: 118 (0.05%)
Czech: 114 (0.05%)
Kenyan: 105 (0.04%)
Romanian: 100 (0.04%)
Slovak: 89 (0.04%)
Austrian: 88 (0.04%)
Israeli: 78 (0.03%)
Sudanese: 77 (0.03%)
Barbadian: 69 (0.03%)
Lebanese: 68 (0.03%)
Latvian: 57 (0.02%)
British West Indian: 56 (0.02%)
Croatian: 54 (0.02%)
Australian: 50 (0.02%)
Moroccan: 46 (0.02%)
Bulgarian: 44 (0.02%)
Iraqi: 44 (0.02%)
Basque: 43 (0.02%)
Slavic: 40 (0.02%)
Cajun: 39 (0.02%)
Serbian: 37 (0.02%)
New Zealander: 36 (0.01%)
Senegalese: 34 (0.01%)
Bahamian: 28 (0.01%)
Yugoslavian: 28 (0.01%)
Macedonian: 26 (0.01%)
Zimbabwean: 22 (0.01%)
Estonian: 22 (0.01%)
Celtic: 21 (0.01%)
Cape Verdean: 20 (0.01%)
Pennsylvania German: 19 (0.01%)
Ugandan: 19 (0.01%)
Palestinian: 15 (0.01%)
Somali: 14 (0.01%)
Most common places of birth for foreign-born residents (%):
Mexico
Oakland:
25.4% (29,554)
California:
37.2% (3,881,193)
China, excluding Hong Kong and Taiwan
Oakland:
14.4% (16,811)
California:
6.6% (684,672)
Guatemala
Oakland:
10.1% (11,748)
California:
2.8% (290,436)
Vietnam
Oakland:
5.8% (6,698)
California:
4.9% (512,335)
El Salvador
Oakland:
3.7% (4,320)
California:
4.2% (440,287)
Philippines
Oakland:
3.5% (4,096)
California:
7.8% (818,297)
India
Oakland:
2.3% (2,669)
California:
5.2% (539,184)
Hong Kong
Oakland:
1.8% (2,059)
California:
1.0% (105,215)
Korea
Oakland:
1.6% (1,864)
California:
3.0% (315,248)
Cambodia
Oakland:
1.5% (1,771)
California:
0.5% (51,974)
Place of birth for U.S.-born residents:
This state: 214,733
Other state: 96,135
Northeast: 25,541
Midwest: 25,653
South: 29,312
West: 15,629
86.9% of Oakland residents lived in the same house 1 years ago. Out of people who lived in different houses, 37.9% lived in this county. Out of people who lived in different counties, 72.2% lived in California.
Oakland:
86.9%
State average:
88.9%
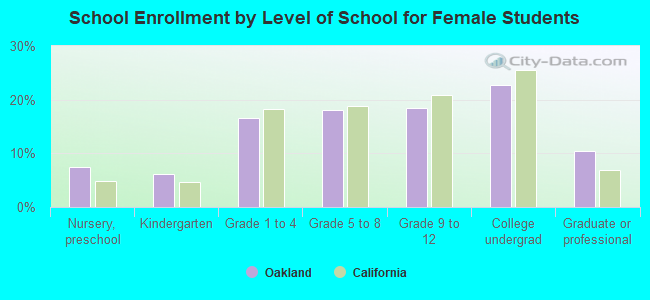
Education attainment for males 25 years and older:
No schooling: 6,542
Nursery to 4th grade: 1,869
5th and 6th grade: 4,099
7th and 8th grade: 1,193
9th grade: 3,281
10th grade: 1,501
11th grade: 1,382
12th grade, no diploma: 3,070
High school graduate (or equivalency): 30,173
Less than 1 year of college: 5,315
Some college more than 1 year, no degree: 17,407
Associate degree: 6,703
Bachelor's degree: 44,469
Master's degree: 23,126
Professional school degree: 6,448
Doctorate degree: 5,947
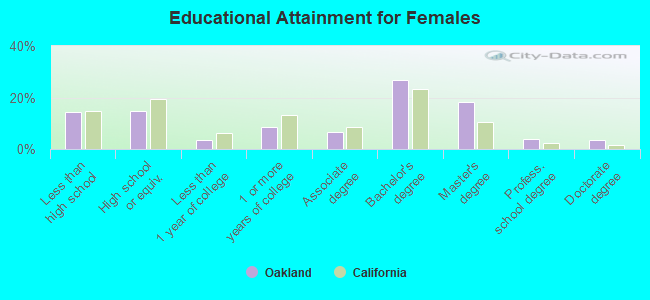
Education attainment for females 25 years and older:
No schooling: 7,184
Nursery to 4th grade: 2,277
5th and 6th grade: 3,882
7th and 8th grade: 985
9th grade: 2,593
10th grade: 648
11th grade: 1,885
12th grade, no diploma: 3,522
High school graduate (or equivalency): 23,481
Less than 1 year of college: 5,353
Some college more than 1 year, no degree: 13,893
Associate degree: 10,693
Bachelor's degree: 43,118
Master's degree: 29,157
Professional school degree: 5,996
Doctorate degree: 5,479
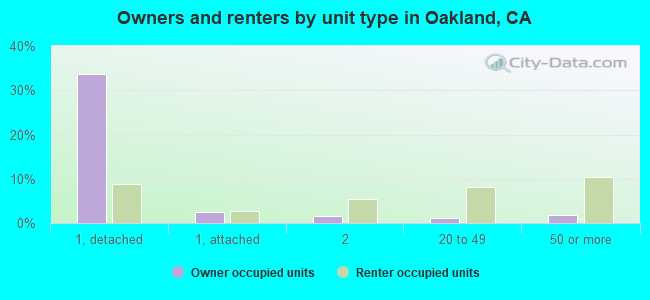
Housing units in structures:
One, detached: 81,039
One, attached: 9,828
Two: 13,436
3 or 4: 17,831
5 to 9: 13,327
10 to 19: 12,662
20 to 49: 17,748
50 or more: 28,099
Mobile homes: 1,014
Boats, RVs, vans, etc.: 272
Median worth of mobile homes: $230,500
Housing units lacking complete plumbing facilities in 2022: 1.0%
Housing units lacking complete kitchen facilities in 2022: 1.7%
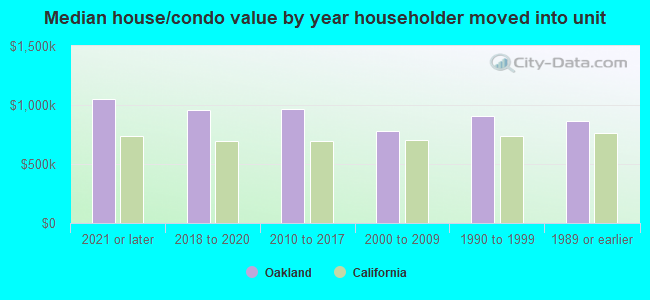
House/condo owner moved in on average 12 years ago