Housing density: 16,655 houses/condos per square mile
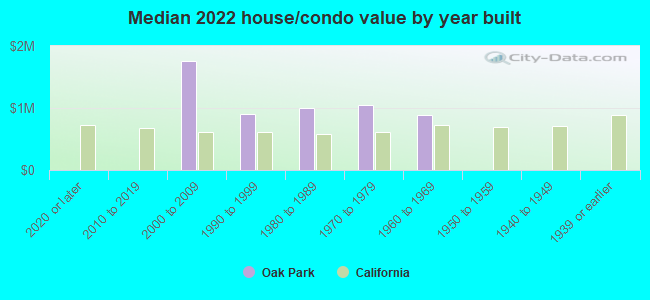
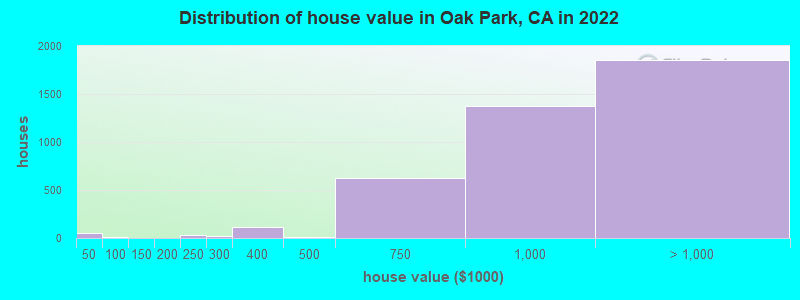
Median price asked for vacant for-sale houses and condos in 2022 in this county: $1,328,053.
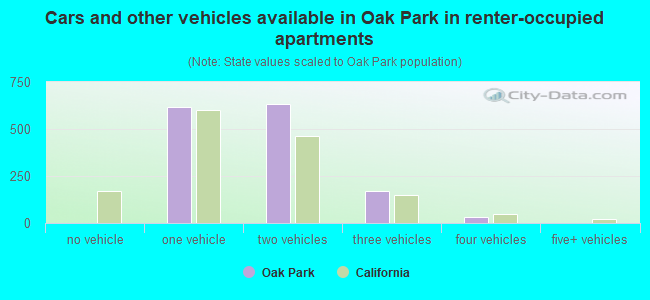
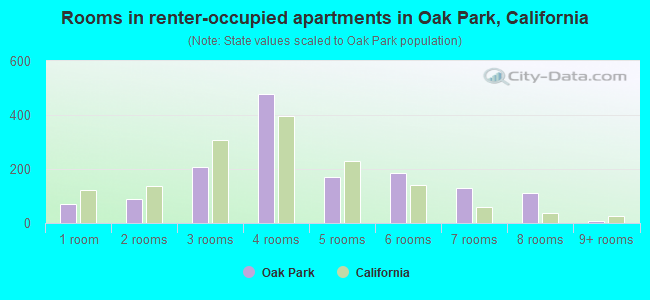
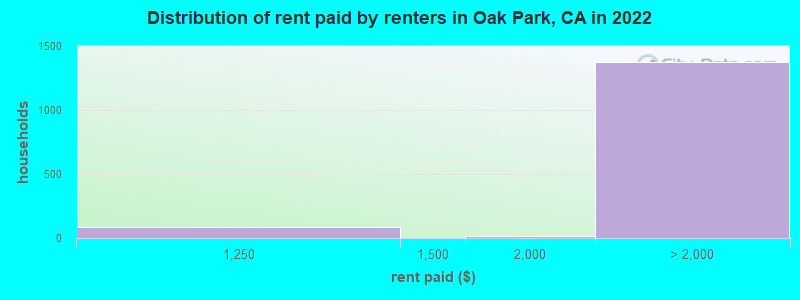
Median contract rent in 2022: over $2,000 (lower quartile is over $2,000, upper quartile is over $2,000)
Median rent asked for vacant for-rent units in 2022: $3,798
Median gross rent in Oak Park, CA in 2022: over $2,000
Housing units in Oak Park with a mortgage: 2,800 (328 second mortgage, 29 home equity loan, 297 both second mortgage and home equity loan) Houses without a mortgage: 7
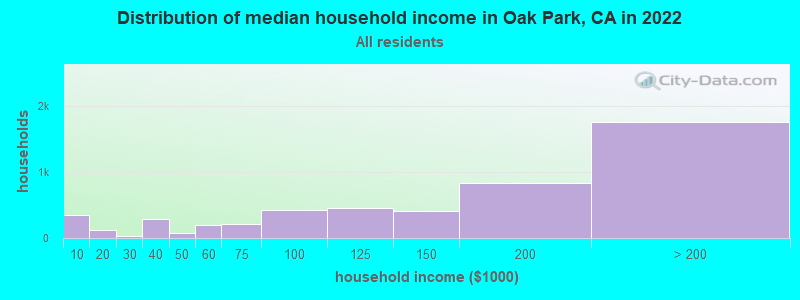
Median household income for houses/condos with a mortgage: $178,216
Median household income for apartments without a mortgage: $106,530
Size of family households: 1,394 2-persons, 944 3-persons, 1,026 4-persons, 263 5-persons, 74 6-persons.
Size of nonfamily households: 1,122 1-person, 165 2-persons, 33 3-persons.
2,884 married couples with children.
197 single-parent households (45 men, 152 women).
72.0% of residents of Oak Park speak English at home.
4.3% of residents speak Spanish at home (89% speak English very well, 5% speak English well, 5% speak English not well, 1% don't speak English at all).
12.2% of residents speak other Indo-European language at home (83% speak English very well, 15% speak English well, 2% speak English not well).
11.1% of residents speak Asian or Pacific Island language at home (74% speak English very well, 12% speak English well, 8% speak English not well, 6% don't speak English at all).
2.6% of residents speak other language at home (93% speak English very well, 7% speak English well).
Foreign born population: 3,346 (24.8%)
(54.7% of them are naturalized citizens)
Percentage of workers working in this county: 54.4% Number of people working at home: 2,004 (31.4% of all workers)
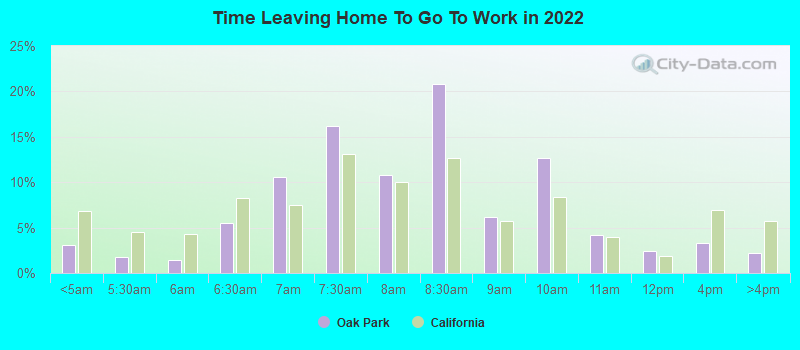
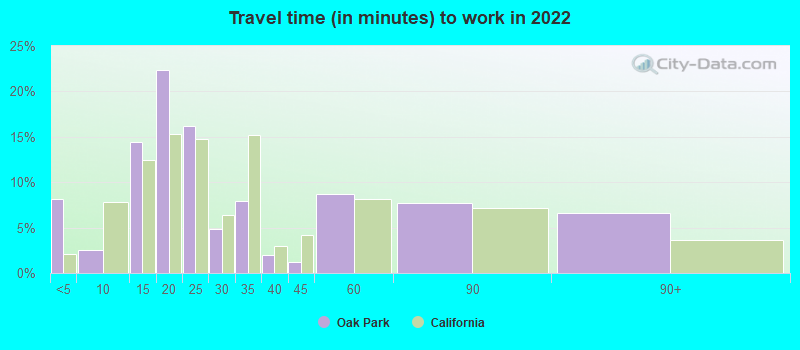
Travel time to work (commute)
Less than 5 minutes: 110
5 to 9 minutes: 319
10 to 14 minutes: 592
15 to 19 minutes: 576
20 to 24 minutes: 708
25 to 29 minutes: 268
30 to 34 minutes: 390
35 to 39 minutes: 112
40 to 44 minutes: 133
45 to 59 minutes: 294
60 to 89 minutes: 999
90 or more minutes: 215
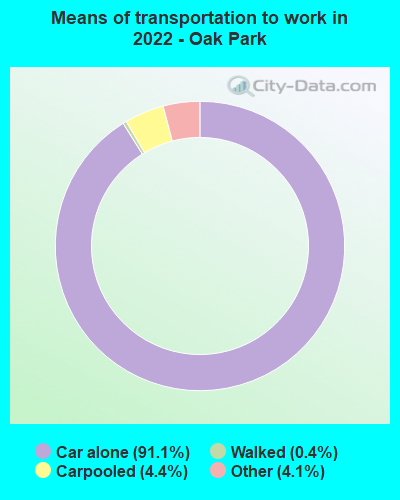
Means of transportation to work:
Drove a car alone: 1,251 (40.4%)
Carpooled: 71 (2.3%)
Taxi: 68 (2.2%)
Walked: 5 (0.2%)
Worked at home: 2,004 (64.7%)
Unemployment by race in 2022
Unemployment rate for White non-Hispanic residents
4.6%Males
5.7%Females
Unemployment rate for two or more race residents
3.4%Males
6.6%Females
Unemployment rate for Hispanic or Latino residents
1.1%Males
4.0%Females
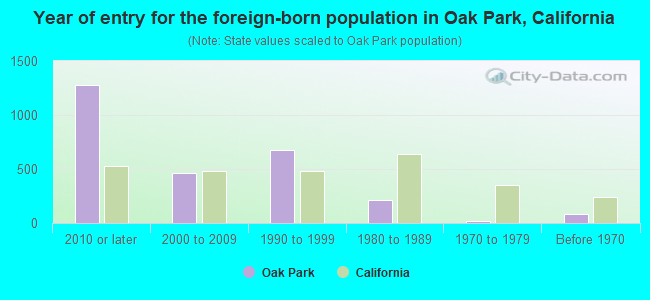
Year of entry for the foreign-born population in Oak Park, California
1,2752010 or later
4632000 to 2009
6781990 to 1999
2141980 to 1989
201970 to 1979
84Before 1970
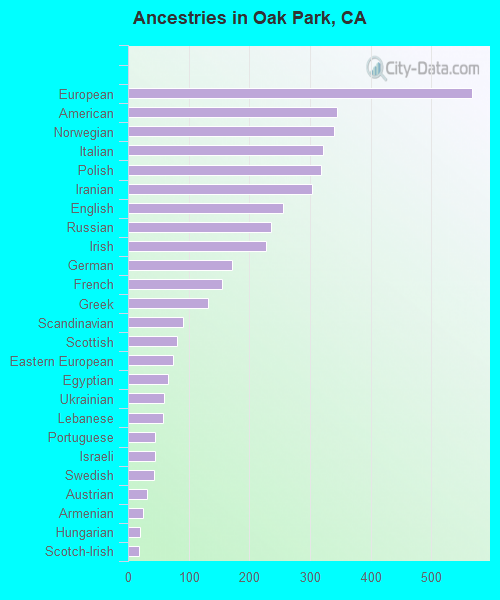
First ancestries reported:
European: 567 (7.1%)
American: 345 (4.3%)
Norwegian: 339 (4.2%)
Italian: 321 (4.0%)
Polish: 319 (4.0%)
Iranian: 303 (3.8%)
English: 256 (3.2%)
Russian: 236 (3.0%)
Irish: 228 (2.9%)
German: 172 (2.2%)
French: 155 (1.9%)
Greek: 132 (1.7%)
Scandinavian: 91 (1.1%)
Scottish: 81 (1.0%)
Eastern European: 74 (0.9%)
Egyptian: 66 (0.8%)
Ukrainian: 60 (0.8%)
Lebanese: 58 (0.7%)
Portuguese: 45 (0.6%)
Israeli: 44 (0.6%)
Swedish: 43 (0.5%)
Austrian: 31 (0.4%)
Armenian: 24 (0.3%)
Hungarian: 19 (0.2%)
Scotch-Irish: 18 (0.2%)
Lithuanian: 17 (0.2%)
Romanian: 14 (0.2%)
South African: 14 (0.2%)
Czech: 12 (0.2%)
Dutch: 10 (0.1%)
Welsh: 10 (0.1%)
Danish: 6 (0.08%)
Most common places of birth for foreign-born residents (%):
India
Oak Park:
21.1% (678)
California:
5.2% (539,184)
China, excluding Hong Kong and Taiwan
Oak Park:
15.6% (502)
California:
6.6% (684,672)
Iran
Oak Park:
9.6% (309)
California:
2.0% (206,004)
Mexico
Oak Park:
6.8% (218)
California:
37.2% (3,881,193)
Canada
Oak Park:
6.7% (217)
California:
1.2% (127,477)
Israel
Oak Park:
6.0% (193)
California:
0.3% (33,029)
Russia
Oak Park:
4.1% (132)
California:
0.7% (71,932)
Korea
Oak Park:
2.5% (80)
California:
3.0% (315,248)
South Africa
Oak Park:
2.3% (75)
California:
0.2% (20,614)
Taiwan
Oak Park:
2.2% (70)
California:
1.7% (176,274)
Hong Kong
Oak Park:
2.1% (66)
California:
1.0% (105,215)
El Salvador
Oak Park:
1.7% (56)
California:
4.2% (440,287)
Ukraine
Oak Park:
1.6% (51)
California:
0.6% (60,761)
Place of birth for U.S.-born residents:
This state: 6,683
Other state: 3,335
Northeast: 1,006
Midwest: 1,400
South: 494
West: 460
88.3% of Oak Park residents lived in the same house 1 years ago. Out of people who lived in different houses, 28.4% lived in this county. Out of people who lived in different counties, 78.8% lived in California.
Oak Park:
88.3%
State average:
88.9%
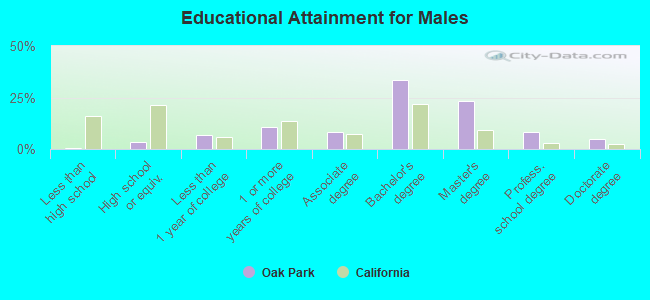
Education attainment for males 25 years and older:
No schooling: 14
Nursery to 4th grade: 0
5th and 6th grade: 0
7th and 8th grade: 0
9th grade: 0
10th grade: 6
11th grade: 0
12th grade, no diploma: 5
High school graduate (or equivalency): 152
Less than 1 year of college: 305
Some college more than 1 year, no degree: 484
Associate degree: 374
Bachelor's degree: 1,503
Master's degree: 1,048
Professional school degree: 380
Doctorate degree: 225
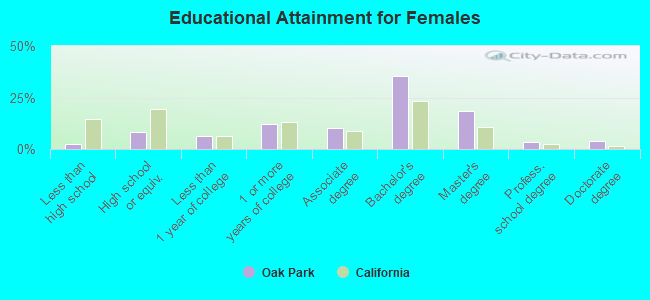
Education attainment for females 25 years and older:
No schooling: 11
Nursery to 4th grade: 1
5th and 6th grade: 39
7th and 8th grade: 0
9th grade: 0
10th grade: 10
11th grade: 0
12th grade, no diploma: 67
High school graduate (or equivalency): 422
Less than 1 year of college: 323
Some college more than 1 year, no degree: 642
Associate degree: 519
Bachelor's degree: 1,833
Master's degree: 954
Professional school degree: 175
Doctorate degree: 207
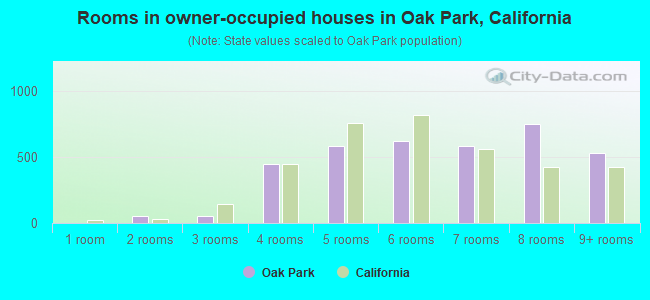
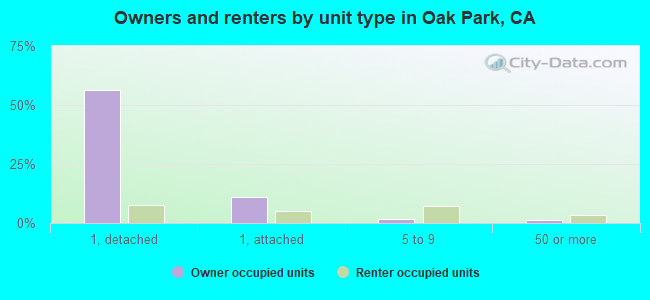
Housing units in structures:
One, detached: 3,341
One, attached: 895
Two: 62
3 or 4: 299
5 to 9: 423
10 to 19: 34
20 to 49: 89
50 or more: 90
Mobile homes: 39
Median worth of mobile homes: $856,999
Housing units lacking complete plumbing facilities in 2022: 0.1%
Housing units lacking complete kitchen facilities in 2022: 0.1%
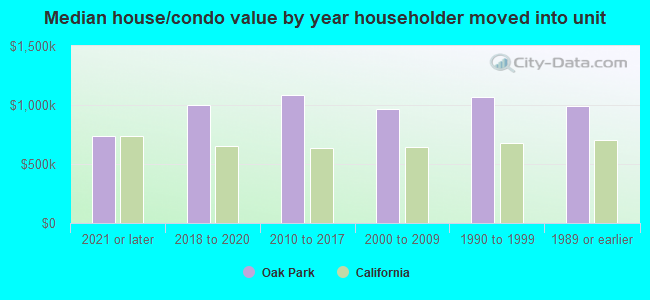
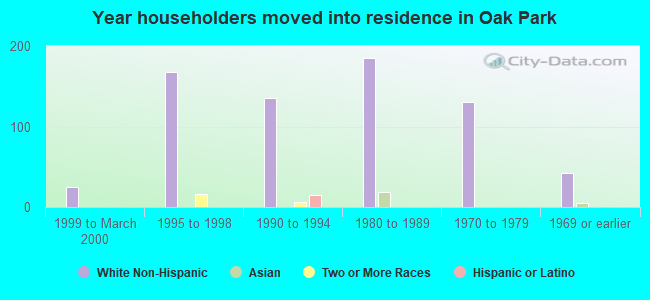
House/condo owner moved in on average 14 years ago