Nuevo, CA (California) Houses and Residents
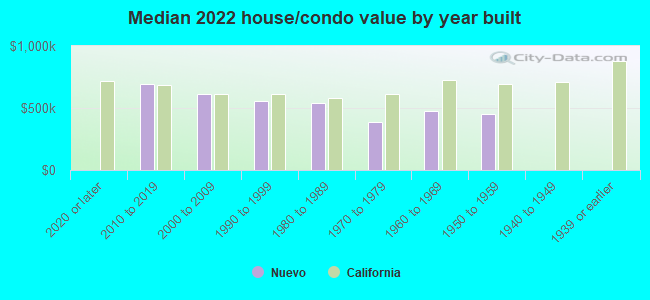
| Nuevo: | $551,681 |
| California: | $715,900 |
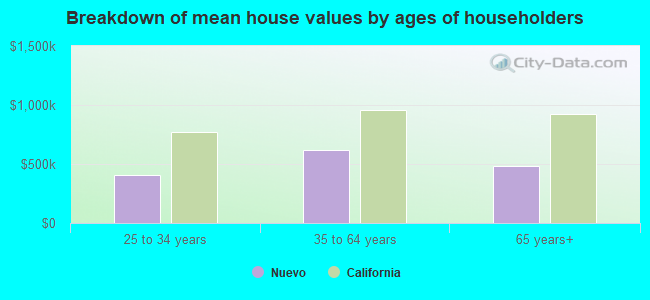
Mean price in 2022:
Detached houses: $614,623
Here: $614,623 State: $988,808 Mobile homes: $267,249
Here: $267,249 State: $184,506
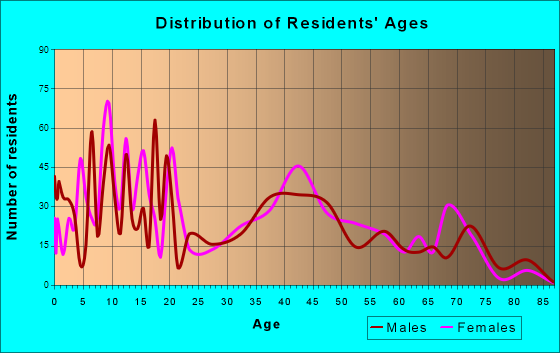
Total population: 6,447 (Urban population: 3,678, Rural population: 267 (all nonfarm))
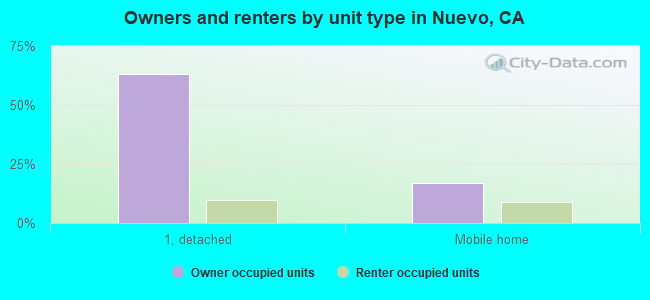
Houses: 1,981 (1,845 occupied: 1,481 owner occupied, 376 renter occupied)
| % of renters here: | 20% |
| State: | 44% |
Housing density: 366 houses/condos per square mile
Median price asked for vacant for-sale houses and condos in 2022 in this county: $550,307.
Median contract rent in 2022: $1,084 (lower quartile is $865, upper quartile is $1,756)
Median rent asked for vacant for-rent units in 2022: $702
Median gross rent in Nuevo, CA in 2022: $1,325
Housing units in Nuevo with a mortgage: 1,096 (48 second mortgage, 0 home equity loan, 49 both second mortgage and home equity loan)
Houses without a mortgage: 0
Median household income for houses/condos with a mortgage: $138,269
Median household income for apartments without a mortgage: $59,433
Median monthly housing costs: $1,831
Compare current foreclosures near Nuevo, CA:
| Photo | Address | Area | Beds / Baths | Price | Details |
|---|---|---|---|---|---|

|
#1
Juniper Flats Rd
Nuevo, CA 92567
|
2,555 sq. feet
|
2 baths 3 beds |
show details | |

|
#2
Via Santana
Nuevo, CA 92567
|
1,660 sq. feet
|
2 baths 2 beds |
show details | |

|
#3
Montgomery Ave
Nuevo, CA 92567
|
2,418 sq. feet
|
1 baths 4 beds |
show details | |

|
#4
Wren Dr
Nuevo, CA 92567
|
3,118 sq. feet
|
2 baths 4 beds |
show details | |

|
#5
Juniper Flats Rd
Nuevo, CA 92567
|
2,555 sq. feet
|
4 baths 3 beds |
show details | |

|
#6
Via Santana
Nuevo, CA 92567
|
1,837 sq. feet
|
2 baths 4 beds |
show details | |

|
#7
Christine Ln
Nuevo, CA 92567
|
1,648 sq. feet
|
2 baths 3 beds |
show details | |

|
#8
Crown Princess Ct
Nuevo, CA 92567
|
3,038 sq. feet
|
2 baths 4 beds |
show details | |

|
#9
Corbett Ln
Nuevo, CA 92567
|
- sq. feet
|
- baths - beds |
show details | |

|
#10
Camino Cristal
Menifee, CA 92584
|
2,337 sq. feet
|
2 baths 5 beds |
$440,900
|
show details |
| Photo | Address | Area | Beds / Baths | Price | Details |
|---|---|---|---|---|---|

|
#11
Quail Creek Lane
Wildomar, CA 92595
|
1,891 sq. feet
|
2 baths 3 beds |
$675,000
|
show details |

|
#12
Vellanto Way
Moreno Valley, CA 92553
|
1,316 sq. feet
|
2 baths 3 beds |
$480,000
|
show details |

|
#13
Ryan Ave
Lake Elsinore, CA 92530
|
- sq. feet
|
2 baths 2 beds |
$509,900
|
show details |

|
#14
Periwinkle Way
Lake Elsinore, CA 92532
|
2,858 sq. feet
|
3 baths 5 beds |
show details | |

|
#15
Serrana Rd
Perris, CA 92570
|
1,300 sq. feet
|
2 baths 3 beds |
show details | |

|
#16
Stovall Way
Yucaipa, CA 92399
|
2,061 sq. feet
|
3 baths 4 beds |
show details | |

|
#17
Sonata Dr
Murrieta, CA 92562
|
3,028 sq. feet
|
3 baths 5 beds |
show details | |

|
#18
Brutus Way
Beaumont, CA 92223
|
3,396 sq. feet
|
2 baths 4 beds |
show details | |

|
#19
Lotus Ave
Yucaipa, CA 92399
|
2,668 sq. feet
|
3 baths 4 beds |
show details | |

|
#20
Brookside Ln
Beaumont, CA 92223
|
2,494 sq. feet
|
2 baths 4 beds |
show details |
| Photo | Address | Area | Beds / Baths | Price | Details |
|---|---|---|---|---|---|

|
#21
The Willows Rd
San Jacinto, CA 92583
|
1,354 sq. feet
|
2 baths 4 beds |
show details | |

|
#22
Sussex Rd
San Jacinto, CA 92583
|
2,177 sq. feet
|
2 baths 3 beds |
show details | |

|
#23
Marilyn Ln
Redlands, CA 92373
|
2,500 sq. feet
|
2 baths 5 beds |
show details | |

|
#24
Felisa Ct
Redlands, CA 92373
|
2,240 sq. feet
|
2 baths 4 beds |
show details | |

|
#25
Long St
Hemet, CA 92543
|
1,464 sq. feet
|
2 baths 2 beds |
show details | |

|
#26
E Acacia Ave
Hemet, CA 92543
|
988 sq. feet
|
1 baths 4 beds |
show details | |

|
#27
Plymouth Rock
Beaumont, CA 92223
|
2,243 sq. feet
|
2 baths 3 beds |
show details | |

|
#28
Breighton Wood St
Menifee, CA 92584
|
3,393 sq. feet
|
2 baths 5 beds |
show details | |

|
#29
Davis St
Moreno Valley, CA 92557
|
1,126 sq. feet
|
2 baths 3 beds |
show details | |

|
#30
Almont Way
Sun City, CA 92585
|
2,865 sq. feet
|
3 baths 6 beds |
show details |
| Photo | Address | Area | Beds / Baths | Price | Details |
|---|---|---|---|---|---|

|
#31
Canopy Ln
Lake Elsinore, CA 92532
|
3,794 sq. feet
|
3 baths 6 beds |
show details | |

|
#32
La Costa Alta Dr
Moreno Valley, CA 92555
|
4,817 sq. feet
|
4 baths 6 beds |
show details | |

|
#33
Hibiscus
Lake Elsinore, CA 92530
|
3,014 sq. feet
|
5 baths 5 beds |
show details | |

|
#34
Bradley Rd
Sun City, CA 92586
|
1,066 sq. feet
|
2 baths 2 beds |
show details | |

|
#35
W Hoffer St
Banning, CA 92220
|
1,470 sq. feet
|
2 baths 3 beds |
show details | |

|
#36
Oradon Way
Hemet, CA 92545
|
883 sq. feet
|
2 baths 2 beds |
show details | |

|
#37
Windsong Ln
San Jacinto, CA 92582
|
1,662 sq. feet
|
2 baths 4 beds |
show details | |

|
#38
Lake Vista Rd
Moreno Valley, CA 92557
|
2,284 sq. feet
|
3 baths 4 beds |
show details | |

|
#39
Duncan Dr
Moreno Valley, CA 92555
|
3,570 sq. feet
|
3 baths 6 beds |
show details | |

|
#40
Mcguire Rd
Perris, CA 92570
|
6,347 sq. feet
|
4 baths 5 beds |
show details |
| Photo | Address | Area | Beds / Baths | Price | Details |
|---|---|---|---|---|---|

|
#41
Broadleaf Ln
Moreno Valley, CA 92553
|
2,074 sq. feet
|
3 baths 4 beds |
show details | |

|
#42
Electra Ct
Moreno Valley, CA 92551
|
1,577 sq. feet
|
2 baths 3 beds |
show details | |

|
#43
Eleanor Ln
Moreno Valley, CA 92551
|
1,123 sq. feet
|
2 baths 3 beds |
show details | |

|
#44
Aloha Rd
Perris, CA 92570
|
2,508 sq. feet
|
2 baths 4 beds |
show details | |

|
#45
Canyon Estates Dr
Lake Elsinore, CA 92532
|
2,358 sq. feet
|
2 baths 6 beds |
show details | |

|
#46
Bell Cir
Winchester, CA 92596
|
2,565 sq. feet
|
3 baths 3 beds |
show details | |

|
#47
Groveland St
Beaumont, CA 92223
|
- sq. feet
|
3 baths 4 beds |
show details | |

|
#48
Baldy Peak Dr
Sun City, CA 92586
|
1,570 sq. feet
|
2 baths 3 beds |
show details | |

|
#49
Carnation Way
Lake Elsinore, CA 92532
|
- sq. feet
|
2 baths 3 beds |
show details | |

|
Check over 1 million property listings on Foreclosure.com!
|
browse all offers | |||

Latest news about housing in Nuevo, CA collected exclusively by city-data.com from local newspapers, TV, and radio stations


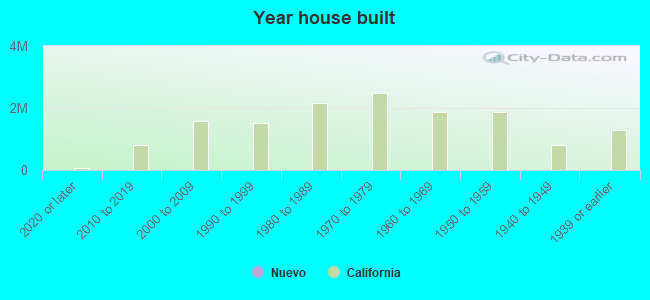
Median year apartment built: 1986
Household type by relationship:
Households: 7,438- Male householders: 949 (67 living alone), Female householders: 895 (101 living alone)
1,244 spouses (1,244 opposite-sex spouses), 202 unmarried partners, (202 opposite-sex unmarried partners), 3,060 children (2,895 natural, 78 adopted, 86 stepchildren), 249 grandchildren, 119 brothers or sisters, 405 parents, 0 foster children, 134 other relatives, 178 non-relatives
Size of family households: 365 2-persons, 144 3-persons, 390 4-persons, 445 5-persons, 72 6-persons, 200 7-or-more-persons.
Size of nonfamily households: 163 1-person, 91 2-persons.
1,597 married couples with children.
328 single-parent households (65 men, 263 women).
44.6% of residents of Nuevo speak English at home.
54.5% of residents speak Spanish at home (70% speak English very well, 18% speak English well, 9% speak English not well, 3% don't speak English at all).
0.4% of residents speak other Indo-European language at home (23% speak English very well, 77% speak English not well).
Foreign born population: 1,764 (23.7%)
(50.2% of them are naturalized citizens)
| Here: | 6.2 |
| State: | 6.0 |
| Here: | 4.6 |
| State: | 3.9 |
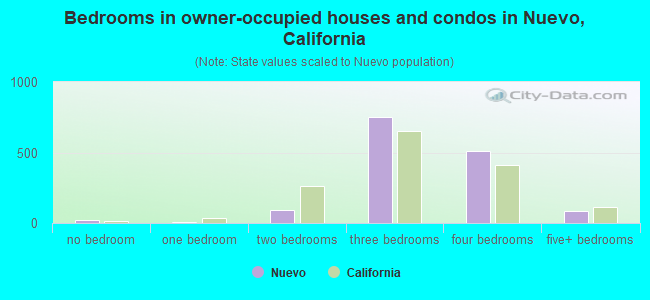
- Bedrooms in owner-occupied houses and condos in Nuevo, California
- 24no bedroom
- 101 bedroom
- 942 bedrooms
- 7523 bedrooms
- 5134 bedrooms
- 885+ bedrooms
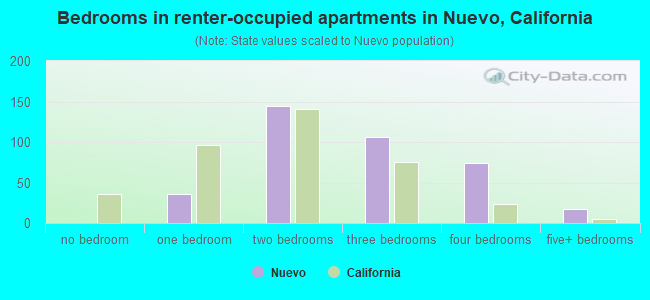
- Bedrooms in renter-occupied apartments in Nuevo, California
- 0no bedroom
- 361 bedroom
- 1442 bedrooms
- 1063 bedrooms
- 744 bedrooms
- 175+ bedrooms
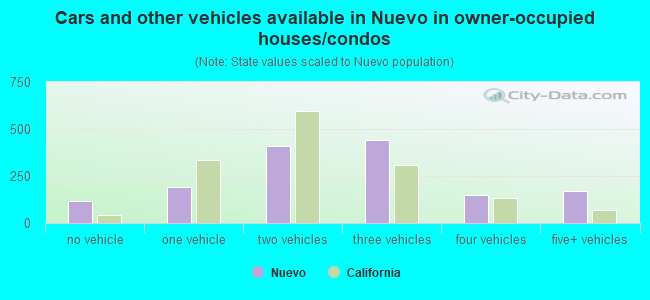
- Cars and other vehicles available in Nuevo in owner-occupied houses/condos
- 118no vehicle
- 1901 vehicle
- 4092 vehicles
- 4443 vehicles
- 1504 vehicles
- 1705+ vehicles
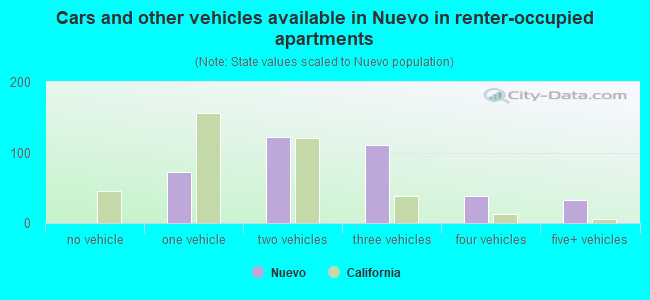
- Cars and other vehicles available in Nuevo in renter-occupied apartments
- 0no vehicle
- 731 vehicle
- 1222 vehicles
- 1113 vehicles
- 394 vehicles
- 325+ vehicles
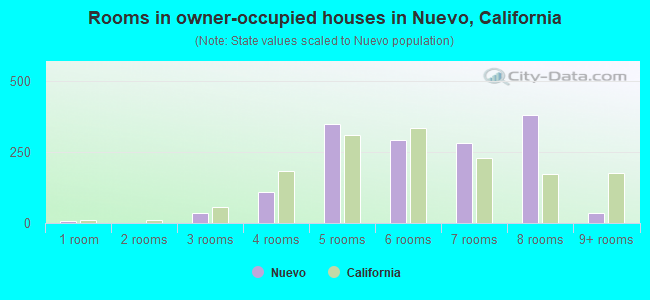
- Rooms in owner-occupied houses in Nuevo, California
- 81 room
- 02 rooms
- 343 rooms
- 1084 rooms
- 3485 rooms
- 2916 rooms
- 2797 rooms
- 3808 rooms
- 349+ rooms
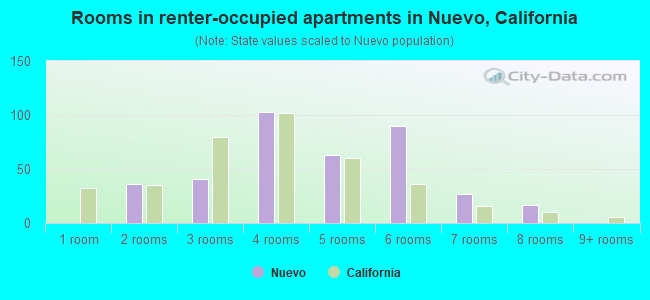
- Rooms in renter-occupied apartments in Nuevo, California
- 01 room
- 362 rooms
- 413 rooms
- 1034 rooms
- 635 rooms
- 906 rooms
- 277 rooms
- 178 rooms
- 09+ rooms
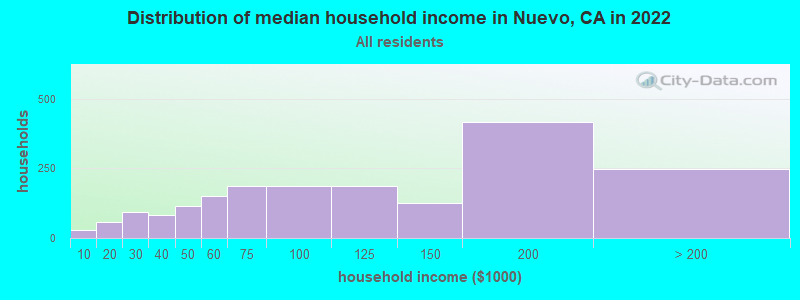
Nuevo, CA household income distribution

- 28Less than $10,000
- 57$10,000 to $19,999
- 94$20,000 to $29,999
- 82$30,000 to $39,999
- 114$40,000 to $49,999
- 150$50,000 to $59,999
- 188$60,000 to $74,999
- 186$75,000 to $99,999
- 187$100,000 to $124,999
- 126$125,000 to $149,999
- 416$150,000 to $199,999
- 247$200,000 or more
Home value of owner - occupied houses in 2022 in Nuevo, CA
-
- 8Less than $10,000
- 6$35,000 to $39,999
- 17$50,000 to $59,999
- 36$80,000 to $89,999
- 45$125,000 to $149,999
- 7$175,000 to $199,999
- 15$200,000 to $249,999
- 74$250,000 to $299,999
- 119$300,000 to $399,999
- 311$400,000 to $499,999
- 574$500,000 to $749,999
- 144$750,000 to $999,999
- 63$1,000,000 to $1,499,999
- 12$2,000,000 or more

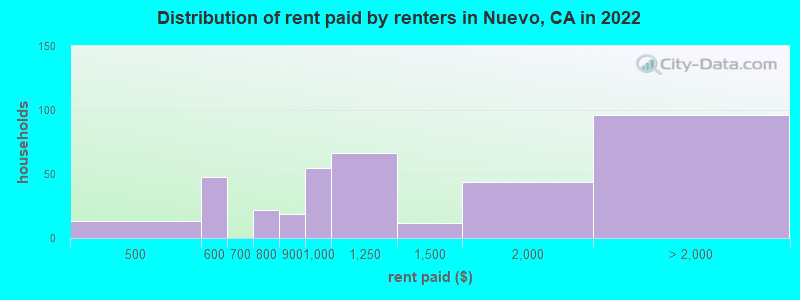
Rent paid by renters in 2022 in Nuevo, CA
-
- 13$400 to $449
- 39$500 to $549
- 8$550 to $599
- 21$700 to $749
- 18$800 to $899
- 54$900 to $999
- 66$1,000 to $1,249
- 11$1,250 to $1,499
- 43$1,500 to $1,999
- 60$2,000 to $2,499
- 35No cash rent
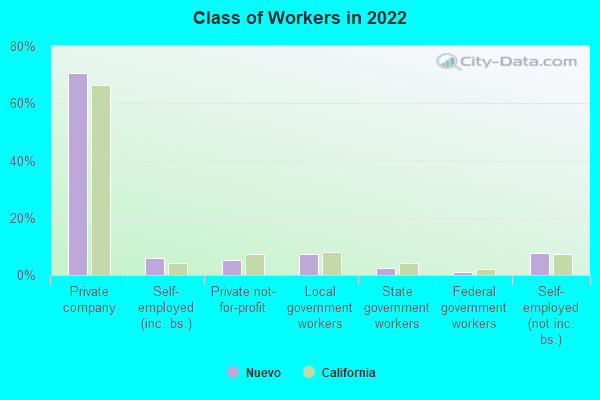
Percentage of workers working in this county: 83.2%
Number of people working at home: 301 (9.1% of all workers)
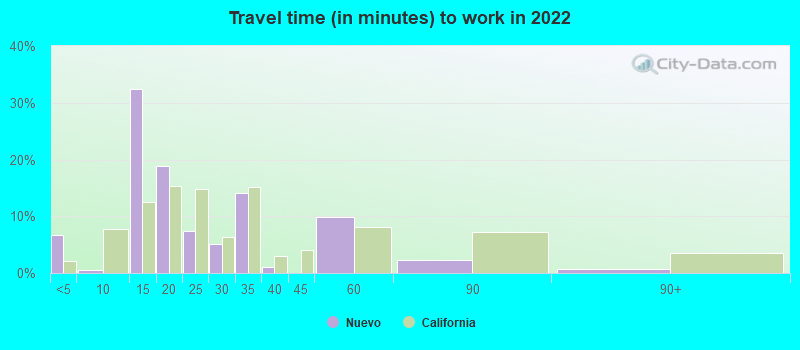
Travel time to work (commute)
- Less than 5 minutes: 0
- 5 to 9 minutes: 117
- 10 to 14 minutes: 144
- 15 to 19 minutes: 581
- 20 to 24 minutes: 138
- 25 to 29 minutes: 203
- 30 to 34 minutes: 466
- 35 to 39 minutes: 54
- 40 to 44 minutes: 93
- 45 to 59 minutes: 334
- 60 to 89 minutes: 494
- 90 or more minutes: 346
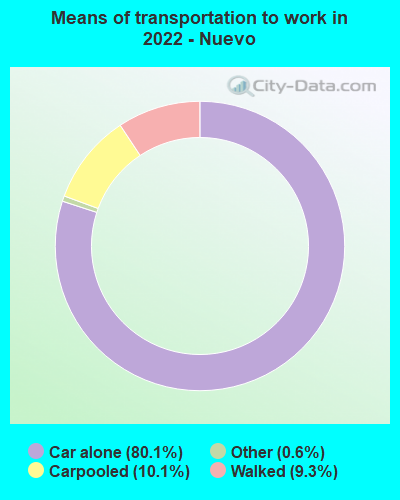
Means of transportation to work:
- Drove a car alone: 558 (56.5%)
- Carpooled: 69 (7.0%)
- Taxi: 4 (0.4%)
- Walked: 61 (6.2%)
- Worked at home: 584 (59.1%)
- Unemployment by race in 2022
- Unemployment rate for White non-Hispanic residents
- 3.4%Males
- 1.9%Females
- Unemployment rate for other race residents
- 18.0%Males
- 3.9%Females
- Unemployment rate for two or more race residents
- 3.4%Males
- Unemployment rate for Hispanic or Latino residents
- 11.4%Males
- 1.5%Females
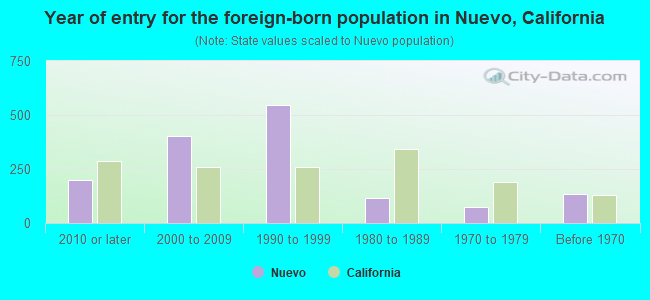
- Year of entry for the foreign-born population in Nuevo, California
- 1982010 or later
- 4042000 to 2009
- 5441990 to 1999
- 1171980 to 1989
- 741970 to 1979
- 133Before 1970
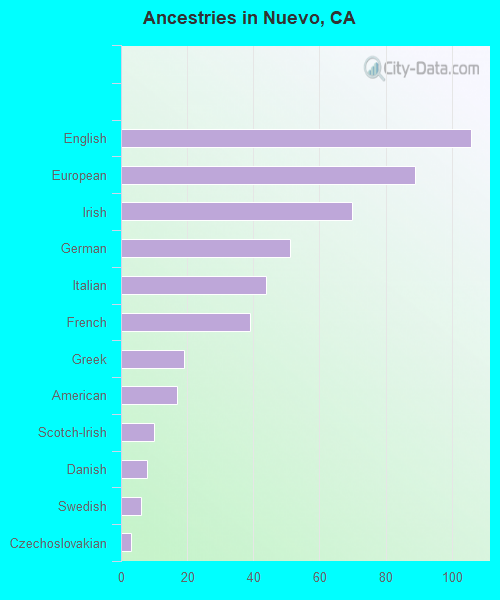
First ancestries reported:
- English: 106 (2.6%)
- European: 89 (2.2%)
- Irish: 70 (1.7%)
- German: 51 (1.2%)
- Italian: 44 (1.1%)
- French: 39 (0.9%)
- Greek: 19 (0.5%)
- American: 17 (0.4%)
- Scotch-Irish: 10 (0.2%)
- Danish: 8 (0.2%)
- Swedish: 6 (0.1%)
- Czechoslovakian: 3 (0.07%)
Most common places of birth for foreign-born residents (%):
| Nuevo: | 87.6% (1,546) |
| California: | 37.2% (3,881,193) |
| Nuevo: | 6.2% (110) |
| California: | 0.1% (15,357) |
| Nuevo: | 1.5% (27) |
| California: | 0.1% (10,538) |
Place of birth for U.S.-born residents:
- This state: 5,043
- Other state: 631
- Northeast: 87
- Midwest: 160
- South: 135
- West: 246
93.8% of Nuevo residents lived in the same house 1 years ago.
Out of people who lived in different houses, 46.8% lived in this county.
Out of people who lived in different counties, 65.1% lived in California.
| Nuevo: | 93.8% |
| State average: | 88.9% |
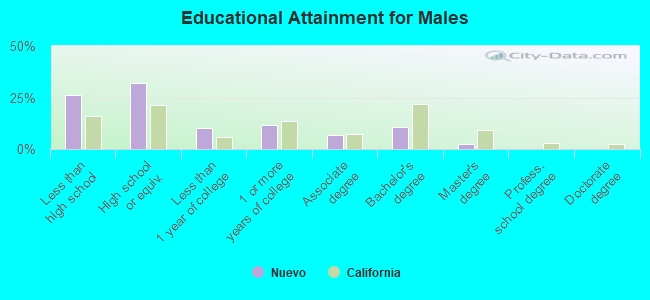
Education attainment for males 25 years and older:
- No schooling: 137
- Nursery to 4th grade: 20
- 5th and 6th grade: 109
- 7th and 8th grade: 0
- 9th grade: 48
- 10th grade: 11
- 11th grade: 74
- 12th grade, no diploma: 151
- High school graduate (or equivalency): 671
- Less than 1 year of college: 214
- Some college more than 1 year, no degree: 248
- Associate degree: 144
- Bachelor's degree: 228
- Master's degree: 52
- Professional school degree: 0
- Doctorate degree: 0
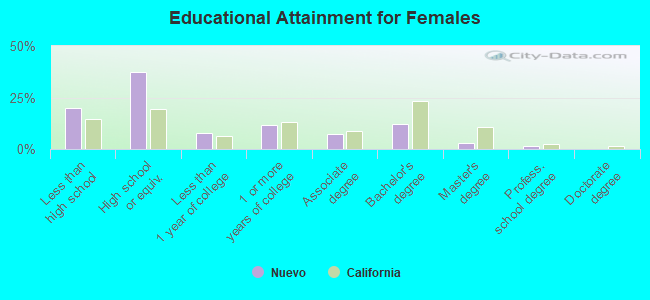
Education attainment for females 25 years and older:
- No schooling: 106
- Nursery to 4th grade: 39
- 5th and 6th grade: 85
- 7th and 8th grade: 69
- 9th grade: 0
- 10th grade: 43
- 11th grade: 56
- 12th grade, no diploma: 54
- High school graduate (or equivalency): 854
- Less than 1 year of college: 173
- Some college more than 1 year, no degree: 268
- Associate degree: 169
- Bachelor's degree: 278
- Master's degree: 63
- Professional school degree: 38
- Doctorate degree: 0
Housing units in structures:
- One, detached: 1,478
- Two: 26
- Mobile homes: 475
Median worth of mobile homes: $333,001
Housing units lacking complete kitchen facilities in 2022: 1.8%
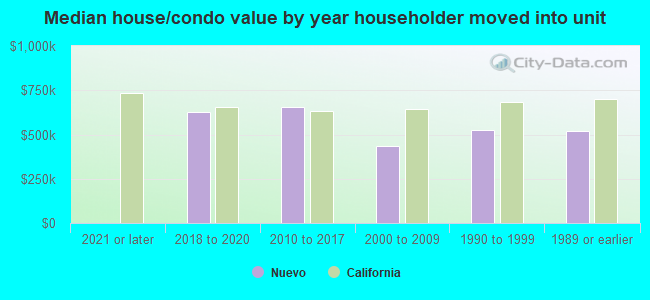
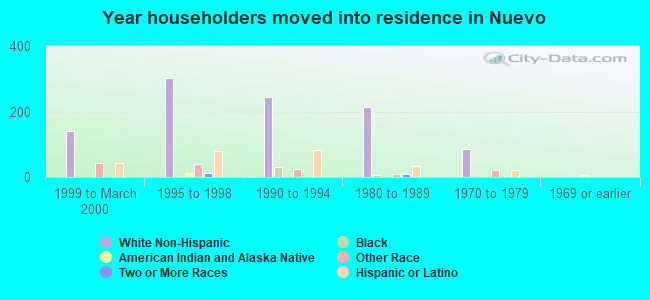
House/condo owner moved in on average 11 years ago
Renter moved in on average 7 years ago

- 75.8%Utility gas
- 13.6%Electricity
- 8.6%Bottled, tank, or LP gas
- 0.9%Fuel oil, kerosene, etc.
- 0.6%Solar energy
- 0.4%Wood
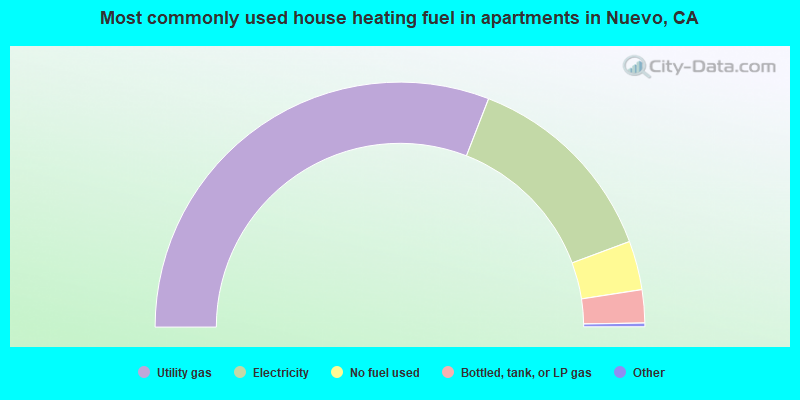
- 62.1%Utility gas
- 27.0%Electricity
- 6.5%No fuel used
- 4.4%Bottled, tank, or LP gas
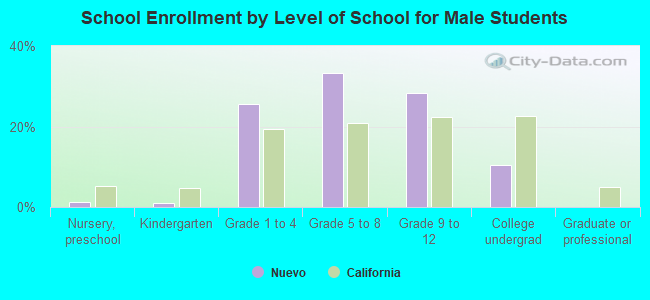
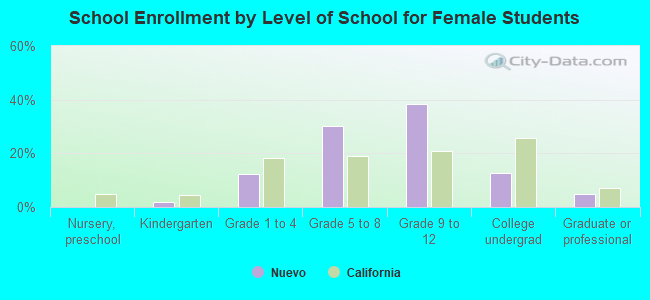
Private vs. public school enrollment:
| Here: | 6.9% |
| California: | 10.5% |
| Here: | 0.0% |
| California: | 8.5% |
| Here: | 2.9% |
| California: | 15.9% |