Northeast Pueblo, CO (Colorado) Houses and Residents
| Northeast Pueblo: | $203,899 |
| Colorado: | $531,100 |
Total population: 942 (Urban population: 0, Rural population: 852 (133 farm, 719 nonfarm))
Houses: 396 (335 occupied: 258 owner occupied, 77 renter occupied)
| % of renters here: | 23% |
| State: | 34% |
Housing density: 1 houses/condos per square mile
Median price asked for vacant for-sale houses and condos in 2022 in this county: $225,295.
Median contract rent in 2022: $746 (lower quartile is $429, upper quartile is $1,768)
Median gross rent in Northeast Pueblo, CO in 2022: $1,070
Housing units in Northeast Pueblo with a mortgage: 68 (9 second mortgage, 3 home equity loan, 2 both second mortgage and home equity loan)
Houses without a mortgage: 46
Compare current foreclosures near Northeast Pueblo, CO:
| Photo | Address | Area | Beds / Baths | Price | Details |
|---|---|---|---|---|---|

|
#1
South Rd
Pueblo, CO 81006
|
2,208 sq. feet
|
1 baths 3 beds |
show details | |

|
#2
Bush Rd
Avondale, CO 81022
|
2,432 sq. feet
|
3 baths 4 beds |
show details | |

|
#3
E 12th St
Pueblo, CO 81001
|
1,620 sq. feet
|
1 baths 2 beds |
show details | |

|
#4
8th St
Fowler, CO 81039
|
948 sq. feet
|
1 baths 2 beds |
show details | |

|
#5
E 6th St
Pueblo, CO 81001
|
810 sq. feet
|
1 baths 2 beds |
show details | |

|
#6
E 6th St
Pueblo, CO 81001
|
896 sq. feet
|
1 baths 2 beds |
show details | |

|
#7
County Farm Rd
Pueblo, CO 81006
|
1,764 sq. feet
|
1 baths 3 beds |
show details | |

|
#8
Current Way
Pueblo, CO 81006
|
2,051 sq. feet
|
2 baths 3 beds |
show details | |

|
#9
24 1/4 Ln
Pueblo, CO 81006
|
1,621 sq. feet
|
2 baths 3 beds |
show details | |

|
#10
E Swink Ave
Fowler, CO 81039
|
1,272 sq. feet
|
1 baths 3 beds |
show details |
| Photo | Address | Area | Beds / Baths | Price | Details |
|---|---|---|---|---|---|

|
#11
Hillside Rd
Pueblo, CO 81006
|
1,152 sq. feet
|
1 baths 2 beds |
show details | |

|
#12
Brewster Rd
Pueblo, CO 81006
|
1,232 sq. feet
|
1 baths 2 beds |
show details | |

|
#13
Iris Rd
Pueblo, CO 81006
|
2,079 sq. feet
|
2 baths 2 beds |
show details | |

|
#14
Hillside Rd
Pueblo, CO 81006
|
3,512 sq. feet
|
3 baths 3 beds |
show details | |

|
#15
Hillside Rd
Pueblo, CO 81006
|
3,512 sq. feet
|
3 baths 3 beds |
show details | |

|
#16
Preston Rd
Pueblo, CO 81006
|
2,124 sq. feet
|
2 baths 5 beds |
show details | |

|
#17
28th Ln
Pueblo, CO 81001
|
- sq. feet
|
- baths - beds |
show details | |

|
#18
Cortner Rd
Pueblo, CO 81006
|
- sq. feet
|
- baths - beds |
show details | |

|
#19
County Road 4
Fowler, CO 81039
|
- sq. feet
|
- baths - beds |
show details | |

|
#20
Massey Rd
Pueblo, CO 81006
|
- sq. feet
|
- baths - beds |
show details |
| Photo | Address | Area | Beds / Baths | Price | Details |
|---|---|---|---|---|---|

|
#21
Meadow Ln
Pueblo, CO 81006
|
- sq. feet
|
- baths - beds |
show details | |

|
#22
E Us Highway 50
Avondale, CO 81022
|
- sq. feet
|
- baths - beds |
show details | |

|
#23
James St
Avondale, CO 81022
|
- sq. feet
|
- baths - beds |
show details | |

|
#24
N Highland Ave
Boone, CO 81025
|
- sq. feet
|
- baths - beds |
show details | |

|
#25
James St
Avondale, CO 81022
|
- sq. feet
|
- baths - beds |
show details | |

|
Check over 1 million property listings on Foreclosure.com!
|
browse all offers | |||

Household type by relationship:
Households: 154,742- In family households: 128,830 (27,953 male householders, 13,354 female householders)
28,505 spouses, 44,873 children (40,751 natural, 1,194 adopted, 2,928 stepchildren), 4,951 grandchildren, 1,365 brothers or sisters, 1,249 parents, foster children, 1,681 other relatives, 4,022 non-relatives
- In nonfamily households: 25,912 (10,367 male householders (8,367 living alone)), 11,298 female householders (9,846 living alone)), 4,247 nonrelatives
- In group quarters: 4,321 (3,126 institutionalized population)
21,787 married couples with children.
10,219 single-parent households (2,405 men, 7,814 women).
81.9% of residents of Northeast Pueblo speak English at home.
12.8% of residents speak Spanish at home (78% speak English very well, 18% speak English well, 4% speak English not well).
4.9% of residents speak Asian or Pacific Island language at home (82% speak English well, 18% speak English not well).
0.4% of residents speak other language at home (100% speak English very well).
Foreign born population: 62 (6.1%)
(80.6% of them are naturalized citizens)
| Here: | 5.3 |
| State: | 6.8 |
| Here: | 4.5 |
| State: | 4.0 |

- Bedrooms in owner-occupied houses and condos in Northeast Pueblo, Colorado
- 1no bedroom
- 151 bedroom
- 632 bedrooms
- 1463 bedrooms
- 234 bedrooms
- 105+ bedrooms

- Bedrooms in renter-occupied apartments in Northeast Pueblo, Colorado
- 3no bedroom
- 91 bedroom
- 252 bedrooms
- 303 bedrooms
- 84 bedrooms
- 25+ bedrooms

- Cars and other vehicles available in Northeast Pueblo in owner-occupied houses/condos
- 8no vehicle
- 551 vehicle
- 1122 vehicles
- 563 vehicles
- 204 vehicles
- 75+ vehicles

- Cars and other vehicles available in Northeast Pueblo in renter-occupied apartments
- 0no vehicle
- 291 vehicle
- 272 vehicles
- 163 vehicles
- 54 vehicles
- 05+ vehicles

- Rooms in owner-occupied houses in Northeast Pueblo, Colorado
- 01 room
- 112 rooms
- 43 rooms
- 454 rooms
- 725 rooms
- 476 rooms
- 367 rooms
- 258 rooms
- 189+ rooms

- Rooms in renter-occupied apartments in Northeast Pueblo, Colorado
- 01 room
- 32 rooms
- 63 rooms
- 224 rooms
- 275 rooms
- 96 rooms
- 87 rooms
- 28 rooms
- 09+ rooms


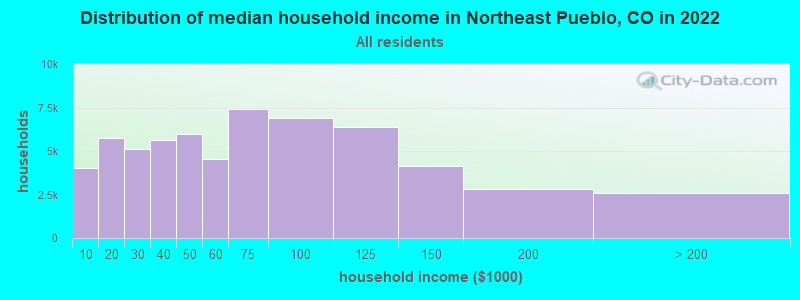
Northeast Pueblo, CO household income distribution

- 4,048Less than $10,000
- 5,750$10,000 to $19,999
- 5,131$20,000 to $29,999
- 5,626$30,000 to $39,999
- 5,963$40,000 to $49,999
- 4,518$50,000 to $59,999
- 7,406$60,000 to $74,999
- 6,874$75,000 to $99,999
- 6,357$100,000 to $124,999
- 4,128$125,000 to $149,999
- 2,841$150,000 to $199,999
- 2,590$200,000 or more
Percentage of workers working in this county: 79.5%
Number of people working at home: 81 (19.4% of all workers)
Travel time to work (commute)
- Less than 5 minutes: 0
- 5 to 9 minutes: 9
- 10 to 14 minutes: 0
- 15 to 19 minutes: 18
- 20 to 24 minutes: 70
- 25 to 29 minutes: 34
- 30 to 34 minutes: 46
- 35 to 39 minutes: 13
- 40 to 44 minutes: 17
- 45 to 59 minutes: 30
- 60 to 89 minutes: 27
- 90 or more minutes: 37
Means of transportation to work:
- Drove a car alone: 248 (72.1%)
- Carpooled: 35 (10.2%)
- Walked: 18 (5.2%)
- Worked at home: 43 (12.5%)


- Year of entry for the foreign-born population in Northeast Pueblo, Colorado
- 01995 to March 2000
- 151990 to 1994
- 01985 to 1989
- 01980 to 1984
- 101975 to 1979
- 31970 to 1974
- 01965 to 1969
- 6Before 1965
Most common places of birth for foreign-born residents (%):
| Northeast Pueblo: | 29.4% (10) |
| Colorado: | 3.2% (11,892) |
| Northeast Pueblo: | 23.5% (8) |
| Colorado: | 0.1% (366) |
| Northeast Pueblo: | 20.6% (7) |
| Colorado: | 1.6% (5,990) |
| Northeast Pueblo: | 17.6% (6) |
| Colorado: | 3.1% (11,301) |
| Northeast Pueblo: | 8.8% (3) |
| Colorado: | 3.7% (13,552) |
Place of birth for U.S.-born residents:
- This state: 548
- Other state: 263
- Northeast: 38
- Midwest: 95
- South: 39
- West: 91
58% of Northeast Pueblo residents lived in the same house 5 years ago.
Out of people who lived in different houses, 48% lived in this county.
Out of people who lived in different counties, 58% lived in Colorado.
Education attainment for males 25 years and older:
- No schooling: 0
- Nursery to 4th grade: 3
- 5th and 6th grade: 0
- 7th and 8th grade: 11
- 9th grade: 2
- 10th grade: 5
- 11th grade: 3
- 12th grade, no diploma: 6
- High school graduate (or equivalency): 123
- Less than 1 year of college: 28
- Some college more than 1 year, no degree: 56
- Associate degree: 23
- Bachelor's degree: 18
- Master's degree: 8
- Professional school degree: 6
- Doctorate degree: 0

Education attainment for females 25 years and older:
- No schooling: 5
- Nursery to 4th grade: 0
- 5th and 6th grade: 9
- 7th and 8th grade: 12
- 9th grade: 9
- 10th grade: 8
- 11th grade: 13
- 12th grade, no diploma: 23
- High school graduate (or equivalency): 98
- Less than 1 year of college: 19
- Some college more than 1 year, no degree: 28
- Associate degree: 15
- Bachelor's degree: 37
- Master's degree: 12
- Professional school degree: 1
- Doctorate degree: 0


Housing units in structures:
- One, detached: 285
- One, attached: 7
- 5 to 9: 4
- Mobile homes: 100
Median worth of mobile homes: $84,967
Housing units lacking complete kitchen facilities: 3.5%

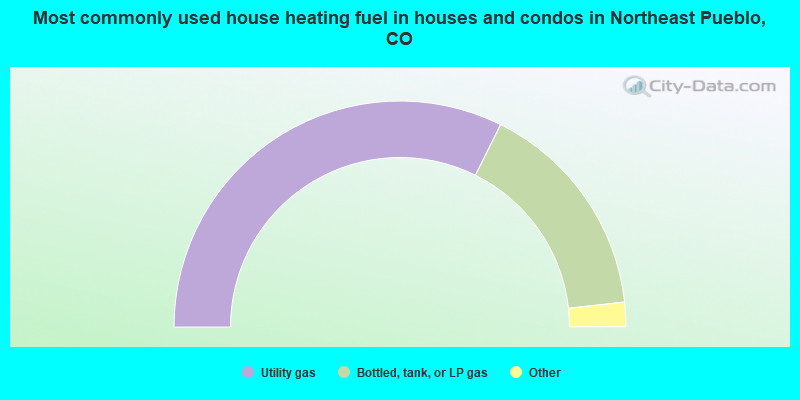
- 64.7%Utility gas
- 31.8%Bottled, tank, or LP gas
- 1.9%Other fuel
- 1.6%Electricity
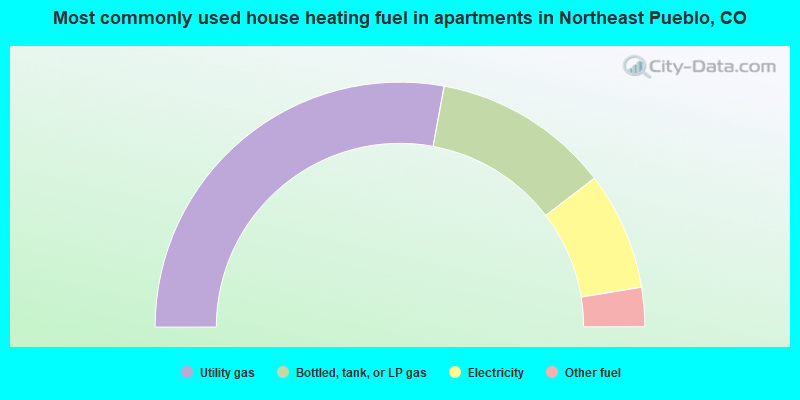
- 55.8%Utility gas
- 23.4%Bottled, tank, or LP gas
- 15.6%Electricity
- 5.2%Other fuel
Private vs. public school enrollment:
| Here: | 19.6% |
| Colorado: | 8.8% |
| Here: | 0.0% |
| Colorado: | 7.9% |
| Here: | 10.0% |
| Colorado: | 16.7% |


