North Elba, NY (New York) Houses and Residents
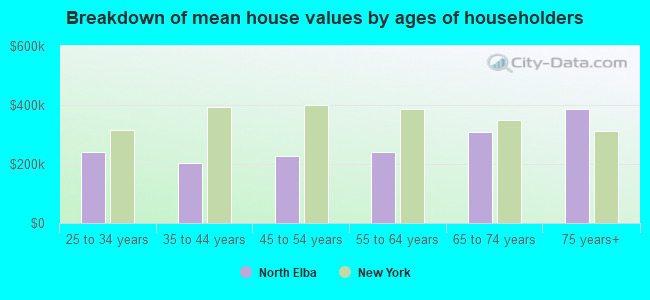
| North Elba: | $253,100 |
| New York: | $400,400 |
Total population: 8,957 (Urban population: 6,834 (all inside urban clusters), Rural population: 1,827 (all nonfarm))
Houses: 3,991 (2,944 occupied: 1,799 owner occupied, 1,145 renter occupied)
| % of renters here: | 39% |
| State: | 46% |
Housing density: 26 houses/condos per square mile
Median price asked for vacant for-sale houses and condos in 2022 in this county: $312,663.
Median contract rent in 2022: $768 (lower quartile is $582, upper quartile is $1,049)
Median rent asked for vacant for-rent units in 2022: $852
Median gross rent in North Elba, NY in 2022: $858
Housing units in North Elba with a mortgage: 772 (26 second mortgage, 104 home equity loan, 0 both second mortgage and home equity loan)
Houses without a mortgage: 535
Compare current foreclosures near North Elba, NY:
| Photo | Address | Area | Beds / Baths | Price | Details |
|---|---|---|---|---|---|

|
#1
State Route 86
Paul Smiths, NY 12970
|
1,760 sq. feet
|
2 baths 3 beds |
$34,900
|
show details |

|
#2
Jenkins St
Saranac Lake, NY 12983
|
1,552 sq. feet
|
1 baths 3 beds |
show details | |

|
#3
New York State Route 86
Jay, NY 12941
|
1,750 sq. feet
|
2 baths 3 beds |
show details | |

|
#4
Hunters Way
Lake Placid, NY 12946
|
986 sq. feet
|
1 baths 3 beds |
show details | |

|
#5
Edward St
Saranac Lake, NY 12983
|
1,208 sq. feet
|
1 baths 2 beds |
show details | |

|
#6
Old Lake Colby Rd
Saranac Lake, NY 12983
|
2,834 sq. feet
|
2 baths 6 beds |
show details | |

|
#7
County Route 60
Vermontville, NY 12989
|
1,007 sq. feet
|
1 baths 2 beds |
show details | |

|
#8
State Route 86
Jay, NY 12941
|
1,750 sq. feet
|
1 baths 3 beds |
show details | |

|
#9
Chickadee Ln
Lake Placid, NY 12946
|
- sq. feet
|
- baths - beds |
show details | |

|
#10
Greenwood St Apt 311
Lake Placid, NY 12946
|
- sq. feet
|
- baths - beds |
show details |
| Photo | Address | Area | Beds / Baths | Price | Details |
|---|---|---|---|---|---|

|
#11
Kiwassa Rd Apt 3e
Saranac Lake, NY 12983
|
- sq. feet
|
- baths - beds |
show details | |

|
#12
Margaret St # 2
Saranac Lake, NY 12983
|
- sq. feet
|
- baths - beds |
show details | |

|
#13
Academy Way
Bloomingdale, NY 12913
|
- sq. feet
|
- baths - beds |
show details | |

|
#14
Main St
Bloomingdale, NY 12913
|
- sq. feet
|
- baths - beds |
show details | |

|
#15
Poplar Ln
Bloomingdale, NY 12913
|
- sq. feet
|
- baths - beds |
show details | |

|
Check over 1 million property listings on Foreclosure.com!
|
browse all offers | |||

 | First time visiting the Adirondacks? What to experience in this famous New York state park (174 replies) |
| smaller Upstate NY cities and towns/African American communities (5986 replies) |
| Underground Railroad towns in NY..... (19 replies) |
| Vacation lake communities (5 replies) |

Household type by relationship:
Households: 36,723- In family households: 29,063 (7,068 male householders, 2,958 female householders)
7,869 spouses, 8,932 children (8,289 natural, 199 adopted, 444 stepchildren), 530 grandchildren, 209 brothers or sisters, 216 parents, foster children, 186 other relatives, 963 non-relatives
- In nonfamily households: 7,660 (3,015 male householders (2,327 living alone)), 3,221 female householders (2,699 living alone)), 1,424 nonrelatives
- In group quarters: 2,647 (2,180 institutionalized population)
6,134 married couples with children.
2,087 single-parent households (681 men, 1,406 women).
90.4% of residents of North Elba speak English at home.
5.1% of residents speak Spanish at home (24% speak English very well, 60% speak English well, 14% speak English not well, 2% don't speak English at all).
3.5% of residents speak other Indo-European language at home (57% speak English very well, 32% speak English well, 8% speak English not well, 3% don't speak English at all).
0.9% of residents speak Asian or Pacific Island language at home (56% speak English very well, 15% speak English well, 6% speak English not well, 23% don't speak English at all).
Foreign born population: 871 (9.7%)
(40.8% of them are naturalized citizens)
| Here: | 6.3 |
| State: | 6.3 |
| Here: | 3.6 |
| State: | 3.8 |
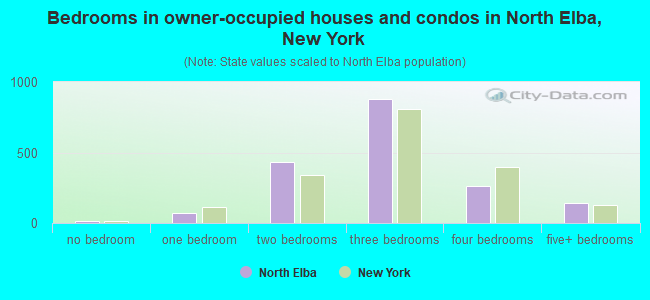
- Bedrooms in owner-occupied houses and condos in North Elba, New York
- 12no bedroom
- 711 bedroom
- 4352 bedrooms
- 8773 bedrooms
- 2634 bedrooms
- 1415+ bedrooms
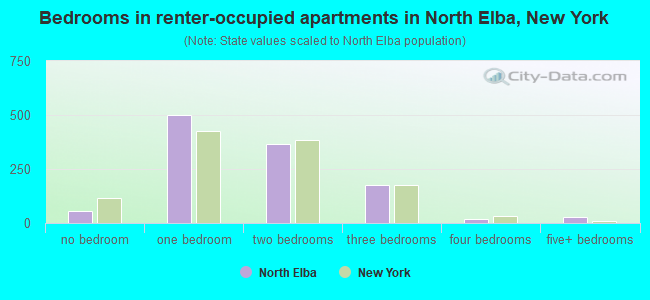
- Bedrooms in renter-occupied apartments in North Elba, New York
- 55no bedroom
- 4991 bedroom
- 3672 bedrooms
- 1773 bedrooms
- 174 bedrooms
- 305+ bedrooms
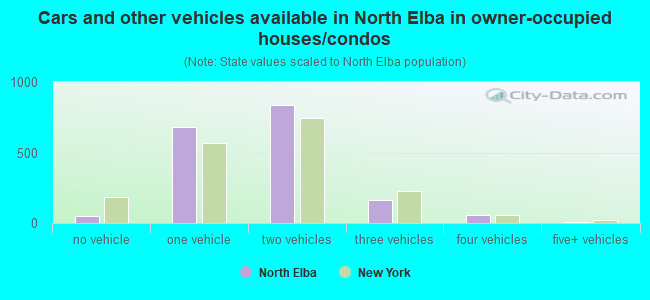
- Cars and other vehicles available in North Elba in owner-occupied houses/condos
- 53no vehicle
- 6841 vehicle
- 8372 vehicles
- 1623 vehicles
- 544 vehicles
- 95+ vehicles
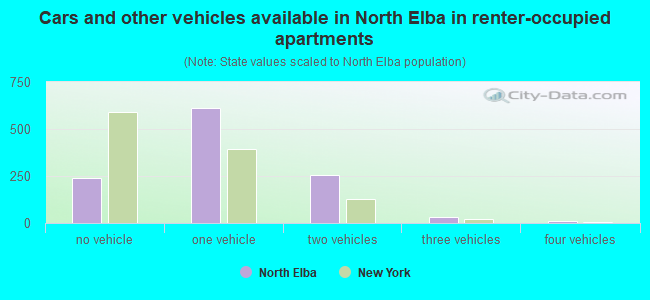
- Cars and other vehicles available in North Elba in renter-occupied apartments
- 237no vehicle
- 6141 vehicle
- 2562 vehicles
- 303 vehicles
- 84 vehicles
- 05+ vehicles
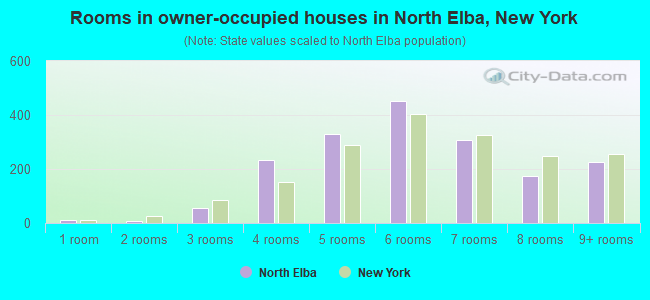
- Rooms in owner-occupied houses in North Elba, New York
- 121 room
- 62 rooms
- 573 rooms
- 2334 rooms
- 3305 rooms
- 4536 rooms
- 3077 rooms
- 1748 rooms
- 2279+ rooms
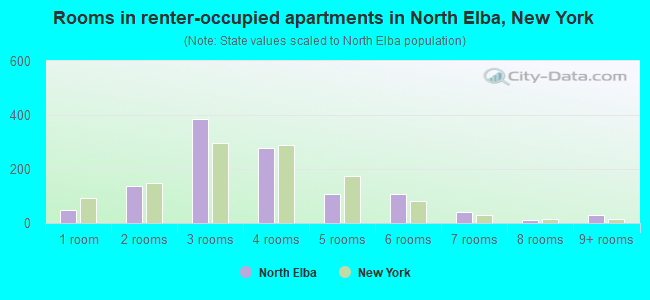
- Rooms in renter-occupied apartments in North Elba, New York
- 501 room
- 1362 rooms
- 3863 rooms
- 2774 rooms
- 1065 rooms
- 1076 rooms
- 417 rooms
- 128 rooms
- 309+ rooms
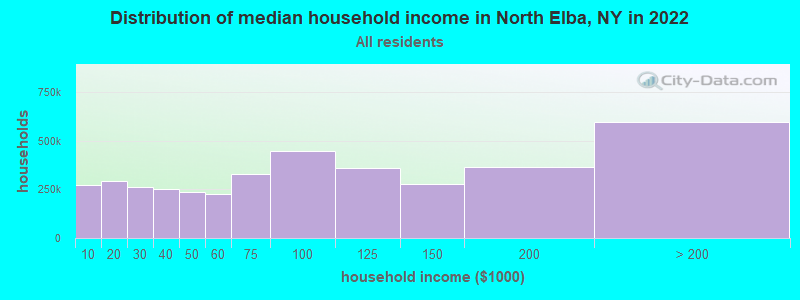
North Elba, NY household income distribution

- 303,046Less than $10,000
- 323,487$10,000 to $19,999
- 288,386$20,000 to $29,999
- 279,618$30,000 to $39,999
- 257,417$40,000 to $49,999
- 248,051$50,000 to $59,999
- 358,308$60,000 to $74,999
- 489,892$75,000 to $99,999
- 395,026$100,000 to $124,999
- 303,240$125,000 to $149,999
- 404,791$150,000 to $199,999
- 663,164$200,000 or more
Percentage of workers working in this county: 82.0%
Number of people working at home: 535 (14.1% of all workers)
Travel time to work (commute)
- Less than 5 minutes: 579
- 5 to 9 minutes: 926
- 10 to 14 minutes: 645
- 15 to 19 minutes: 438
- 20 to 24 minutes: 215
- 25 to 29 minutes: 54
- 30 to 34 minutes: 123
- 35 to 39 minutes: 13
- 40 to 44 minutes: 22
- 45 to 59 minutes: 54
- 60 to 89 minutes: 46
- 90 or more minutes: 35
Means of transportation to work:
- Drove a car alone: 2,414 (72.4%)
- Carpooled: 396 (11.9%)
- Taxi: 40 (1.2%)
- Bicycle: 3 (0.1%)
- Walked: 277 (8.3%)
- Other means: 20 (0.6%)
- Worked at home: 185 (5.5%)
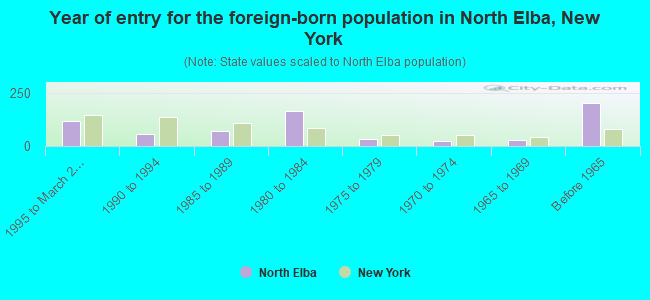
- Year of entry for the foreign-born population in North Elba, New York
- 1191995 to March 2000
- 571990 to 1994
- 711985 to 1989
- 1661980 to 1984
- 331975 to 1979
- 241970 to 1974
- 271965 to 1969
- 202Before 1965
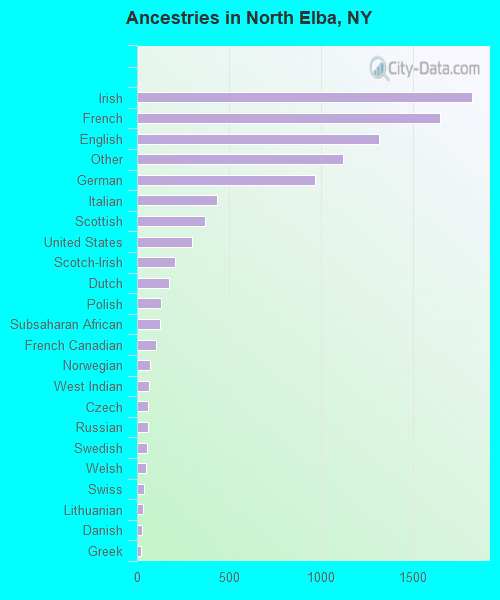
First ancestries reported:
- Irish: 1,823 (19.8%)
- French: 1,646 (17.8%)
- English: 1,317 (14.3%)
- Other: 1,122 (12.2%)
- German: 968 (10.5%)
- Italian: 433 (4.7%)
- Scottish: 371 (4.0%)
- United States: 300 (3.3%)
- Scotch-Irish: 209 (2.3%)
- Dutch: 174 (1.9%)
- Polish: 129 (1.4%)
- Subsaharan African: 123 (1.3%)
- French Canadian: 101 (1.1%)
- Norwegian: 68 (0.7%)
- West Indian: 63 (0.7%)
- Czech: 61 (0.7%)
- Russian: 59 (0.6%)
- Swedish: 55 (0.6%)
- Welsh: 50 (0.5%)
- Swiss: 38 (0.4%)
- Lithuanian: 34 (0.4%)
- Danish: 25 (0.3%)
- Greek: 21 (0.2%)
- Hungarian: 16 (0.2%)
- Ukrainian: 13 (0.1%)
- Portuguese: 6 (0.07%)
Most common places of birth for foreign-born residents (%):
| North Elba: | 14.6% (102) |
| New York: | 10.5% (408,086) |
| North Elba: | 10.6% (74) |
| New York: | 1.8% (69,327) |
| North Elba: | 8.2% (57) |
| New York: | 5.9% (226,470) |
| North Elba: | 7.7% (54) |
| New York: | 1.4% (54,876) |
| North Elba: | 4.9% (34) |
| New York: | 2.9% (111,727) |
| North Elba: | 4.7% (33) |
| New York: | 0.7% (25,688) |
| North Elba: | 4.3% (30) |
| New York: | 1.9% (72,408) |
| North Elba: | 3.4% (24) |
| New York: | 6.0% (233,766) |
| North Elba: | 3.0% (21) |
| New York: | 4.2% (161,189) |
| North Elba: | 2.4% (17) |
| New York: | 2.4% (94,595) |
| North Elba: | 2.4% (17) |
| New York: | 0.3% (10,672) |
| North Elba: | 2.4% (17) |
| New York: | 1.6% (62,237) |
| North Elba: | 2.3% (16) |
| New York: | 0.7% (26,202) |
| North Elba: | 2.1% (15) |
| New York: | 2.5% (98,473) |
| North Elba: | 2.0% (14) |
| New York: | 0.9% (36,642) |
| North Elba: | 2.0% (14) |
| New York: | 0.2% (7,433) |
| North Elba: | 1.9% (13) |
| New York: | 0.3% (13,246) |
| North Elba: | 1.9% (13) |
| New York: | 2.0% (76,977) |
Place of birth for U.S.-born residents:
- This state: 6,109
- Other state: 1,681
- Northeast: 706
- Midwest: 546
- South: 289
- West: 140
47% of North Elba residents lived in the same house 5 years ago.
Out of people who lived in different houses, 31% lived in this county.
Out of people who lived in different counties, 68% lived in New York.
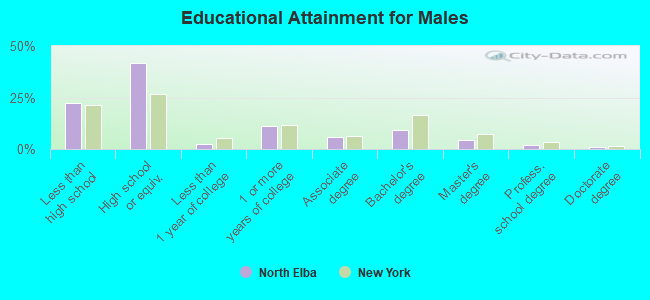
Education attainment for males 25 years and older:
- No schooling: 29
- Nursery to 4th grade: 0
- 5th and 6th grade: 18
- 7th and 8th grade: 150
- 9th grade: 174
- 10th grade: 171
- 11th grade: 192
- 12th grade, no diploma: 156
- High school graduate (or equivalency): 1,666
- Less than 1 year of college: 92
- Some college more than 1 year, no degree: 446
- Associate degree: 227
- Bachelor's degree: 358
- Master's degree: 183
- Professional school degree: 87
- Doctorate degree: 34
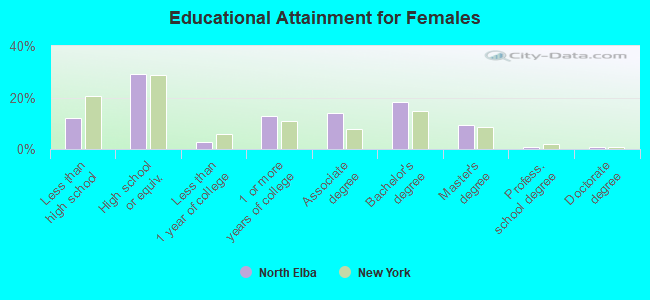
Education attainment for females 25 years and older:
- No schooling: 0
- Nursery to 4th grade: 5
- 5th and 6th grade: 14
- 7th and 8th grade: 44
- 9th grade: 39
- 10th grade: 71
- 11th grade: 50
- 12th grade, no diploma: 79
- High school graduate (or equivalency): 735
- Less than 1 year of college: 64
- Some college more than 1 year, no degree: 326
- Associate degree: 354
- Bachelor's degree: 458
- Master's degree: 230
- Professional school degree: 18
- Doctorate degree: 21


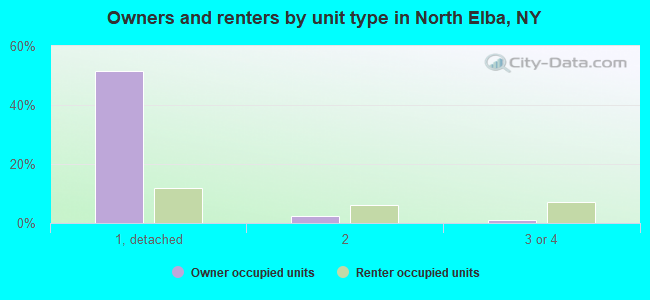
Housing units in structures:
- One, detached: 2,400
- One, attached: 96
- Two: 340
- 3 or 4: 317
- 5 to 9: 300
- 10 to 19: 149
- 20 to 49: 75
- 50 or more: 139
- Mobile homes: 175
Median worth of mobile homes: $20,859
Housing units lacking complete kitchen facilities: 3.9%
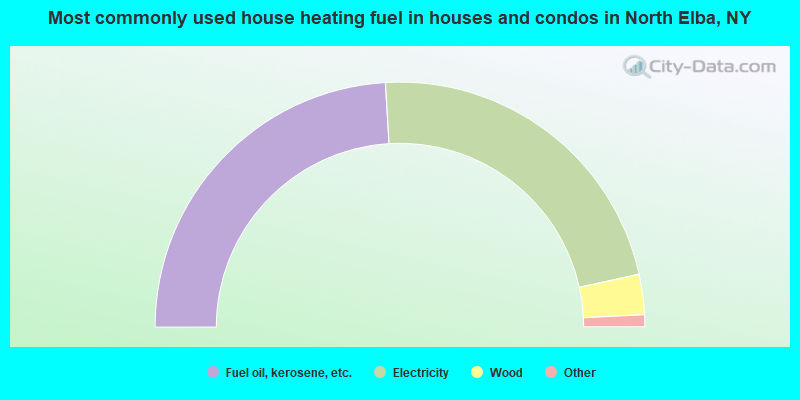
- 48.1%Fuel oil, kerosene, etc.
- 45.0%Electricity
- 5.3%Wood
- 1.3%Bottled, tank, or LP gas
- 0.2%No fuel used
- 0.1%Utility gas
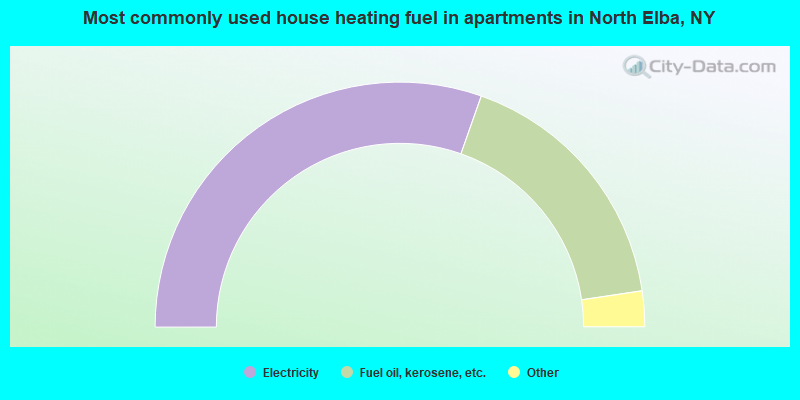
- 60.8%Electricity
- 34.5%Fuel oil, kerosene, etc.
- 3.1%Bottled, tank, or LP gas
- 1.0%Wood
- 0.6%Utility gas
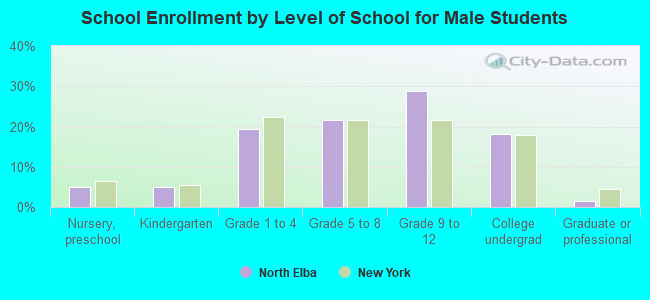
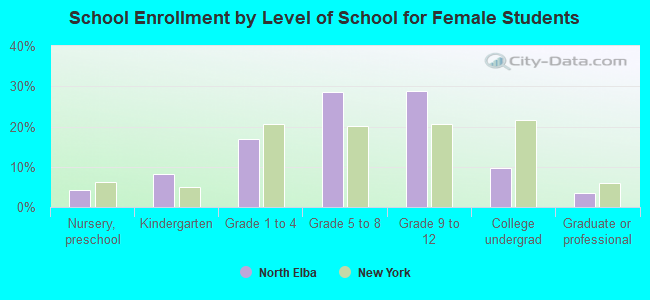
Private vs. public school enrollment:
| Here: | 13.1% |
| New York: | 14.0% |
| Here: | 9.3% |
| New York: | 13.2% |
| Here: | 4.4% |
| New York: | 38.2% |