Housing density: 2,313 houses/condos per square mile
Median price asked for vacant for-sale houses and condos in 2022 in this county: $1,279,555.
Median contract rent in 2022: over $2,000 (lower quartile is $1,744, upper quartile is over $2,000)
Median rent asked for vacant for-rent units in 2022: $2,539
Median gross rent in North Coast, CA in 2022: over $2,000
Housing units in North Coast with a mortgage: 55,188 (7,643 second mortgage, 6,297 home equity loan, 282 both second mortgage and home equity loan) Houses without a mortgage: 13,396
Compare current foreclosures near North Coast, CA:
In family households: 2,574,637 (510,612 male householders, 197,879 female householders)
538,268 spouses, 917,395 children (868,578 natural, 16,498 adopted, 32,319 stepchildren), 67,543 grandchildren, 54,495 brothers or sisters, 47,670 parents, foster children, 85,984 other relatives, 117,563 non-relatives
In nonfamily households: 396,359 (130,596 male householders (87,348 living alone)), 153,694 female householders (120,501 living alone)), 112,069 nonrelatives
In group quarters: 39,236 (14,531 institutionalized population)
546,370 married couples with children.
125,951 single-parent households (34,925 men, 91,026 women).
67.6% of residents of North Coast speak English at home.
11.5% of residents speak Spanish at home (49% speak English very well, 21% speak English well, 20% speak English not well, 10% don't speak English at all).
3.6% of residents speak other Indo-European language at home (72% speak English very well, 19% speak English well, 7% speak English not well, 2% don't speak English at all).
16.4% of residents speak Asian or Pacific Island language at home (37% speak English very well, 33% speak English well, 24% speak English not well, 6% don't speak English at all).
0.9% of residents speak other language at home (72% speak English very well, 19% speak English well, 8% speak English not well, 2% don't speak English at all).
Foreign born population: 101,641 (25.2%)
(82.7% of them are naturalized citizens)
Percentage of workers working in this county: 80.9% Number of people working at home: 38,247 (17.8% of all workers)
Travel time to work (commute)
Less than 5 minutes: 2,963
5 to 9 minutes: 12,903
10 to 14 minutes: 19,315
15 to 19 minutes: 21,971
20 to 24 minutes: 25,760
25 to 29 minutes: 10,825
30 to 34 minutes: 31,375
35 to 39 minutes: 5,855
40 to 44 minutes: 8,921
45 to 59 minutes: 17,122
60 to 89 minutes: 10,600
90 or more minutes: 3,737
Means of transportation to work:
Drove a car alone: 144,965 (81.4%)
Carpooled: 18,978 (10.7%)
Bus or trolley bus: 2,214 (1.2%)
Streetcar or trolley car: 63 (0.0%)
Subway or elevated: 22 (0.0%)
Railroad: 55 (0.0%)
Ferryboat: 26 (0.0%)
Taxi: 28 (0.0%)
Motorcycle: 403 (0.2%)
Bicycle: 1,299 (0.7%)
Walked: 2,531 (1.4%)
Other means: 763 (0.4%)
Worked at home: 6,735 (3.8%)
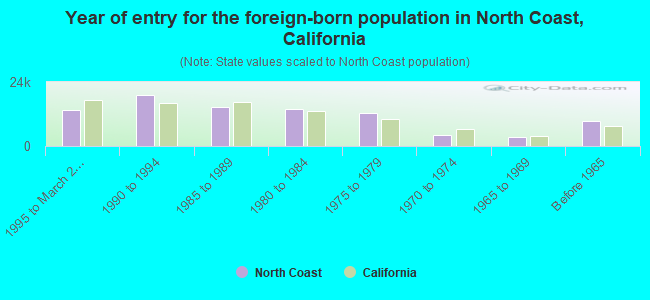
Year of entry for the foreign-born population in North Coast, California
13,4791995 to March 2000
19,1161990 to 1994
14,7971985 to 1989
13,8191980 to 1984
12,3051975 to 1979
4,1091970 to 1974
3,4911965 to 1969
9,520Before 1965
Most common places of birth for foreign-born residents (%):
Vietnam
North Coast:
37.3% (33,792)
California:
4.7% (418,249)
Mexico
North Coast:
22.2% (20,113)
California:
44.3% (3,928,701)
Philippines
North Coast:
3.2% (2,884)
California:
7.5% (664,935)
Korea
North Coast:
3.1% (2,778)
California:
3.0% (268,452)
Canada
North Coast:
3.0% (2,759)
California:
1.6% (141,181)
United Kingdom
North Coast:
2.3% (2,084)
California:
1.5% (133,090)
Taiwan
North Coast:
2.3% (2,082)
California:
1.7% (151,775)
China, excluding Hong Kong and Taiwan
North Coast:
2.0% (1,808)
California:
3.7% (327,611)
Japan
North Coast:
1.8% (1,613)
California:
1.3% (112,212)
Germany
North Coast:
1.7% (1,558)
California:
1.1% (98,160)
India
North Coast:
1.6% (1,434)
California:
2.2% (198,201)
Place of birth for U.S.-born residents:
This state: 172,747
Other state: 96,537
Northeast: 23,739
Midwest: 37,320
South: 18,726
West: 16,752
54% of North Coast residents lived in the same house 5 years ago. Out of people who lived in different houses, 68% lived in this county. Out of people who lived in different counties, 69% lived in California.
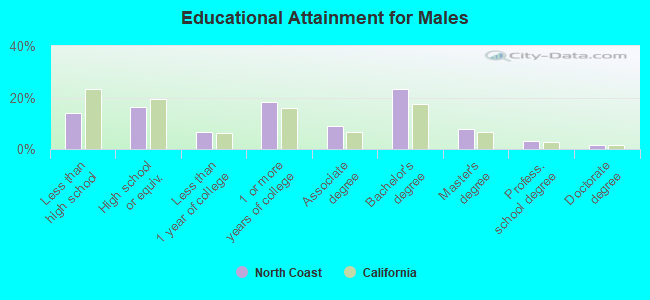
Education attainment for males 25 years and older:
No schooling: 2,092
Nursery to 4th grade: 631
5th and 6th grade: 2,075
7th and 8th grade: 1,755
9th grade: 1,933
10th grade: 1,751
11th grade: 1,852
12th grade, no diploma: 5,039
High school graduate (or equivalency): 19,926
Less than 1 year of college: 8,225
Some college more than 1 year, no degree: 22,495
Associate degree: 10,773
Bachelor's degree: 28,355
Master's degree: 9,642
Professional school degree: 3,819
Doctorate degree: 1,706
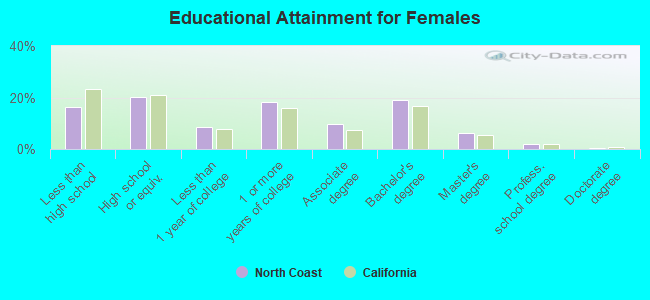
Education attainment for females 25 years and older:
No schooling: 2,888
Nursery to 4th grade: 1,105
5th and 6th grade: 2,406
7th and 8th grade: 2,229
9th grade: 2,401
10th grade: 2,226
11th grade: 2,299
12th grade, no diploma: 5,270
High school graduate (or equivalency): 25,864
Less than 1 year of college: 11,144
Some college more than 1 year, no degree: 23,481
Associate degree: 12,460
Bachelor's degree: 24,355
Master's degree: 7,905
Professional school degree: 2,259
Doctorate degree: 691
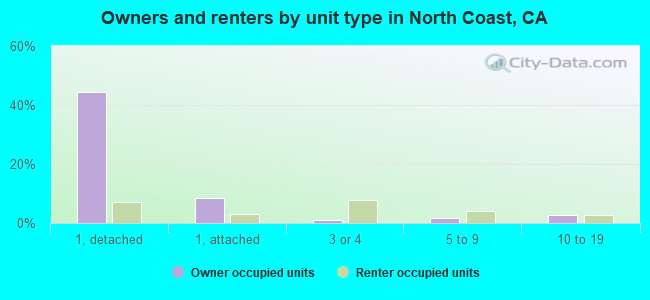
Housing units in structures:
One, detached: 69,723
One, attached: 16,246
Two: 2,048
3 or 4: 12,009
5 to 9: 7,649
10 to 19: 7,646
20 to 49: 3,945
50 or more: 11,300
Mobile homes: 6,705
Boats, RVs, vans, etc.: 179
Median worth of mobile homes: $159,163
Housing units lacking complete plumbing facilities: 0.5%
Housing units lacking complete kitchen facilities: 1.0%