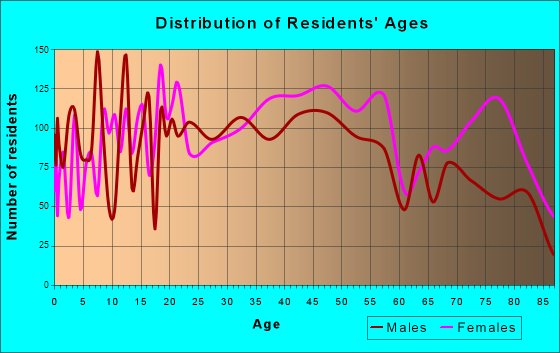
North Canton, OH (Ohio) Houses and Residents
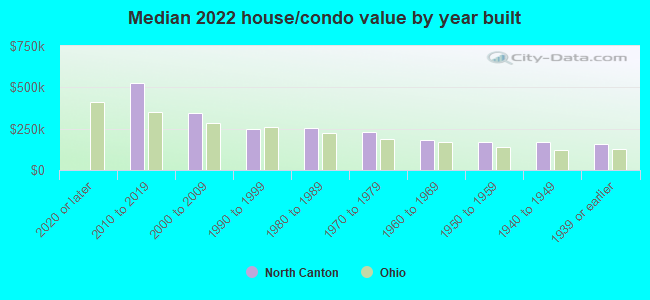
| North Canton: | $192,542 |
| Ohio: | $204,100 |
Mean price in 2022:
Detached houses: $251,146
Here: $251,146 State: $254,366 Townhouses or other attached units: $208,711
Here: $208,711 State: $225,733 In 3-to-4-unit structures: $250,212
Here: $250,212 State: $203,002 Mobile homes: $22,796
Here: $22,796 State: $62,719
Total population: 17,490 (Urban population: 16,381, Rural population: 0)
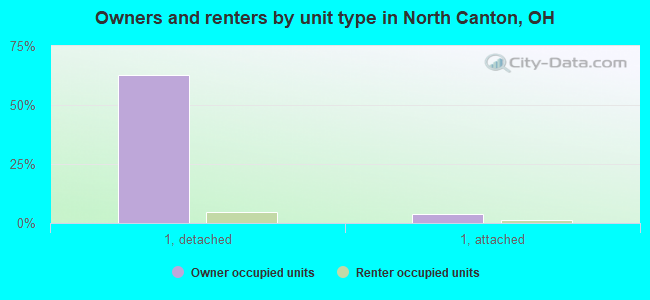
Houses: 8,407 (8,090 occupied: 5,483 owner occupied, 2,582 renter occupied)
| % of renters here: | 32% |
| State: | 33% |
Housing density: 1,385 houses/condos per square mile
Median price asked for vacant for-sale houses and condos in 2022: $980,085.
Median contract rent in 2022: $822 (lower quartile is $672, upper quartile is $958)
Median rent asked for vacant for-rent units in 2022: $1,034
Median gross rent in North Canton, OH in 2022: $937
Housing units in North Canton with a mortgage: 3,101 (427 second mortgage, 15 home equity loan, 342 both second mortgage and home equity loan)
Houses without a mortgage: 167
Median household income for houses/condos with a mortgage: $88,840
Median household income for apartments without a mortgage: $71,695
Median monthly housing costs: $922
Compare current foreclosures near North Canton, OH:
| Photo | Address | Area | Beds / Baths | Price | Details |
|---|---|---|---|---|---|

|
#1
Brown St
Akron, OH 44311
|
2,132 sq. feet
|
4 baths 4 beds |
$27,500
|
show details |

|
#2
S Mckinley Ave
Alliance, OH 44601
|
2,404 sq. feet
|
1 baths 5 beds |
$79,900
|
show details |

|
#3
Tremont Ave SW
Massillon, OH 44647
|
1,344 sq. feet
|
1 baths 3 beds |
$164,900
|
show details |

|
#4
19th St SW
Akron, OH 44314
|
1,105 sq. feet
|
1 baths 3 beds |
$139,500
|
show details |

|
#5
11th St SE
Massillon, OH 44646
|
1,232 sq. feet
|
1 baths 2 beds |
$26,500
|
show details |

|
#6
38th St NW
Canton, OH 44709
|
1,056 sq. feet
|
1 baths 3 beds |
$149,900
|
show details |

|
#7
Broadview Rd
Tallmadge, OH 44278
|
1,243 sq. feet
|
1 baths 3 beds |
$63,500
|
show details |

|
#8
19th St NE
Canton, OH 44714
|
1,372 sq. feet
|
2 baths 3 beds |
$7,500
|
show details |

|
#9
Daleford Ave NE
Canton, OH 44705
|
1,463 sq. feet
|
1 baths 3 beds |
$159,900
|
show details |

|
#10
Mangold St
Akron, OH 44311
|
864 sq. feet
|
1 baths 2 beds |
$8,900
|
show details |
| Photo | Address | Area | Beds / Baths | Price | Details |
|---|---|---|---|---|---|

|
#11
Allyn St
Akron, OH 44311
|
1,334 sq. feet
|
1 baths 3 beds |
$25,900
|
show details |

|
#12
Ellis Ave NE
Canton, OH 44705
|
960 sq. feet
|
1 baths 3 beds |
$19,900
|
show details |

|
#13
49th St NE
Canton, OH 44705
|
1,146 sq. feet
|
1 baths 2 beds |
$84,900
|
show details |

|
#14
Madison Ave
Akron, OH 44320
|
2,082 sq. feet
|
2 baths 4 beds |
$27,900
|
show details |

|
#15
Virginia St SE
Massillon, OH 44646
|
1,809 sq. feet
|
2 baths 3 beds |
show details | |

|
#16
Manchester Rd
Akron, OH 44314
|
1,368 sq. feet
|
1 baths 3 beds |
show details | |

|
#17
Mercer Ave
Akron, OH 44320
|
1,040 sq. feet
|
2 baths 3 beds |
show details | |

|
#18
Elson Ave
Barberton, OH 44203
|
1,509 sq. feet
|
1 baths 2 beds |
show details | |

|
#19
Santee Ave
Akron, OH 44306
|
1,224 sq. feet
|
1 baths 3 beds |
show details | |

|
#20
Louise St
Mogadore, OH 44260
|
1,092 sq. feet
|
1 baths 3 beds |
show details |
| Photo | Address | Area | Beds / Baths | Price | Details |
|---|---|---|---|---|---|

|
#21
Market Ave N
Canton, OH 44714
|
3,360 sq. feet
|
5 baths 5 beds |
show details | |

|
#22
18th St NW
Canton, OH 44703
|
1,750 sq. feet
|
3 baths 4 beds |
show details | |

|
#23
Charles Ave
Barberton, OH 44203
|
1,336 sq. feet
|
1 baths 3 beds |
show details | |

|
#24
Hillsdale Ave
Barberton, OH 44203
|
1,238 sq. feet
|
2 baths 3 beds |
show details | |

|
#25
Drenta Cir SW
Navarre, OH 44662
|
1,536 sq. feet
|
2 baths 3 beds |
show details | |

|
#26
E Gorgas St
Louisville, OH 44641
|
924 sq. feet
|
2 baths 3 beds |
show details | |

|
#27
21st St NW
Canton, OH 44709
|
5,334 sq. feet
|
4 baths 5 beds |
show details | |

|
#28
Arnold Ave
Akron, OH 44305
|
960 sq. feet
|
1 baths 3 beds |
show details | |

|
#29
Navarre Rd SW
Canton, OH 44706
|
1,594 sq. feet
|
1 baths 3 beds |
show details | |

|
#30
E Waterloo Rd
Akron, OH 44312
|
792 sq. feet
|
1 baths 2 beds |
show details |
| Photo | Address | Area | Beds / Baths | Price | Details |
|---|---|---|---|---|---|

|
#31
N Walnut St
Louisville, OH 44641
|
1,668 sq. feet
|
1 baths 3 beds |
show details | |

|
#32
Wellman Ave SE
Massillon, OH 44646
|
- sq. feet
|
- baths - beds |
$7,900
|
show details |

|
#33
Chandler Ave
Akron, OH 44314
|
1,176 sq. feet
|
1 baths 3 beds |
show details | |

|
#34
Roslyn Ave SW
Canton, OH 44710
|
1,239 sq. feet
|
1 baths 3 beds |
show details | |

|
#35
Engle Pl SW
Canton, OH 44710
|
1,308 sq. feet
|
1 baths 3 beds |
show details | |

|
#36
Massillon Rd
Akron, OH 44312
|
2,986 sq. feet
|
2 baths 4 beds |
show details | |

|
#37
Woodland Pl
Akron, OH 44312
|
1,278 sq. feet
|
2 baths 3 beds |
show details | |

|
#38
7th St SW
Massillon, OH 44647
|
1,246 sq. feet
|
1 baths 2 beds |
show details | |

|
#39
Reed Ave
Akron, OH 44306
|
864 sq. feet
|
2 baths 2 beds |
show details | |

|
#40
Crestview Ave
Alliance, OH 44601
|
1,762 sq. feet
|
3 baths 4 beds |
show details |
| Photo | Address | Area | Beds / Baths | Price | Details |
|---|---|---|---|---|---|

|
#41
Killinger Rd
Clinton, OH 44216
|
1,198 sq. feet
|
1 baths 3 beds |
show details | |

|
#42
Onahom Cir NE
Canton, OH 44705
|
1,107 sq. feet
|
1 baths 3 beds |
show details | |

|
#43
Lamont St
Akron, OH 44305
|
1,300 sq. feet
|
2 baths 3 beds |
show details | |

|
#44
Parker Ave NE
Canton, OH 44704
|
916 sq. feet
|
1 baths 2 beds |
show details | |

|
#45
Lakewood Blvd
Akron, OH 44314
|
1,056 sq. feet
|
1 baths 3 beds |
show details | |

|
#46
Larkin Ave
Akron, OH 44305
|
1,075 sq. feet
|
1 baths 3 beds |
show details | |

|
#47
Superior Ave
Akron, OH 44307
|
1,250 sq. feet
|
1 baths 3 beds |
show details | |

|
#48
5th St NE
Barberton, OH 44203
|
819 sq. feet
|
2 baths 2 beds |
show details | |

|
#49
Franklin Rd NE
Massillon, OH 44646
|
1,092 sq. feet
|
1 baths 3 beds |
show details | |

|
Check over 1 million property listings on Foreclosure.com!
|
browse all offers | |||


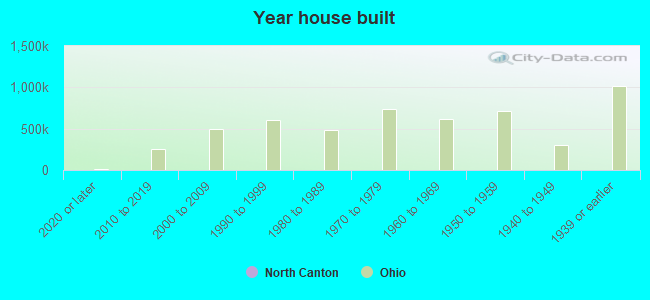
Median year apartment built: 1978
Household type by relationship:
Households: 17,699- Male householders: 3,654 (1,225 living alone), Female householders: 4,357 (1,945 living alone)
3,398 spouses (3,369 opposite-sex spouses), 762 unmarried partners, (738 opposite-sex unmarried partners), 3,725 children (3,590 natural, 35 adopted, 99 stepchildren), 101 grandchildren, 64 brothers or sisters, 35 parents, 0 foster children, 153 other relatives, 203 non-relatives
- In group quarters: 1,240
Size of family households: 2,354 2-persons, 898 3-persons, 610 4-persons, 268 5-persons, 86 6-persons, 43 7-or-more-persons.
Size of nonfamily households: 3,205 1-person, 567 2-persons, 12 3-persons.
1,888 married couples with children.
838 single-parent households (301 men, 537 women).
96.5% of residents of North Canton speak English at home.
0.7% of residents speak Spanish at home (53% speak English very well, 30% speak English well, 17% speak English not well).
1.6% of residents speak other Indo-European language at home (70% speak English very well, 18% speak English well, 12% speak English not well).
1.2% of residents speak Asian or Pacific Island language at home (72% speak English very well, 17% speak English not well, 10% don't speak English at all).
0.1% of residents speak other language at home (100% speak English not well).
Foreign born population: 320 (1.8%)
(78.4% of them are naturalized citizens)
| Here: | 6.9 |
| State: | 6.7 |
| Here: | 4.4 |
| State: | 4.4 |
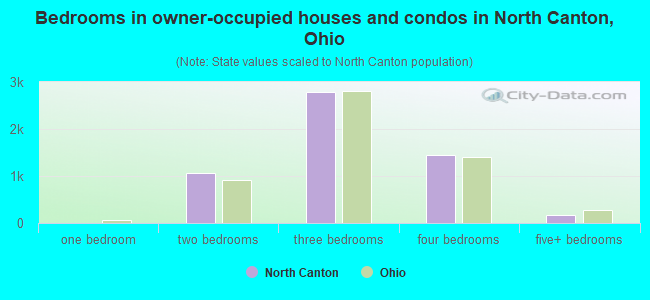
- Bedrooms in owner-occupied houses and condos in North Canton, Ohio
- 0no bedroom
- 01 bedroom
- 1,0682 bedrooms
- 2,7913 bedrooms
- 1,4454 bedrooms
- 1805+ bedrooms
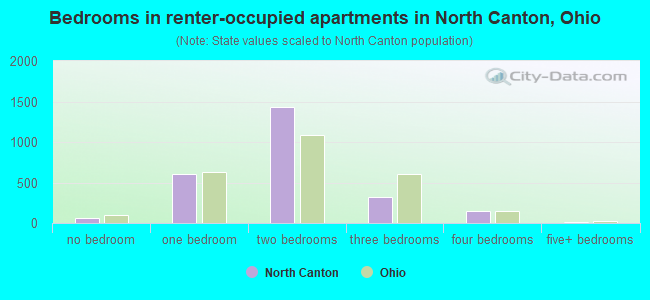
- Bedrooms in renter-occupied apartments in North Canton, Ohio
- 60no bedroom
- 6091 bedroom
- 1,4312 bedrooms
- 3263 bedrooms
- 1464 bedrooms
- 105+ bedrooms
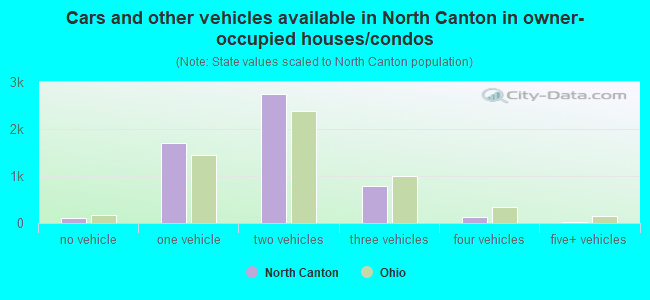
- Cars and other vehicles available in North Canton in owner-occupied houses/condos
- 110no vehicle
- 1,6961 vehicle
- 2,7432 vehicles
- 7773 vehicles
- 1324 vehicles
- 255+ vehicles
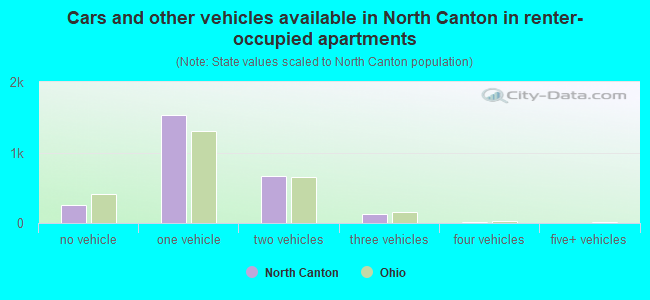
- Cars and other vehicles available in North Canton in renter-occupied apartments
- 250no vehicle
- 1,5321 vehicle
- 6602 vehicles
- 1273 vehicles
- 144 vehicles
- 05+ vehicles
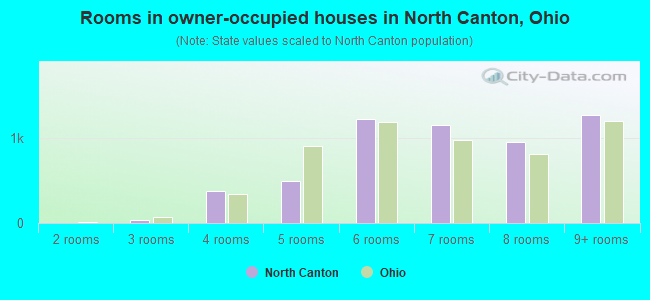
- Rooms in owner-occupied houses in North Canton, Ohio
- 01 room
- 02 rooms
- 383 rooms
- 3734 rooms
- 4955 rooms
- 1,2166 rooms
- 1,1477 rooms
- 9508 rooms
- 1,2649+ rooms
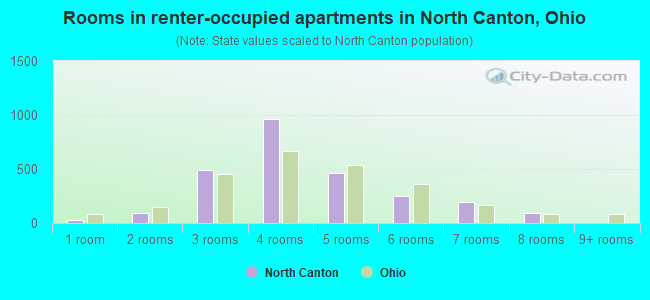
- Rooms in renter-occupied apartments in North Canton, Ohio
- 301 room
- 932 rooms
- 4913 rooms
- 9604 rooms
- 4595 rooms
- 2506 rooms
- 1997 rooms
- 978 rooms
- 29+ rooms
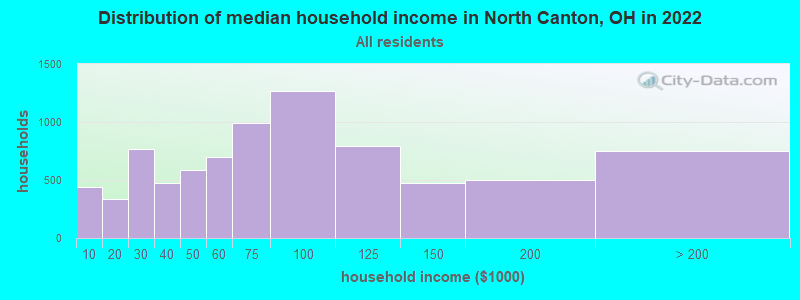
North Canton, OH household income distribution

- 437Less than $10,000
- 338$10,000 to $19,999
- 769$20,000 to $29,999
- 478$30,000 to $39,999
- 590$40,000 to $49,999
- 694$50,000 to $59,999
- 991$60,000 to $74,999
- 1,263$75,000 to $99,999
- 792$100,000 to $124,999
- 470$125,000 to $149,999
- 500$150,000 to $199,999
- 747$200,000 or more
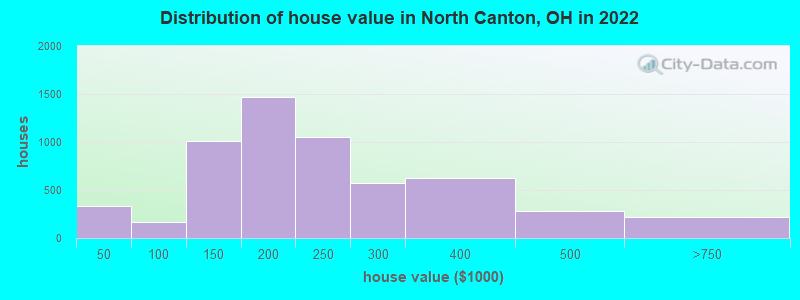
Home value of owner - occupied houses in 2022 in North Canton, OH
-
- 7Less than $10,000
- 234$10,000 to $14,999
- 30$15,000 to $19,999
- 12$20,000 to $24,999
- 28$30,000 to $34,999
- 19$40,000 to $49,999
- 13$50,000 to $59,999
- 18$70,000 to $79,999
- 42$80,000 to $89,999
- 73$90,000 to $99,999
- 381$100,000 to $124,999
- 626$125,000 to $149,999
- 1,064$150,000 to $174,999
- 403$175,000 to $199,999
- 1,056$200,000 to $249,999
- 574$250,000 to $299,999
- 624$300,000 to $399,999
- 284$400,000 to $499,999
- 201$500,000 to $749,999
- 12$750,000 to $999,999
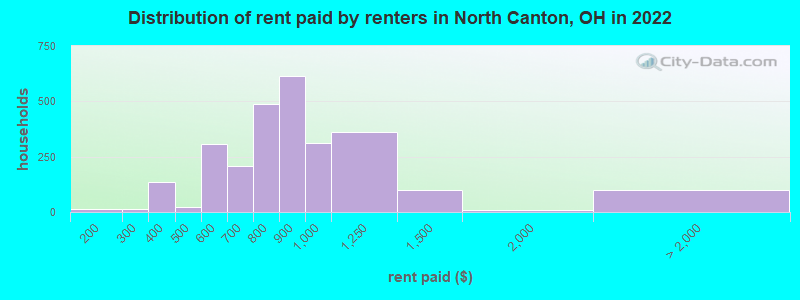
Rent paid by renters in 2022 in North Canton, OH
-
- 11$150 to $199
- 15$250 to $299
- 135$350 to $399
- 21$400 to $449
- 204$500 to $549
- 99$550 to $599
- 56$600 to $649
- 148$650 to $699
- 149$700 to $749
- 338$750 to $799
- 615$800 to $899
- 310$900 to $999
- 362$1,000 to $1,249
- 101$1,250 to $1,499
- 8$1,500 to $1,999
- 9$2,000 to $2,499
- 9$2,500 to $2,999
- 20$3,000 to $3,499
- 60No cash rent
Percentage of workers working in this county: 77.5%
Number of people working at home: 1,810 (19.4% of all workers)
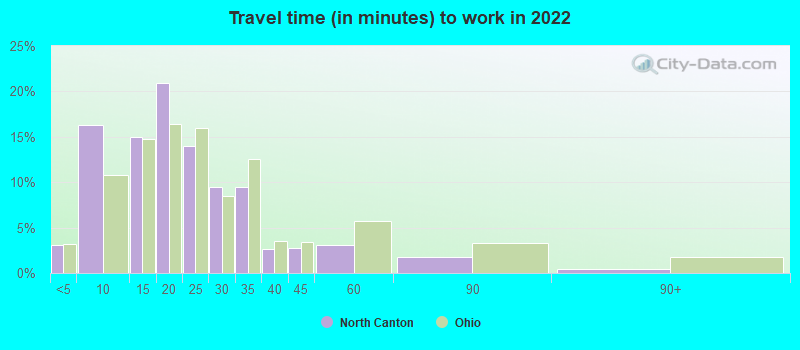
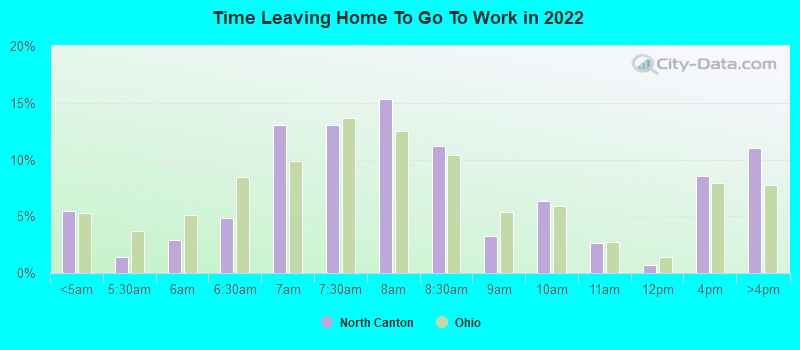
Travel time to work (commute)
- Less than 5 minutes: 202
- 5 to 9 minutes: 1,271
- 10 to 14 minutes: 1,407
- 15 to 19 minutes: 1,443
- 20 to 24 minutes: 1,040
- 25 to 29 minutes: 591
- 30 to 34 minutes: 638
- 35 to 39 minutes: 351
- 40 to 44 minutes: 148
- 45 to 59 minutes: 304
- 60 to 89 minutes: 104
- 90 or more minutes: 81
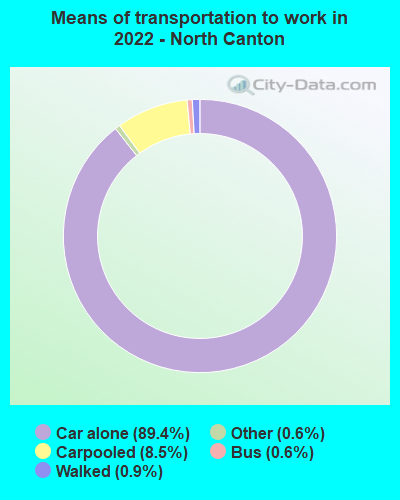
Means of transportation to work:
- Drove a car alone: 6,857 (72.9%)
- Carpooled: 695 (7.4%)
- Bus: 27 (0.3%)
- Taxi: 71 (0.8%)
- Walked: 57 (0.6%)
- Worked at home: 1,810 (19.2%)
- Unemployment by race in 2022
- Unemployment rate for White non-Hispanic residents
- 1.9%Males
- 2.0%Females
- Unemployment rate for other race residents
- 3.7%Females
- Unemployment rate for Hispanic or Latino residents
- 2.4%Females
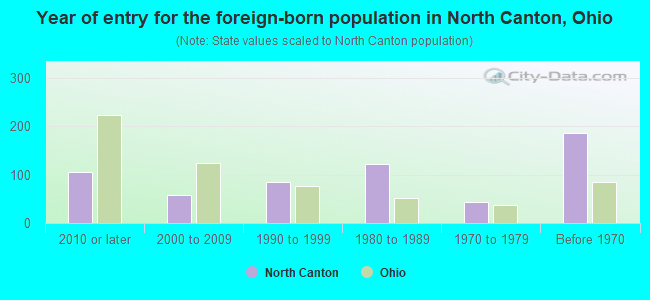
- Year of entry for the foreign-born population in North Canton, Ohio
- 1052010 or later
- 572000 to 2009
- 851990 to 1999
- 1221980 to 1989
- 431970 to 1979
- 186Before 1970
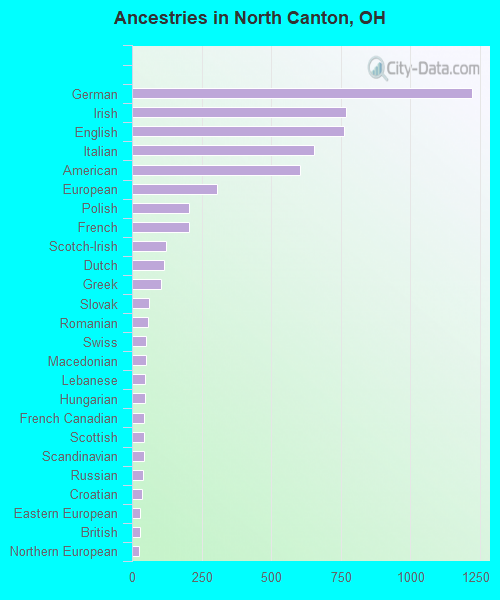
First ancestries reported:
- German: 1,221 (17.7%)
- Irish: 768 (11.2%)
- English: 761 (11.1%)
- Italian: 653 (9.5%)
- American: 602 (8.7%)
- European: 306 (4.4%)
- Polish: 206 (3.0%)
- French: 203 (2.9%)
- Scotch-Irish: 122 (1.8%)
- Dutch: 116 (1.7%)
- Greek: 103 (1.5%)
- Slovak: 61 (0.9%)
- Romanian: 59 (0.9%)
- Swiss: 52 (0.8%)
- Macedonian: 49 (0.7%)
- Lebanese: 47 (0.7%)
- Hungarian: 45 (0.7%)
- French Canadian: 44 (0.6%)
- Scottish: 44 (0.6%)
- Scandinavian: 43 (0.6%)
- Russian: 41 (0.6%)
- Croatian: 37 (0.5%)
- Eastern European: 28 (0.4%)
- British: 27 (0.4%)
- Northern European: 25 (0.4%)
- Swedish: 24 (0.3%)
- Jordanian: 15 (0.2%)
- Czechoslovakian: 15 (0.2%)
- Nigerian: 14 (0.2%)
- Slavic: 11 (0.2%)
- Syrian: 11 (0.2%)
- Austrian: 9 (0.1%)
- Pennsylvania German: 8 (0.1%)
- Welsh: 6 (0.09%)
- Finnish: 2 (0.03%)
Most common places of birth for foreign-born residents (%):
| North Canton: | 21.2% (74) |
| Ohio: | 6.2% (35,703) |
| North Canton: | 8.9% (31) |
| Ohio: | 1.5% (8,452) |
| North Canton: | 7.4% (26) |
| Ohio: | 1.0% (5,444) |
| North Canton: | 7.2% (25) |
| Ohio: | 2.2% (12,846) |
| North Canton: | 5.4% (19) |
| Ohio: | 0.8% (4,309) |
| North Canton: | 5.2% (18) |
| Ohio: | 0.2% (1,424) |
| North Canton: | 4.3% (15) |
| Ohio: | 2.6% (14,988) |
| North Canton: | 4.0% (14) |
| Ohio: | 1.0% (5,979) |
| North Canton: | 3.4% (12) |
| Ohio: | 1.2% (7,029) |
| North Canton: | 3.2% (11) |
| Ohio: | 0.7% (3,842) |
| North Canton: | 3.2% (11) |
| Ohio: | 0.4% (2,185) |
| North Canton: | 3.2% (11) |
| Ohio: | 1.6% (9,312) |
| North Canton: | 3.2% (11) |
| Ohio: | 0.2% (1,224) |
| North Canton: | 2.9% (10) |
| Ohio: | 7.8% (44,796) |
| North Canton: | 2.3% (8) |
| Ohio: | 0.8% (4,490) |
| North Canton: | 2.0% (7) |
| Ohio: | 11.6% (66,525) |
| North Canton: | 1.7% (6) |
| Ohio: | 1.9% (10,960) |
Place of birth for U.S.-born residents:
- This state: 14,121
- Other state: 3,040
- Northeast: 1,064
- Midwest: 695
- South: 955
- West: 201
90.1% of North Canton residents lived in the same house 1 years ago.
Out of people who lived in different houses, 30.5% lived in this county.
Out of people who lived in different counties, 82.1% lived in Ohio.
| North Canton: | 90.1% |
| State average: | 87.8% |
Education attainment for males 25 years and older:
- No schooling: 44
- Nursery to 4th grade: 0
- 5th and 6th grade: 0
- 7th and 8th grade: 3
- 9th grade: 42
- 10th grade: 17
- 11th grade: 13
- 12th grade, no diploma: 6
- High school graduate (or equivalency): 1,543
- Less than 1 year of college: 406
- Some college more than 1 year, no degree: 860
- Associate degree: 402
- Bachelor's degree: 1,460
- Master's degree: 660
- Professional school degree: 334
- Doctorate degree: 39

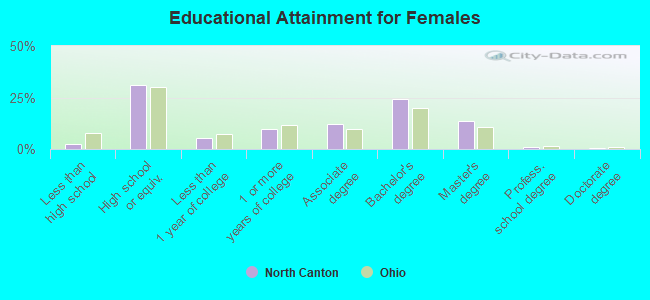
Education attainment for females 25 years and older:
- No schooling: 16
- Nursery to 4th grade: 17
- 5th and 6th grade: 0
- 7th and 8th grade: 28
- 9th grade: 48
- 10th grade: 13
- 11th grade: 9
- 12th grade, no diploma: 40
- High school graduate (or equivalency): 2,220
- Less than 1 year of college: 392
- Some college more than 1 year, no degree: 705
- Associate degree: 869
- Bachelor's degree: 1,751
- Master's degree: 960
- Professional school degree: 71
- Doctorate degree: 20
Housing units in structures:
- One, detached: 5,418
- One, attached: 325
- Two: 292
- 3 or 4: 346
- 5 to 9: 744
- 10 to 19: 552
- 20 to 49: 176
- 50 or more: 273
- Mobile homes: 276
Median worth of mobile homes: $14,723
Housing units lacking complete kitchen facilities in 2022: 1.3%
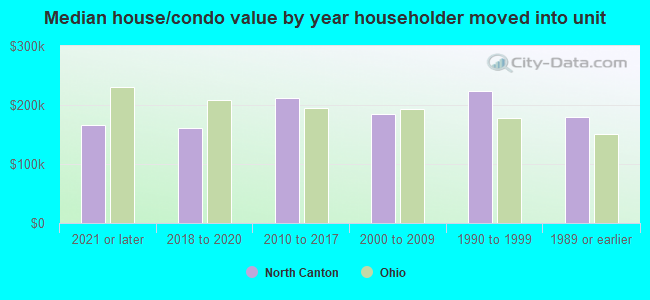
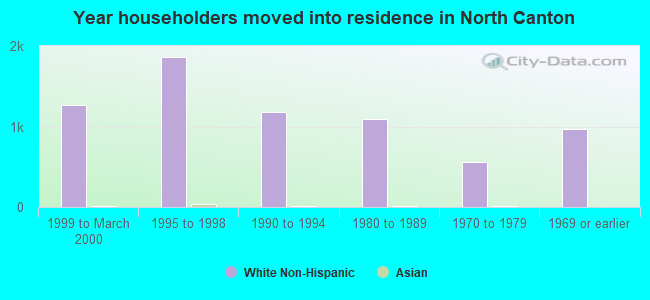
House/condo owner moved in on average 10 years ago
Renter moved in on average 3 years ago
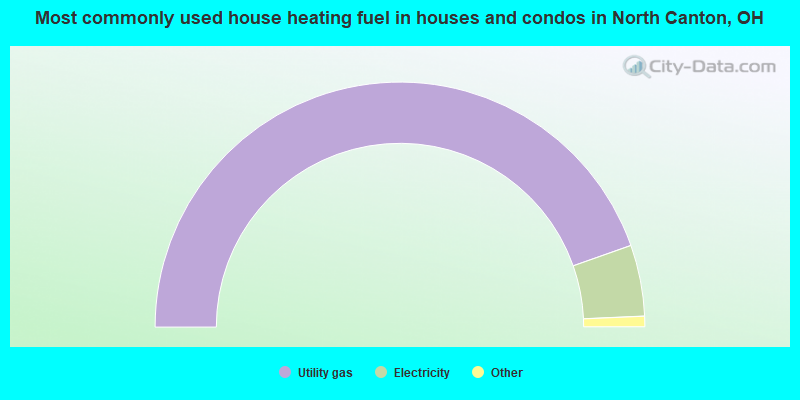
- 89.2%Utility gas
- 9.4%Electricity
- 1.1%Bottled, tank, or LP gas
- 0.3%Fuel oil, kerosene, etc.
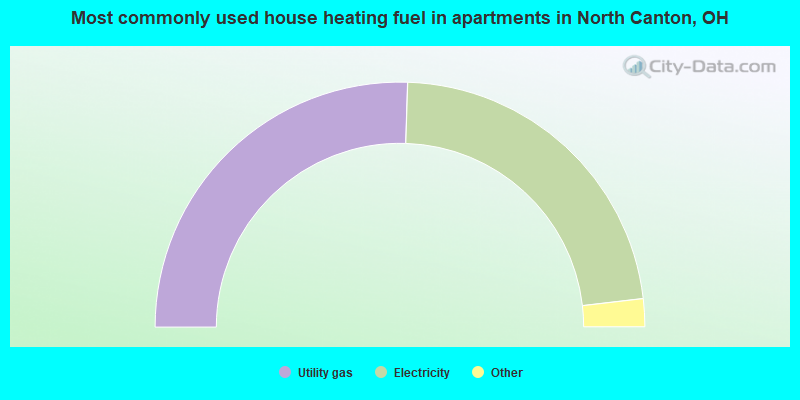
- 51.0%Utility gas
- 45.3%Electricity
- 1.4%No fuel used
- 1.3%Bottled, tank, or LP gas
- 1.0%Other fuel
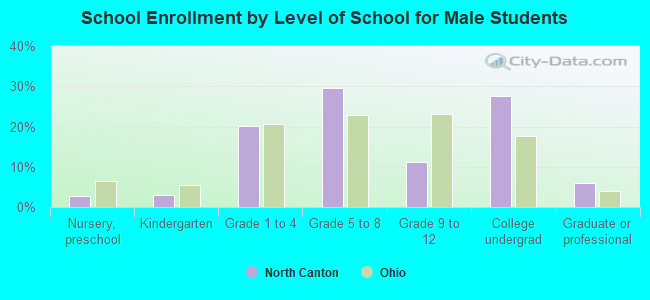
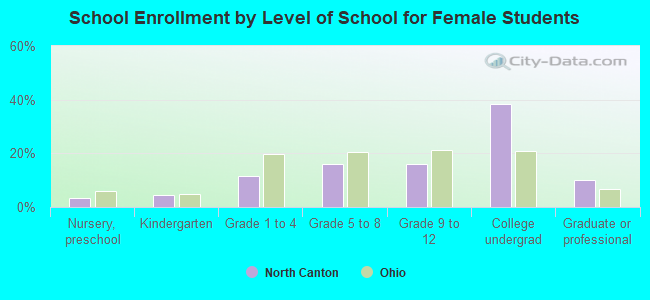
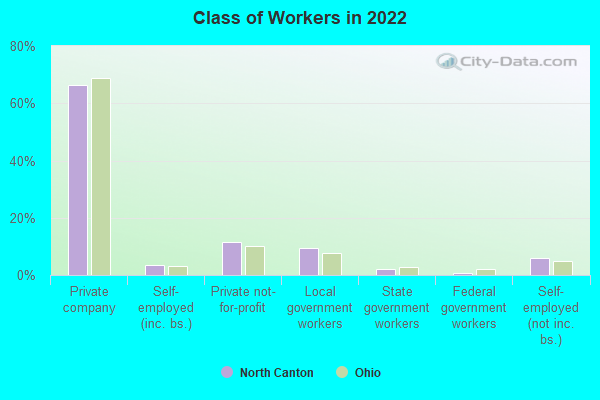
Private vs. public school enrollment:
| Here: | 15.9% |
| Ohio: | 16.0% |
| Here: | 6.0% |
| Ohio: | 13.1% |
| Here: | 60.5% |
| Ohio: | 22.3% |