Nixon, TN (Tennessee) Houses and Residents
| Nixon: | $169,629 |
| Tennessee: | $284,800 |
Total population: 5,643 (Urban population: 681 (all inside urban clusters), Rural population: 4,839 (148 farm, 4,691 nonfarm))
Houses: 2,646 (2,178 occupied: 1,780 owner occupied, 398 renter occupied)
| % of renters here: | 18% |
| State: | 33% |
Housing density: 15 houses/condos per square mile
Median price asked for vacant for-sale houses and condos in 2022 in this county: $3,640,589.
Median contract rent in 2022: $620 (lower quartile is $540, upper quartile is $717)
Median rent asked for vacant for-rent units in 2022: $592
Median gross rent in Nixon, TN in 2022: $823
Housing units in Nixon with a mortgage: 513 (38 second mortgage, 17 home equity loan, 0 both second mortgage and home equity loan)
Houses without a mortgage: 374
Compare current foreclosures near Nixon, TN:
| Photo | Address | Area | Beds / Baths | Price | Details |
|---|---|---|---|---|---|

|
#1
Tommy Sanders Rd
Stantonville, TN 38379
|
2,549 sq. feet
|
2 baths 4 beds |
show details | |

|
#2
Red Sulphur Rd
Counce, TN 38326
|
2,551 sq. feet
|
2 baths 4 beds |
show details | |

|
#3
Pinhook Dr
Savannah, TN 38372
|
2,247 sq. feet
|
2 baths 3 beds |
show details | |

|
#4
Mimirose
Counce, TN 38326
|
2,300 sq. feet
|
2 baths 3 beds |
show details | |

|
#5
Willow St
Savannah, TN 38372
|
1,684 sq. feet
|
1 baths - beds |
show details | |

|
#6
White Oak Cir
Savannah, TN 38372
|
1,445 sq. feet
|
2 baths - beds |
show details | |

|
#7
Stadium Dr
Savannah, TN 38372
|
732 sq. feet
|
1 baths - beds |
show details | |

|
#8
Harbert Dr
Savannah, TN 38372
|
860 sq. feet
|
1 baths - beds |
show details | |

|
#9
Daniel St
Savannah, TN 38372
|
1,276 sq. feet
|
2 baths - beds |
show details | |

|
#10
Park St
Savannah, TN 38372
|
1,659 sq. feet
|
2 baths - beds |
show details |
| Photo | Address | Area | Beds / Baths | Price | Details |
|---|---|---|---|---|---|

|
#11
Ryan St
Savannah, TN 38372
|
1,220 sq. feet
|
1 baths - beds |
show details | |

|
#12
Gin Rd
Michie, TN 38357
|
1,583 sq. feet
|
1 baths - beds |
show details | |

|
#13
Reba Ln
Savannah, TN 38372
|
1,138 sq. feet
|
1 baths - beds |
show details | |

|
#14
Maxie Loop
Savannah, TN 38372
|
1,850 sq. feet
|
2 baths - beds |
show details | |

|
#15
Belmont St
Savannah, TN 38372
|
825 sq. feet
|
1 baths - beds |
show details | |

|
#16
Caney Branch Rd
Adamsville, TN 38310
|
1,152 sq. feet
|
1 baths - beds |
show details | |

|
#17
Peppermint Ln
Savannah, TN 38372
|
1,484 sq. feet
|
1 baths - beds |
show details | |

|
#18
Thomas St
Savannah, TN 38372
|
1,608 sq. feet
|
2 baths - beds |
show details | |

|
#19
Clifton Rd
Savannah, TN 38372
|
1,621 sq. feet
|
1 baths - beds |
show details | |

|
#20
Jones Rd
Savannah, TN 38372
|
1,387 sq. feet
|
2 baths - beds |
show details |
| Photo | Address | Area | Beds / Baths | Price | Details |
|---|---|---|---|---|---|

|
#21
Federal Rd
Counce, TN 38326
|
2,412 sq. feet
|
1 baths - beds |
show details | |

|
#22
Poplar Springs Rd
Savannah, TN 38372
|
873 sq. feet
|
1 baths - beds |
show details | |

|
#23
Poplar Springs Rd
Savannah, TN 38372
|
1,229 sq. feet
|
2 baths - beds |
show details | |

|
#24
Patterson Rd
Savannah, TN 38372
|
2,213 sq. feet
|
2 baths - beds |
show details | |

|
#25
Carver St
Savannah, TN 38372
|
950 sq. feet
|
1 baths - beds |
show details | |

|
#26
Greenwood Ave
Savannah, TN 38372
|
1,188 sq. feet
|
2 baths - beds |
show details | |

|
#27
Clifton Rd
Savannah, TN 38372
|
1,002 sq. feet
|
1 baths - beds |
show details | |

|
#28
County Home Rd
Savannah, TN 38372
|
999 sq. feet
|
1 baths - beds |
show details | |

|
#29
Matrose Carrolls Rd
Michie, TN 38357
|
1,200 sq. feet
|
1 baths - beds |
show details | |

|
#30
Beason Dr
Morris Chapel, TN 38361
|
1,400 sq. feet
|
1 baths - beds |
show details |
| Photo | Address | Area | Beds / Baths | Price | Details |
|---|---|---|---|---|---|

|
#31
Albert Robinson Rd
Selmer, TN 38375
|
1,516 sq. feet
|
2 baths - beds |
show details | |

|
#32
Counce Dr
Savannah, TN 38372
|
1,204 sq. feet
|
2 baths - beds |
show details | |

|
#33
N Elm St
Adamsville, TN 38310
|
1,824 sq. feet
|
1 baths - beds |
show details | |

|
#34
Matrose Carrolls Rd
Michie, TN 38357
|
1,393 sq. feet
|
2 baths - beds |
show details | |

|
#35
Embassy Cv
Savannah, TN 38372
|
1,620 sq. feet
|
2 baths - beds |
show details | |

|
#36
Highway 142
Stantonville, TN 38379
|
1,076 sq. feet
|
1 baths - beds |
show details | |

|
#37
Plainview Dr
Savannah, TN 38372
|
1,570 sq. feet
|
2 baths - beds |
show details | |

|
#38
Hamburg Rd
Michie, TN 38357
|
1,264 sq. feet
|
1 baths - beds |
show details | |

|
#39
Florence Rd
Savannah, TN 38372
|
784 sq. feet
|
1 baths - beds |
show details | |

|
#40
Bensontown Dr
Savannah, TN 38372
|
1,232 sq. feet
|
1 baths - beds |
show details |
| Photo | Address | Area | Beds / Baths | Price | Details |
|---|---|---|---|---|---|

|
#41
Highway 365
Iuka, MS 38852
|
- sq. feet
|
- baths - beds |
show details | |

|
#42
County Road 362
Iuka, MS 38852
|
- sq. feet
|
- baths - beds |
show details | |

|
#43
S Maple St
Adamsville, TN 38310
|
- sq. feet
|
- baths - beds |
show details | |

|
#44
County Road 360
Iuka, MS 38852
|
- sq. feet
|
- baths - beds |
show details | |

|
#45
County Road 274
Iuka, MS 38852
|
- sq. feet
|
- baths - beds |
show details | |

|
#46
Taylor Rd
Michie, TN 38357
|
- sq. feet
|
- baths - beds |
show details | |

|
#47
County Road 3
Waterloo, AL 35677
|
- sq. feet
|
- baths - beds |
show details | |

|
#48
Janey Loop
Savannah, TN 38372
|
- sq. feet
|
- baths - beds |
show details | |

|
#49
Road 431
Iuka, MS 38852
|
- sq. feet
|
- baths - beds |
show details | |

|
Check over 1 million property listings on Foreclosure.com!
|
browse all offers | |||

Household type by relationship:
Households: 25,655- In family households: 21,831 (5,375 male householders, 2,000 female householders)
5,579 spouses, 6,710 children (6,005 natural, 193 adopted, 512 stepchildren), 755 grandchildren, 205 brothers or sisters, 207 parents, foster children, 300 other relatives, 574 non-relatives
- In nonfamily households: 3,824 (1,575 male householders (1,305 living alone)), 1,693 female householders (1,540 living alone)), 556 nonrelatives
- In group quarters: 371 (317 institutionalized population)
4,034 married couples with children.
1,225 single-parent households (307 men, 918 women).
98.7% of residents of Nixon speak English at home.
0.6% of residents speak Spanish at home (23% speak English very well, 29% speak English well, 48% speak English not well).
0.8% of residents speak other Indo-European language at home (74% speak English very well, 26% speak English not well).
Foreign born population: 94 (1.5%)
(43.6% of them are naturalized citizens)
| Here: | 6.2 |
| State: | 6.5 |
| Here: | 4.8 |
| State: | 4.4 |

- Bedrooms in owner-occupied houses and condos in Nixon, Tennessee
- 0no bedroom
- 431 bedroom
- 4092 bedrooms
- 1,1473 bedrooms
- 1394 bedrooms
- 425+ bedrooms

- Bedrooms in renter-occupied apartments in Nixon, Tennessee
- 25no bedroom
- 321 bedroom
- 2052 bedrooms
- 1243 bedrooms
- 124 bedrooms
- 05+ bedrooms

- Cars and other vehicles available in Nixon in owner-occupied houses/condos
- 70no vehicle
- 4581 vehicle
- 7742 vehicles
- 2883 vehicles
- 1404 vehicles
- 505+ vehicles

- Cars and other vehicles available in Nixon in renter-occupied apartments
- 57no vehicle
- 1421 vehicle
- 1492 vehicles
- 403 vehicles
- 104 vehicles
- 05+ vehicles

- Rooms in owner-occupied houses in Nixon, Tennessee
- 01 room
- 92 rooms
- 853 rooms
- 2394 rooms
- 6025 rooms
- 4236 rooms
- 2007 rooms
- 1568 rooms
- 669+ rooms

- Rooms in renter-occupied apartments in Nixon, Tennessee
- 251 room
- 82 rooms
- 403 rooms
- 1564 rooms
- 945 rooms
- 426 rooms
- 337 rooms
- 08 rooms
- 09+ rooms


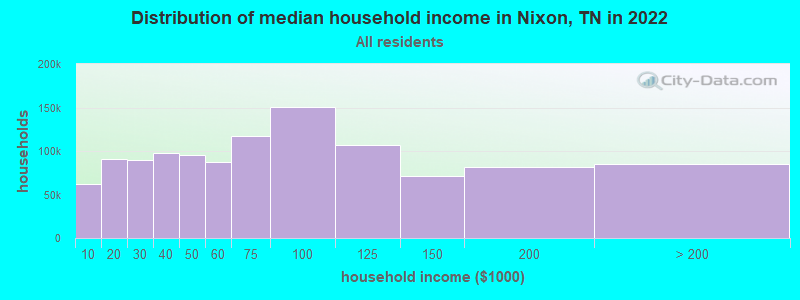
Nixon, TN household income distribution

- 44,393Less than $10,000
- 72,370$10,000 to $19,999
- 69,180$20,000 to $29,999
- 71,699$30,000 to $39,999
- 69,509$40,000 to $49,999
- 64,152$50,000 to $59,999
- 87,219$60,000 to $74,999
- 111,329$75,000 to $99,999
- 82,382$100,000 to $124,999
- 50,285$125,000 to $149,999
- 55,751$150,000 to $199,999
- 49,909$200,000 or more
Percentage of workers working in this county: 73.3%
Number of people working at home: 279 (10.3% of all workers)
Travel time to work (commute)
- Less than 5 minutes: 73
- 5 to 9 minutes: 355
- 10 to 14 minutes: 393
- 15 to 19 minutes: 294
- 20 to 24 minutes: 360
- 25 to 29 minutes: 76
- 30 to 34 minutes: 230
- 35 to 39 minutes: 16
- 40 to 44 minutes: 63
- 45 to 59 minutes: 234
- 60 to 89 minutes: 124
- 90 or more minutes: 69
Means of transportation to work:
- Drove a car alone: 1,923 (81.2%)
- Carpooled: 283 (11.9%)
- Bus or trolley bus: 11 (0.5%)
- Walked: 50 (2.1%)
- Other means: 20 (0.8%)
- Worked at home: 82 (3.5%)


- Year of entry for the foreign-born population in Nixon, Tennessee
- 91995 to March 2000
- 01990 to 1994
- 81985 to 1989
- 01980 to 1984
- 121975 to 1979
- 111970 to 1974
- 01965 to 1969
- 5Before 1965
Most common places of birth for foreign-born residents (%):
| Nixon: | 37.8% (17) |
| Tennessee: | 28.1% (44,682) |
| Nixon: | 26.7% (12) |
| Tennessee: | 4.4% (6,981) |
| Nixon: | 24.4% (11) |
| Tennessee: | 5.2% (8,316) |
| Nixon: | 11.1% (5) |
| Tennessee: | 0.9% (1,381) |
Place of birth for U.S.-born residents:
- This state: 3,766
- Other state: 1,668
- Northeast: 57
- Midwest: 463
- South: 1,117
- West: 31
65% of Nixon residents lived in the same house 5 years ago.
Out of people who lived in different houses, 63% lived in this county.
Out of people who lived in different counties, 55% lived in Tennessee.
Education attainment for males 25 years and older:
- No schooling: 0
- Nursery to 4th grade: 20
- 5th and 6th grade: 92
- 7th and 8th grade: 204
- 9th grade: 56
- 10th grade: 106
- 11th grade: 66
- 12th grade, no diploma: 67
- High school graduate (or equivalency): 865
- Less than 1 year of college: 77
- Some college more than 1 year, no degree: 93
- Associate degree: 22
- Bachelor's degree: 101
- Master's degree: 18
- Professional school degree: 16
- Doctorate degree: 0

Education attainment for females 25 years and older:
- No schooling: 46
- Nursery to 4th grade: 19
- 5th and 6th grade: 34
- 7th and 8th grade: 203
- 9th grade: 74
- 10th grade: 101
- 11th grade: 25
- 12th grade, no diploma: 68
- High school graduate (or equivalency): 853
- Less than 1 year of college: 159
- Some college more than 1 year, no degree: 107
- Associate degree: 63
- Bachelor's degree: 89
- Master's degree: 32
- Professional school degree: 10
- Doctorate degree: 0


Housing units in structures:
- One, detached: 1,917
- One, attached: 15
- Two: 34
- 3 or 4: 3
- 5 to 9: 15
- 10 to 19: 8
- Mobile homes: 640
- Boats, RVs, vans, etc.: 14
Median worth of mobile homes: $47,357
Housing units lacking complete kitchen facilities: 3.7%

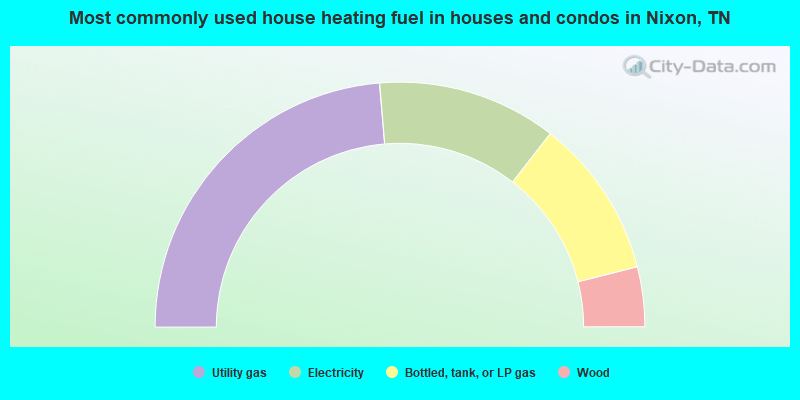
- 47.4%Utility gas
- 23.7%Electricity
- 21.1%Bottled, tank, or LP gas
- 7.9%Wood
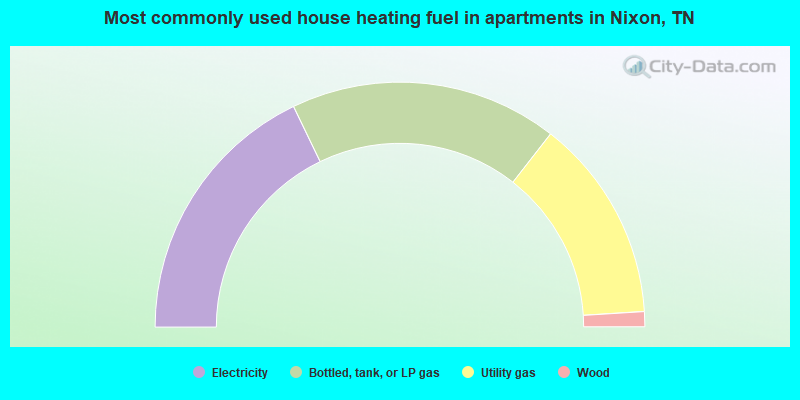
- 35.7%Electricity
- 35.4%Bottled, tank, or LP gas
- 26.9%Utility gas
- 2.0%Wood
Private vs. public school enrollment:
| Here: | 11.3% |
| Tennessee: | 9.5% |
| Here: | 0.0% |
| Tennessee: | 10.4% |
| Here: | 15.3% |
| Tennessee: | 22.8% |


