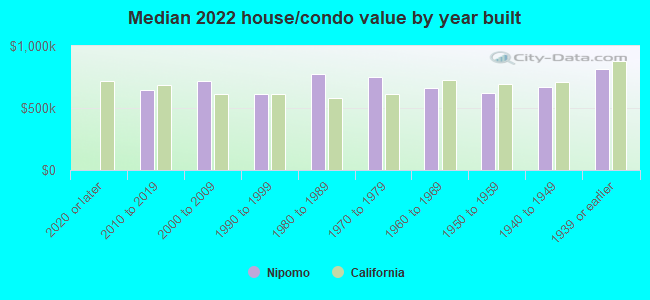
Nipomo, CA (California) Houses and Residents
| Nipomo: | $708,557 |
| California: | $715,900 |
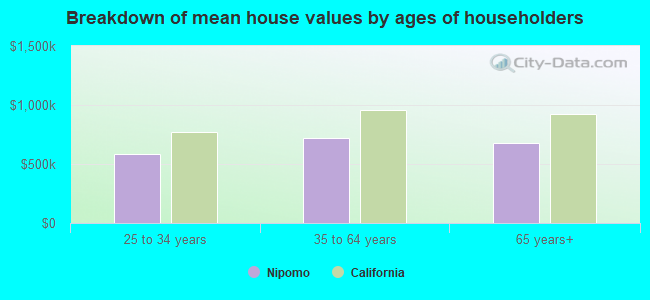
Mean price in 2022:
Detached houses: $798,693
Here: $798,693 State: $988,808 Townhouses or other attached units: $154,589
Here: $154,589 State: $838,546 Mobile homes: $400,193
Here: $400,193 State: $184,506
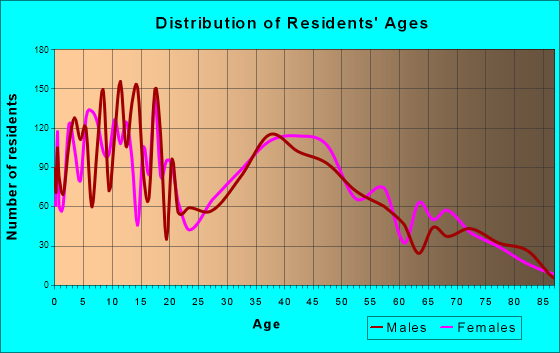
Total population: 16,714 (Urban population: 11,768, Rural population: 832 (16 farm, 816 nonfarm))
Houses: 6,084 (5,780 occupied: 4,070 owner occupied, 1,813 renter occupied)
| % of renters here: | 31% |
| State: | 44% |
Housing density: 533 houses/condos per square mile
Median price asked for vacant for-sale houses and condos in 2022: $198,354.
Median contract rent in 2022: $1,694 (lower quartile is $1,264, upper quartile is over $2,000)
Median rent asked for vacant for-rent units in 2022: $18,236
Median gross rent in Nipomo, CA in 2022: $1,902
Housing units in Nipomo with a mortgage: 2,666 (270 second mortgage, 0 home equity loan, 285 both second mortgage and home equity loan)
Houses without a mortgage: 125
Median household income for houses/condos with a mortgage: $132,367
Median household income for apartments without a mortgage: $90,387
Median monthly housing costs: $1,919
Compare current foreclosures near Nipomo, CA:
| Photo | Address | Area | Beds / Baths | Price | Details |
|---|---|---|---|---|---|

|
#1
Jupiter Dr
Nipomo, CA 93444
|
2,427 sq. feet
|
2 baths 3 beds |
show details | |

|
#2
Viola Ct
Nipomo, CA 93444
|
1,782 sq. feet
|
2 baths 3 beds |
show details | |

|
#3
La Serenata Way
Nipomo, CA 93444
|
2,331 sq. feet
|
3 baths 3 beds |
show details | |

|
#4
Kent St
Nipomo, CA 93444
|
1,160 sq. feet
|
2 baths 3 beds |
show details | |

|
#5
Hunter Ridge Ln
Nipomo, CA 93444
|
2,388 sq. feet
|
2 baths 3 beds |
show details | |

|
#6
Southland St
Nipomo, CA 93444
|
934 sq. feet
|
1 baths 2 beds |
show details | |

|
#7
E Branch St
Nipomo, CA 93444
|
1,120 sq. feet
|
2 baths 3 beds |
show details | |

|
#8
E Branch St
Nipomo, CA 93444
|
1,887 sq. feet
|
2 baths 4 beds |
show details | |

|
#9
Viola Ct
Nipomo, CA 93444
|
1,782 sq. feet
|
2 baths 3 beds |
show details | |

|
#10
January St
Nipomo, CA 93444
|
1,803 sq. feet
|
2 baths 3 beds |
show details |
| Photo | Address | Area | Beds / Baths | Price | Details |
|---|---|---|---|---|---|

|
#11
Calimex
Nipomo, CA 93444
|
- sq. feet
|
- baths - beds |
show details | |

|
#12
Bonita School Rd
Nipomo, CA 93444
|
- sq. feet
|
- baths - beds |
show details | |

|
#13
Calle Atapaneo
Nipomo, CA 93444
|
- sq. feet
|
- baths - beds |
show details | |

|
#14
W Price St # 2
Nipomo, CA 93444
|
- sq. feet
|
- baths - beds |
show details | |

|
#15
E Dana St
Nipomo, CA 93444
|
- sq. feet
|
- baths - beds |
show details | |

|
#16
Upper Los Berros Rd
Nipomo, CA 93444
|
- sq. feet
|
- baths - beds |
show details | |

|
#17
La Tijera Ct
Oceano, CA 93445
|
1,161 sq. feet
|
1 baths 3 beds |
show details | |

|
#18
Ibis Cir
Guadalupe, CA 93434
|
1,532 sq. feet
|
2 baths 3 beds |
show details | |

|
#19
Las Posas Ave
Santa Maria, CA 93458
|
2,250 sq. feet
|
2 baths 3 beds |
show details | |

|
#20
N College Dr
Santa Maria, CA 93454
|
1,860 sq. feet
|
1 baths 4 beds |
show details |
| Photo | Address | Area | Beds / Baths | Price | Details |
|---|---|---|---|---|---|

|
#21
S Bradley Rd
Santa Maria, CA 93455
|
1,196 sq. feet
|
2 baths 4 beds |
show details | |

|
#22
Hillcrest Dr
Arroyo Grande, CA 93420
|
1,097 sq. feet
|
2 baths 2 beds |
show details | |

|
#23
Oak Hill Rd
Arroyo Grande, CA 93420
|
2,730 sq. feet
|
2 baths 4 beds |
show details | |

|
#24
Huckleberry Ave
Arroyo Grande, CA 93420
|
1,709 sq. feet
|
2 baths 3 beds |
show details | |

|
#25
Nice Ave
Grover Beach, CA 93433
|
1,278 sq. feet
|
2 baths 3 beds |
show details | |

|
#26
Larkspur Dr
Santa Maria, CA 93455
|
1,682 sq. feet
|
2 baths 3 beds |
show details | |

|
#27
Fair Oaks Ave
Arroyo Grande, CA 93420
|
1,427 sq. feet
|
2 baths 3 beds |
show details | |

|
#28
Brighton Ave
Grover Beach, CA 93433
|
1,805 sq. feet
|
2 baths 3 beds |
show details | |

|
#29
Farroll Ave
Arroyo Grande, CA 93420
|
1,553 sq. feet
|
2 baths 3 beds |
show details | |

|
#30
N 12th St
Grover Beach, CA 93433
|
520 sq. feet
|
2 baths 1 beds |
show details |
| Photo | Address | Area | Beds / Baths | Price | Details |
|---|---|---|---|---|---|

|
#31
Quail Ct
Arroyo Grande, CA 93420
|
1,961 sq. feet
|
2 baths 2 beds |
show details | |

|
#32
Quarterhorse Way
Arroyo Grande, CA 93420
|
3,172 sq. feet
|
2 baths 3 beds |
show details | |

|
#33
Corbett Canyon Rd
Arroyo Grande, CA 93420
|
2,362 sq. feet
|
2 baths 2 beds |
show details | |

|
#34
Chaparral St
Santa Maria, CA 93454
|
1,963 sq. feet
|
2 baths 4 beds |
show details | |

|
#35
Pino Solo Dr
Santa Maria, CA 93455
|
2,143 sq. feet
|
3 baths 5 beds |
show details | |

|
#36
E Alvin Ave
Santa Maria, CA 93454
|
1,104 sq. feet
|
2 baths 3 beds |
show details | |

|
#37
W Williams St
Santa Maria, CA 93458
|
1,316 sq. feet
|
2 baths 3 beds |
show details | |

|
#38
N Railroad Ave
Santa Maria, CA 93458
|
1,897 sq. feet
|
3 baths 5 beds |
show details | |

|
#39
Valley Oaks
Arroyo Grande, CA 93420
|
3,722 sq. feet
|
3 baths 4 beds |
show details | |

|
#40
Pomeroy Rd
Arroyo Grande, CA 93420
|
1,607 sq. feet
|
3 baths 5 beds |
show details |
| Photo | Address | Area | Beds / Baths | Price | Details |
|---|---|---|---|---|---|

|
#41
Woodlawn Dr
Santa Maria, CA 93458
|
- sq. feet
|
2 baths 4 beds |
show details | |

|
#42
S Bradley Rd
Santa Maria, CA 93455
|
- sq. feet
|
2 baths 3 beds |
show details | |

|
#43
Dejoy St
Santa Maria, CA 93458
|
- sq. feet
|
2 baths 3 beds |
show details | |

|
#44
E Riddering St
Santa Maria, CA 93455
|
- sq. feet
|
2 baths 3 beds |
show details | |

|
#45
Mary Dr
Santa Maria, CA 93458
|
- sq. feet
|
2 baths 3 beds |
show details | |

|
#46
Mariah Dr
Santa Maria, CA 93454
|
- sq. feet
|
2 baths 3 beds |
show details | |

|
#47
W Creston St
Santa Maria, CA 93458
|
- sq. feet
|
2 baths 3 beds |
show details | |

|
#48
Barnette Rd
Santa Maria, CA 93455
|
- sq. feet
|
2 baths 3 beds |
show details | |

|
#49
Satinwood Rd
Santa Maria, CA 93455
|
- sq. feet
|
2 baths 4 beds |
show details | |

|
Check over 1 million property listings on Foreclosure.com!
|
browse all offers | |||

Latest news about housing in Nipomo, CA collected exclusively by city-data.com from local newspapers, TV, and radio stations

 | Why Santa Maria houses are substantially less expensive to purchase? (32 replies) |
| Moving to SLO county, need help deciding which area to move. (8 replies) |
| Questions: Moving to slo county (32 replies) |
| Grover Beach/Pismo (8 replies) |
| Central coast living (29 replies) |
| Living in Nipomo and commuting to SLO? Experience living in Nipomo? (11 replies) |
Median year apartment built: 1987
Household type by relationship:
Households: 18,028- Male householders: 2,869 (381 living alone), Female householders: 2,831 (548 living alone)
3,230 spouses (3,217 opposite-sex spouses), 539 unmarried partners, (487 opposite-sex unmarried partners), 5,634 children (5,491 natural, 35 adopted, 107 stepchildren), 741 grandchildren, 191 brothers or sisters, 545 parents, 15 foster children, 667 other relatives, 731 non-relatives
- In group quarters: 31
Size of family households: 1,603 2-persons, 847 3-persons, 864 4-persons, 520 5-persons, 282 6-persons, 439 7-or-more-persons.
Size of nonfamily households: 955 1-person, 320 2-persons, 101 3-persons, 37 4-persons.
2,400 married couples with children.
840 single-parent households (93 men, 747 women).
67.3% of residents of Nipomo speak English at home.
29.7% of residents speak Spanish at home (67% speak English very well, 13% speak English well, 14% speak English not well, 6% don't speak English at all).
1.1% of residents speak other Indo-European language at home (94% speak English very well, 6% speak English well).
1.4% of residents speak Asian or Pacific Island language at home (32% speak English very well, 55% speak English well, 13% speak English not well).
0.4% of residents speak other language at home (64% speak English very well, 36% speak English not well).
Foreign born population: 2,957 (16.4%)
(61.0% of them are naturalized citizens)
| Here: | 5.9 |
| State: | 6.0 |
| Here: | 4.8 |
| State: | 3.9 |
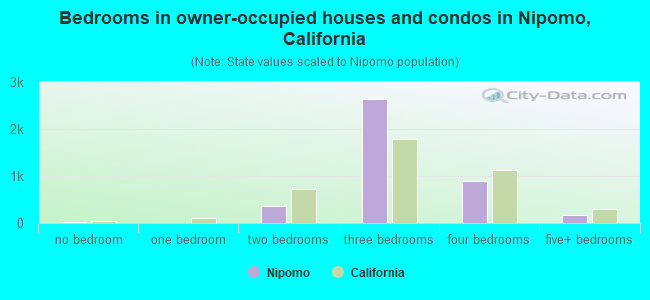
- Bedrooms in owner-occupied houses and condos in Nipomo, California
- 18no bedroom
- 01 bedroom
- 3582 bedrooms
- 2,6363 bedrooms
- 8834 bedrooms
- 1775+ bedrooms
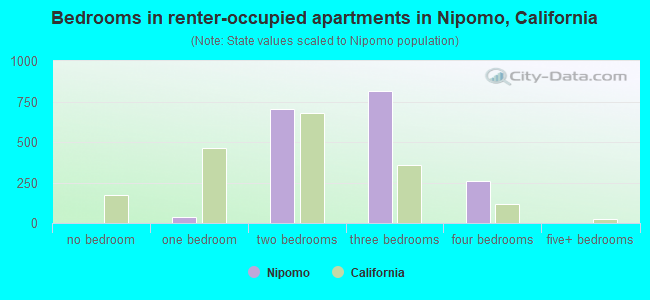
- Bedrooms in renter-occupied apartments in Nipomo, California
- 0no bedroom
- 381 bedroom
- 7052 bedrooms
- 8123 bedrooms
- 2584 bedrooms
- 05+ bedrooms
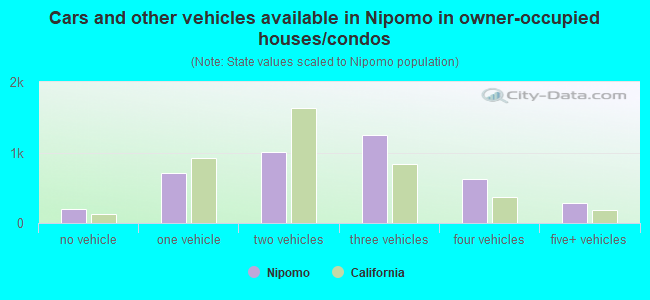
- Cars and other vehicles available in Nipomo in owner-occupied houses/condos
- 202no vehicle
- 7121 vehicle
- 1,0012 vehicles
- 1,2443 vehicles
- 6314 vehicles
- 2805+ vehicles
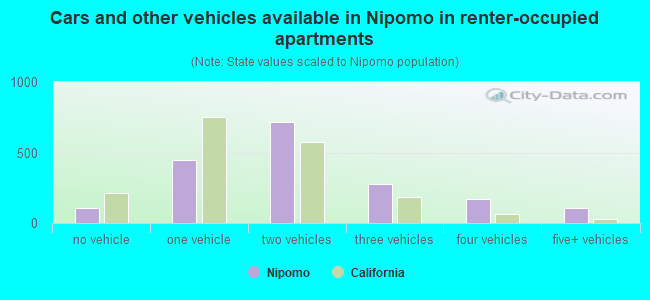
- Cars and other vehicles available in Nipomo in renter-occupied apartments
- 106no vehicle
- 4441 vehicle
- 7132 vehicles
- 2753 vehicles
- 1694 vehicles
- 1055+ vehicles
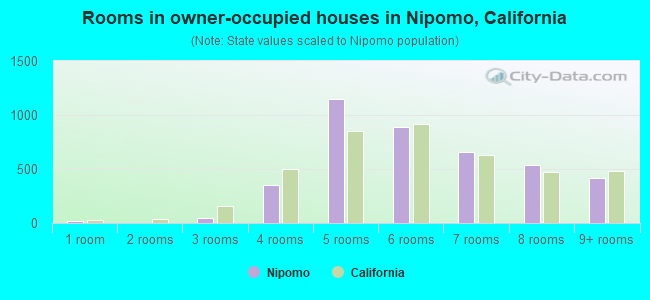
- Rooms in owner-occupied houses in Nipomo, California
- 181 room
- 02 rooms
- 473 rooms
- 3494 rooms
- 1,1525 rooms
- 8916 rooms
- 6567 rooms
- 5388 rooms
- 4209+ rooms
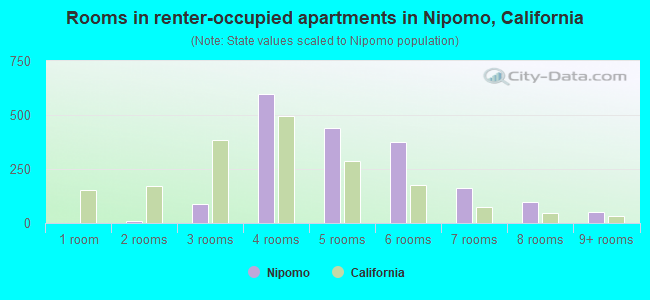
- Rooms in renter-occupied apartments in Nipomo, California
- 01 room
- 82 rooms
- 873 rooms
- 5964 rooms
- 4425 rooms
- 3746 rooms
- 1607 rooms
- 968 rooms
- 509+ rooms
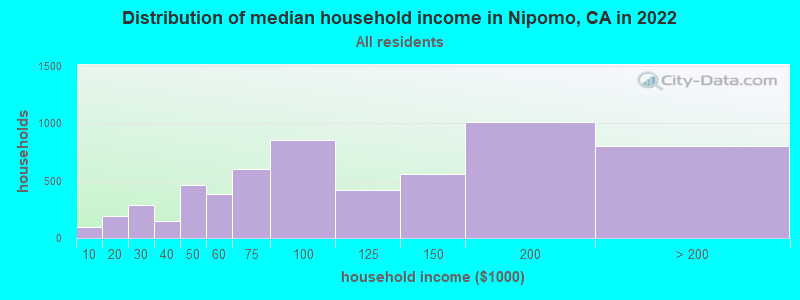
Nipomo, CA household income distribution

- 95Less than $10,000
- 190$10,000 to $19,999
- 284$20,000 to $29,999
- 150$30,000 to $39,999
- 457$40,000 to $49,999
- 387$50,000 to $59,999
- 603$60,000 to $74,999
- 853$75,000 to $99,999
- 420$100,000 to $124,999
- 560$125,000 to $149,999
- 1,009$150,000 to $199,999
- 799$200,000 or more
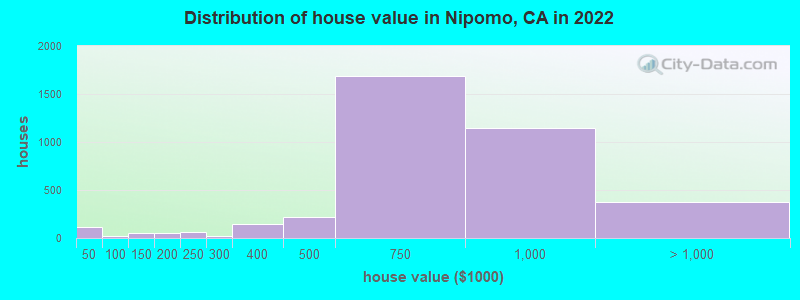
Home value of owner - occupied houses in 2022 in Nipomo, CA
-
- 18Less than $10,000
- 91$35,000 to $39,999
- 4$50,000 to $59,999
- 18$90,000 to $99,999
- 53$100,000 to $124,999
- 51$150,000 to $174,999
- 58$200,000 to $249,999
- 24$250,000 to $299,999
- 146$300,000 to $399,999
- 213$400,000 to $499,999
- 1,685$500,000 to $749,999
- 1,144$750,000 to $999,999
- 236$1,000,000 to $1,499,999
- 79$1,500,000 to $1,999,999
- 55$2,000,000 or more
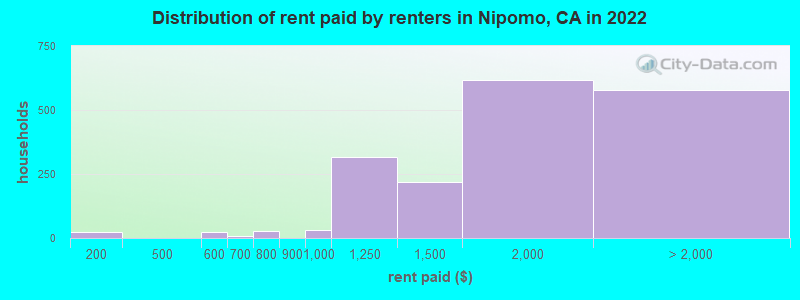
Rent paid by renters in 2022 in Nipomo, CA
-
- 24$100 to $149
- 21$500 to $549
- 8$600 to $649
- 25$750 to $799
- 32$900 to $999
- 318$1,000 to $1,249
- 219$1,250 to $1,499
- 617$1,500 to $1,999
- 258$2,000 to $2,499
- 194$2,500 to $2,999
- 14$3,000 to $3,499
- 39$3,500 or more
- 71No cash rent
Percentage of workers working in this county: 61.0%
Number of people working at home: 775 (9.5% of all workers)
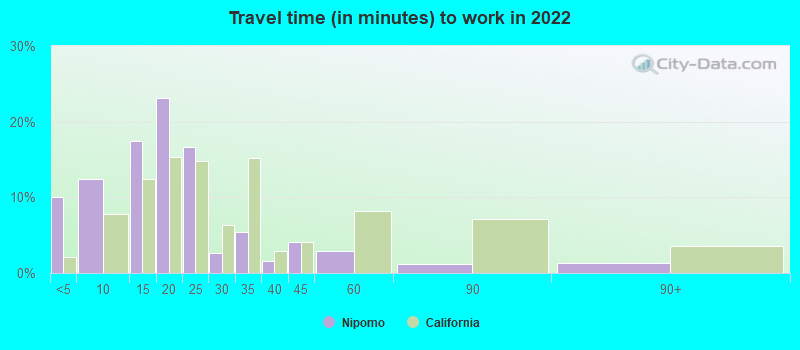
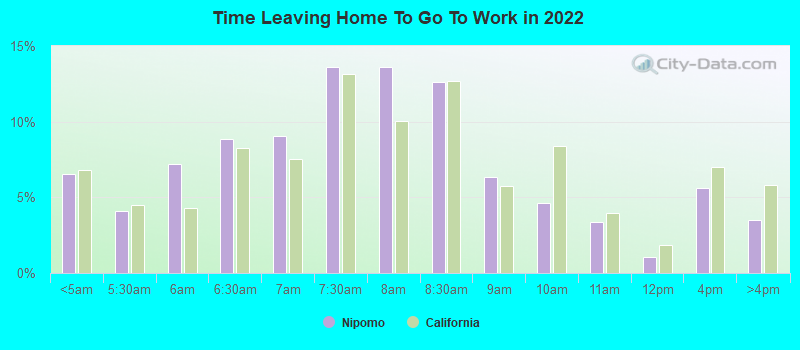
Travel time to work (commute)
- Less than 5 minutes: 109
- 5 to 9 minutes: 471
- 10 to 14 minutes: 866
- 15 to 19 minutes: 1,476
- 20 to 24 minutes: 1,367
- 25 to 29 minutes: 405
- 30 to 34 minutes: 855
- 35 to 39 minutes: 263
- 40 to 44 minutes: 457
- 45 to 59 minutes: 491
- 60 to 89 minutes: 151
- 90 or more minutes: 268
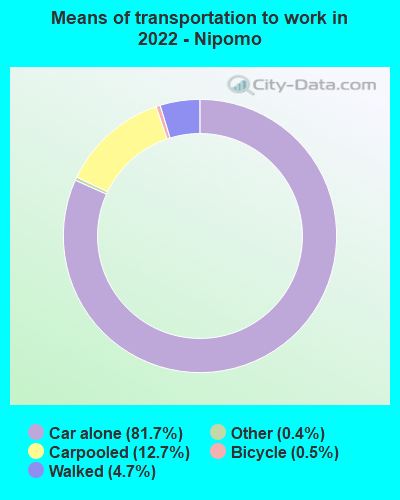
Means of transportation to work:
- Drove a car alone: 2,434 (66.6%)
- Carpooled: 353 (9.7%)
- Taxi: 11 (0.3%)
- Bicycle: 16 (0.4%)
- Walked: 123 (3.4%)
- Worked at home: 775 (21.2%)
- Unemployment by race in 2022
- Unemployment rate for White non-Hispanic residents
- 7.6%Females
- Unemployment rate for Black residents
- 11.7%Males
- Unemployment rate for other race residents
- 3.7%Males
- 5.6%Females
- Unemployment rate for two or more race residents
- 2.2%Males
- Unemployment rate for Hispanic or Latino residents
- 3.4%Males
- 5.9%Females
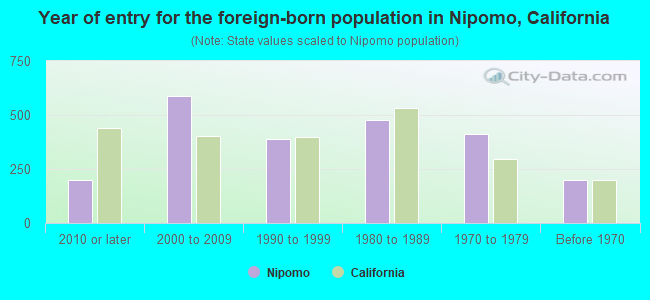
- Year of entry for the foreign-born population in Nipomo, California
- 1992010 or later
- 5892000 to 2009
- 3911990 to 1999
- 4781980 to 1989
- 4101970 to 1979
- 199Before 1970
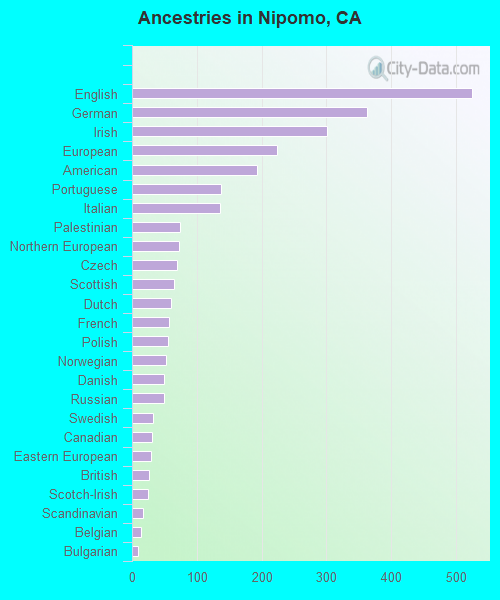
First ancestries reported:
- English: 525 (5.5%)
- German: 363 (3.8%)
- Irish: 301 (3.2%)
- European: 224 (2.4%)
- American: 193 (2.0%)
- Portuguese: 137 (1.4%)
- Italian: 136 (1.4%)
- Palestinian: 74 (0.8%)
- Northern European: 73 (0.8%)
- Czech: 69 (0.7%)
- Scottish: 65 (0.7%)
- Dutch: 60 (0.6%)
- French: 57 (0.6%)
- Polish: 55 (0.6%)
- Norwegian: 53 (0.6%)
- Danish: 49 (0.5%)
- Russian: 49 (0.5%)
- Swedish: 32 (0.3%)
- Canadian: 31 (0.3%)
- Eastern European: 30 (0.3%)
- British: 26 (0.3%)
- Scotch-Irish: 25 (0.3%)
- Scandinavian: 17 (0.2%)
- Belgian: 14 (0.1%)
- Bulgarian: 10 (0.1%)
- Swiss: 8 (0.08%)
- Hungarian: 4 (0.04%)
Most common places of birth for foreign-born residents (%):
| Nipomo: | 76.0% (2,148) |
| California: | 37.2% (3,881,193) |
| Nipomo: | 4.2% (119) |
| California: | 7.8% (818,297) |
| Nipomo: | 3.6% (101) |
| California: | 1.2% (127,477) |
| Nipomo: | 2.8% (79) |
| California: | 5.2% (539,184) |
| Nipomo: | 2.4% (69) |
| California: | 3.0% (315,248) |
| Nipomo: | 1.6% (44) |
| California: | 0.2% (17,937) |
Place of birth for U.S.-born residents:
- This state: 12,874
- Other state: 2,148
- Northeast: 340
- Midwest: 610
- South: 599
- West: 598
91.0% of Nipomo residents lived in the same house 1 years ago.
Out of people who lived in different houses, 37.9% lived in this county.
Out of people who lived in different counties, 62.9% lived in California.
| Nipomo: | 91.0% |
| State average: | 88.9% |
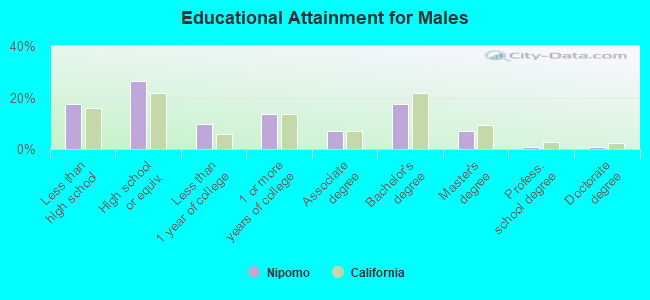
Education attainment for males 25 years and older:
- No schooling: 267
- Nursery to 4th grade: 37
- 5th and 6th grade: 264
- 7th and 8th grade: 80
- 9th grade: 84
- 10th grade: 59
- 11th grade: 32
- 12th grade, no diploma: 194
- High school graduate (or equivalency): 1,551
- Less than 1 year of college: 569
- Some college more than 1 year, no degree: 806
- Associate degree: 410
- Bachelor's degree: 1,014
- Master's degree: 411
- Professional school degree: 41
- Doctorate degree: 41
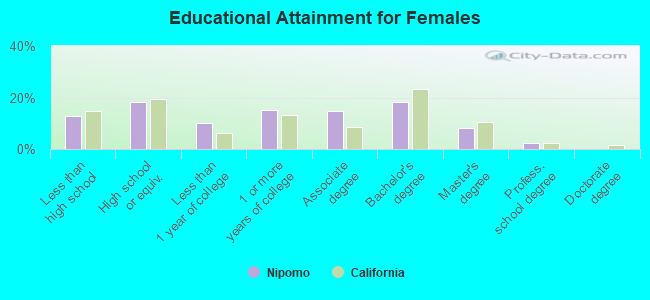
Education attainment for females 25 years and older:
- No schooling: 203
- Nursery to 4th grade: 65
- 5th and 6th grade: 90
- 7th and 8th grade: 139
- 9th grade: 47
- 10th grade: 53
- 11th grade: 35
- 12th grade, no diploma: 134
- High school graduate (or equivalency): 1,080
- Less than 1 year of college: 606
- Some college more than 1 year, no degree: 888
- Associate degree: 865
- Bachelor's degree: 1,078
- Master's degree: 473
- Professional school degree: 136
- Doctorate degree: 0
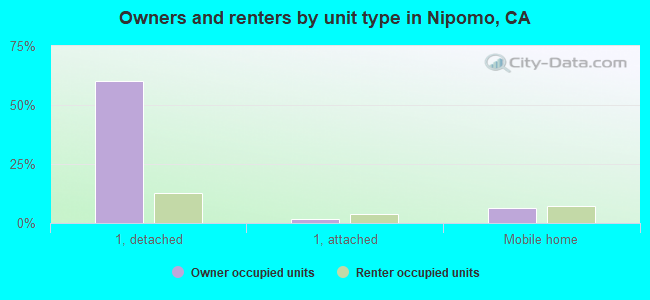
Housing units in structures:
- One, detached: 4,380
- One, attached: 317
- Two: 86
- 3 or 4: 222
- 5 to 9: 215
- 10 to 19: 44
- 50 or more: 46
- Mobile homes: 770
Median worth of mobile homes: $399,904
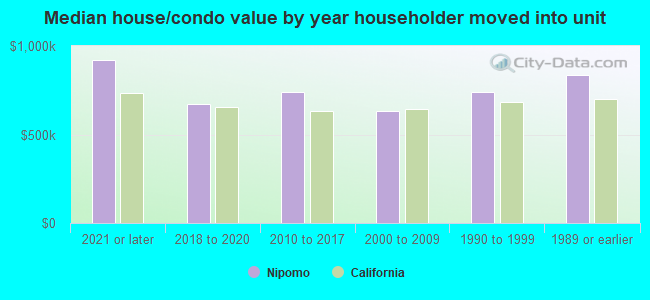
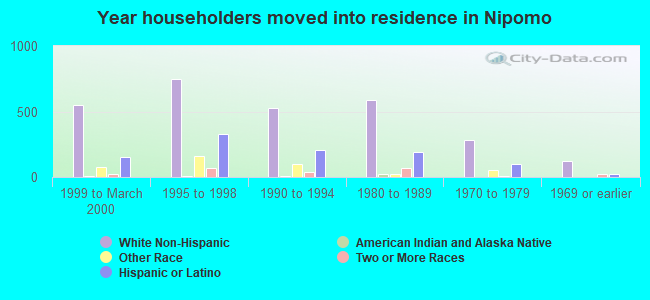
House/condo owner moved in on average 15 years ago
Renter moved in on average 5 years ago
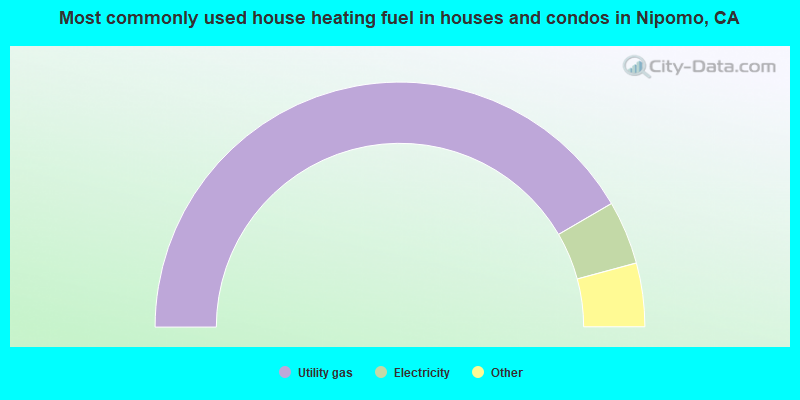
- 83.2%Utility gas
- 8.4%Electricity
- 3.2%Solar energy
- 3.2%Bottled, tank, or LP gas
- 1.7%Wood
- 0.3%No fuel used
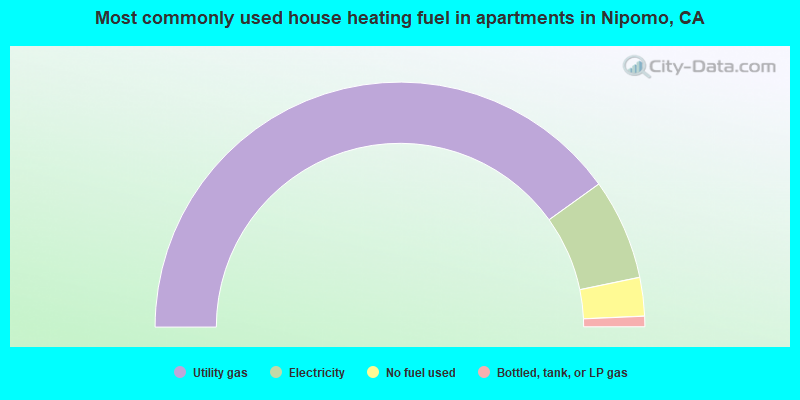
- 80.1%Utility gas
- 13.3%Electricity
- 5.1%No fuel used
- 1.4%Bottled, tank, or LP gas
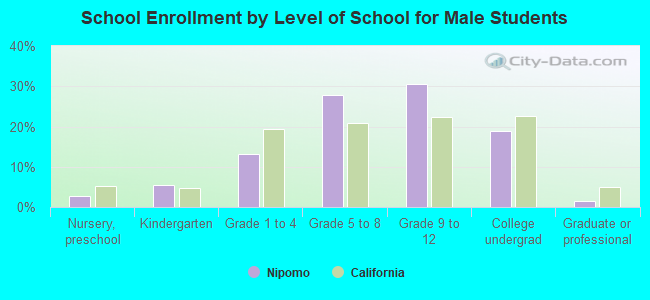
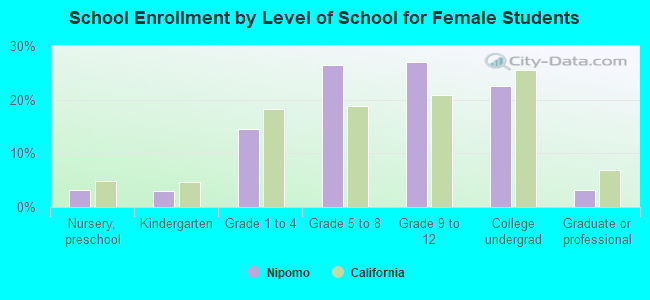
Private vs. public school enrollment:
| Here: | 3.8% |
| California: | 10.5% |
| Here: | 4.5% |
| California: | 8.5% |
| Here: | 0.0% |
| California: | 15.9% |