Niles, OH (Ohio) Houses and Residents
Estimated median house or condo value in 2022: $104,423 (it was $79,200 in 2000 )
Niles:
$104,423Ohio:
$204,100
Lower value quartile - upper value quartile: $77,119 - $159,978Mean price in 2022: Detached houses: $131,973 Here:
$131,973State:
$254,366
Townhouses or other attached units: $161,642 Here:
$161,642State:
$225,733
In 2-unit structures: $105,009 Here:
$105,009State:
$144,384
In 3-to-4-unit structures: $134,521 Here:
$134,521State:
$203,002
In 5-or-more-unit structures: $183,837 Here:
$183,837State:
$211,593
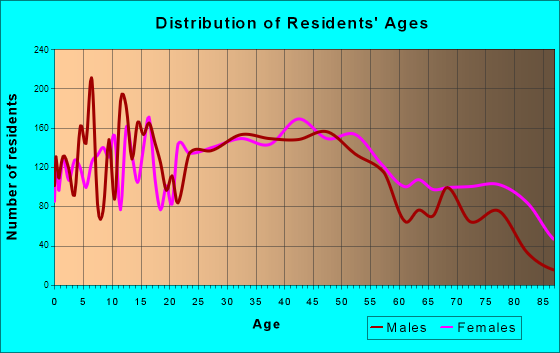
Total population: 18,778 (All urban)
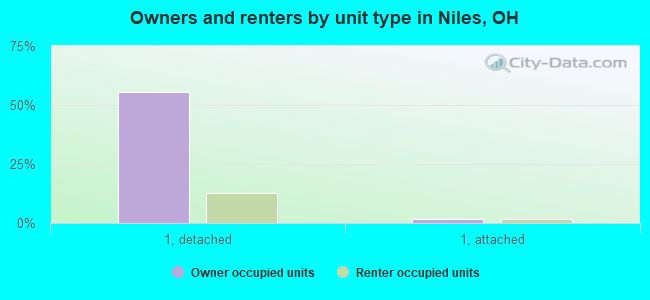
Houses: 9,433 (8,395 occupied: 4,800 owner occupied, 3,572 renter occupied )
% of renters here:
43%State:
33%
Housing density: 1,103 houses/condos per square mile
Median price asked for vacant for-sale houses and condos in 2022: $53,112.
Median contract rent in 2022: $663 (lower quartile is $550, upper quartile is $728)
Median rent asked for vacant for-rent units in 2022: $812
Median gross rent in Niles, OH in 2022: $720
Housing units in Niles with a mortgage: 2,256 (231 second mortgage, 0 home equity loan, 129 both second mortgage and home equity loan )Houses without a mortgage: 167
Median household income for houses/condos with a mortgage: $75,983
Median household income for apartments without a mortgage: $55,785
Median monthly housing costs: $701
Data:
Median house or condo value ($)
Median house or condo value ($ change since 2000)
Median house or condo value ($) - White
Median house or condo value ($) - Black or African American
Median house or condo value ($) - Asian
Median house or condo value ($) - Hispanic or Latino
Median house or condo value ($) - American Indian and Alaska Native
Median house or condo value ($) - Multirace
Median house or condo value ($) - Other Race
Median price asked for mobile homes ($)
Household density (households per square mile)
Mean house or condo value by units in structure - 1, detached ($)
Mean house or condo value by units in structure - 1, attached ($)
Mean house or condo value by units in structure - 2 ($)
Mean house or condo value by units in structure by units in structure - 3 or 4 ($)
Mean house or condo value by units in structure - 5 or more ($)
Mean house or condo value by units in structure - Boat, RV, van, etc. ($)
Mean house or condo value by units in structure - Mobile home ($)
Median contract rent ($)
Median contract rent - Lower quartile ($)
Median contract rent - Upper quartile ($)
Median gross rent ($)
Urban houses (%)
Rural houses (%)
Houses occupied (%)
Houses occupied (% change since 2000)
Houses owner occupied (%)
Houses owner occupied (% change since 2000)
Houses renter occupied (%)
Houses renter occupied (% change since 2000)
Vacant housing units - For rent (%)
Vacant housing units - For rent (% change since 2000)
Vacant housing units - For sale only (%)
Vacant housing units - For sale only (% change since 2000)
Vacant housing units - Rented or sold, not occupied (%)
Vacant housing units - Rented or sold, not occupied (% change since 2000)
Vacant housing units - For seasonal, recreational, or occasional use (%)
Vacant housing units - For seasonal, recreational, or occasional use (% change since 2000)
Vacant housing units - For migrant workers (%)
Vacant housing units - For migrant workers (% change since 2000)
Vacant housing units - Other vacant (%)
Vacant housing units - Other vacant (% change since 2000)
Median monthly housing costs ($)
Median household income for houses/condos with a mortgage ($)
Median household income for houses/condos without a mortgage ($)
Median household income ($)
Median household income ($) - White
Median household income ($) - Black or African American
Median household income ($) - Asian
Median household income ($) - Hispanic or Latino
Median household income ($) - American Indian and Alaska Native
Median household income ($) - Multirace
Median household income ($) - Other Race
Mortgage status - with mortgage (%)
Mortgage status - with second mortgage (%)
Mortgage status - with home equity loan (%)
Mortgage status - with both second mortgage and home equity loan (%)
Mortgage status - without a mortgage (%)
Median year house/condo built
Median year apartment built
Household type by relationship - Male householder living alone (%)
Household type by relationship - Male householder not living alone (%)
Household type by relationship - Female householder living alone (%)
Household type by relationship - Female householder not living alone (%)
Household type by relationship - Opposite-Sex spouse (%)
Household type by relationship - Same-Sex spouse (%)
Household type by relationship - Opposite-Sex unmarried partner (%)
Household type by relationship - Same-Sex unmarried partner (%)
Household type by relationship - In group quarters (%)
Size of family households - 2-person household (%)
Size of family households - 3-person household (%)
Size of family households - 4-person household (%)
Size of family households - 5-person household (%)
Size of family households - 6-person household (%)
Size of family households - 7-or-more-person household (%)
Size of nonfamily households - 1-person household (%)
Size of nonfamily households - 2-person household (%)
Size of nonfamily households - 3-person household (%)
Size of nonfamily households - 4-person household (%)
Size of nonfamily households - 5-person household (%)
Size of nonfamily households - 6-person household (%)
Size of nonfamily households - 7-or-moreperson household (%)
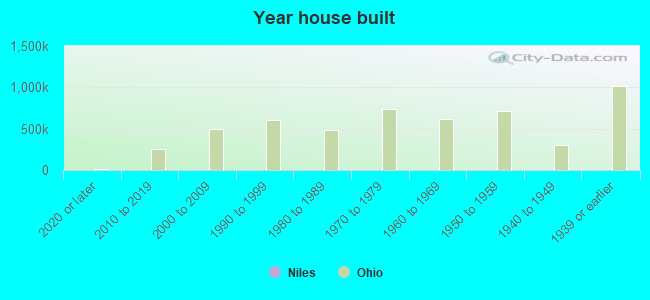
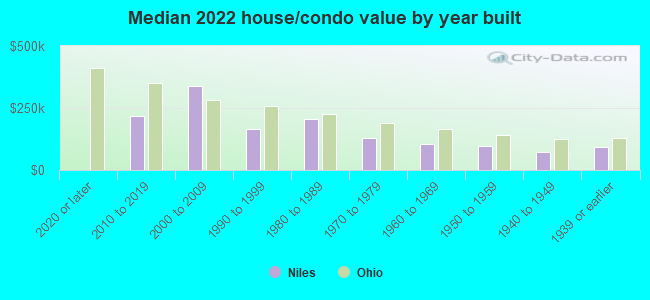
Year house built - Built 2010 or later (%)
Year house built - Built 2000 to 2009 (%)
Year house built - Built 1990 to 1999 (%)
Year house built - Built 1980 to 1989 (%)
Year house built - Built 1970 to 1979 (%)
Year house built - Built 1960 to 1969 (%)
Year house built - Built 1950 to 1959 (%)
Year house built - Built 1940 to 1949 (%)
Year house built - Built 1939 or earlier (%)
Median number of rooms in houses and condos
Median number of rooms in apartments
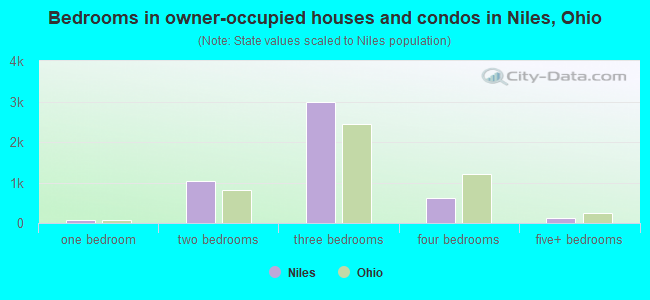
Median number of bedrooms in owner occupied houses
Mean number of bedrooms in owner occupied houses
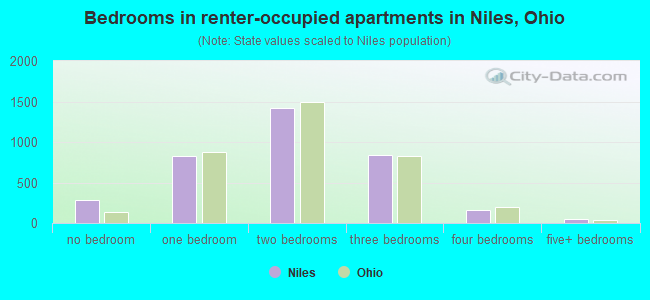
Median number of bedrooms in renter occupied houses
Mean number of bedrooms in renter occupied houses
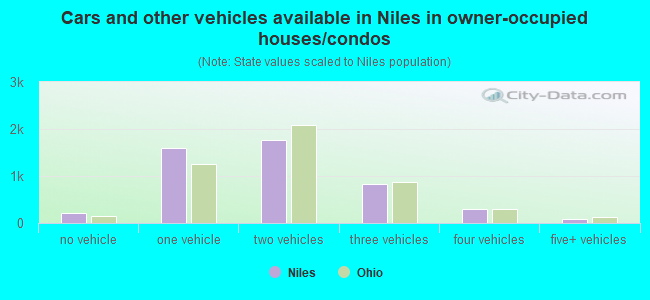
Median number of vehichles in owner occupied houses
Mean number of vehichles in owner occupied houses
Median number of vehichles in renter occupied houses
Mean number of vehichles in renter occupied houses
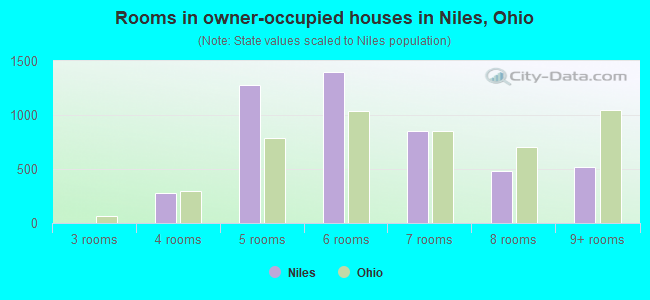
Rooms in owner-occupied houses - 1 room (%)
Rooms in owner-occupied houses - 2 rooms (%)
Rooms in owner-occupied houses - 3 rooms (%)
Rooms in owner-occupied houses - 4 rooms (%)
Rooms in owner-occupied houses - 5 rooms (%)
Rooms in owner-occupied houses - 6 rooms (%)
Rooms in owner-occupied houses - 7 rooms (%)
Rooms in owner-occupied houses - 8 rooms (%)
Rooms in owner-occupied houses - 9+ rooms (%)
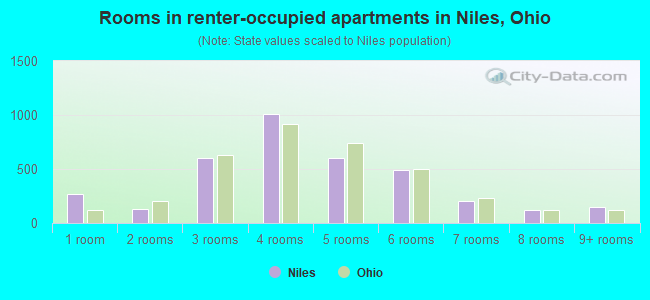
Rooms in renter-occupied houses - 1 room (%)
Rooms in renter-occupied houses - 2 rooms (%)
Rooms in renter-occupied houses - 3 rooms (%)
Rooms in renter-occupied houses - 4 rooms (%)
Rooms in renter-occupied houses - 5 rooms (%)
Rooms in renter-occupied houses - 6 rooms (%)
Rooms in renter-occupied houses - 7 rooms (%)
Rooms in renter-occupied houses - 8 rooms (%)
Rooms in renter-occupied houses - 9+ rooms (%)
Bedrooms in owner-occupied houses - no bedrooms (%)
Bedrooms in owner-occupied houses - 1 bedroom (%)
Bedrooms in owner-occupied houses - 2 bedrooms (%)
Bedrooms in owner-occupied houses - 3 bedrooms (%)
Bedrooms in owner-occupied houses - 4 bedrooms (%)
Bedrooms in owner-occupied houses - 5+ bedrooms (%)
Bedrooms in renter-occupied houses - no bedrooms (%)
Bedrooms in renter-occupied houses - 1 bedroom (%)
Bedrooms in renter-occupied houses - 2 bedrooms (%)
Bedrooms in renter-occupied houses - 3 bedrooms (%)
Bedrooms in renter-occupied houses - 4 bedrooms (%)
Bedrooms in renter-occupied houses - 5+ bedrooms (%)
Vehicles available in owner-occupied houses - no vehicle available (%)
Vehicles available in owner-occupied houses - 1 vehicle available(%)
Vehicles available in owner-occupied houses - 2 Vehicles available (%)
Vehicles available in owner-occupied houses - 3 Vehicles available (%)
Vehicles available in owner-occupied houses - 4 Vehicles available (%)
Vehicles available in owner-occupied houses - 5+ Vehicles available (%)
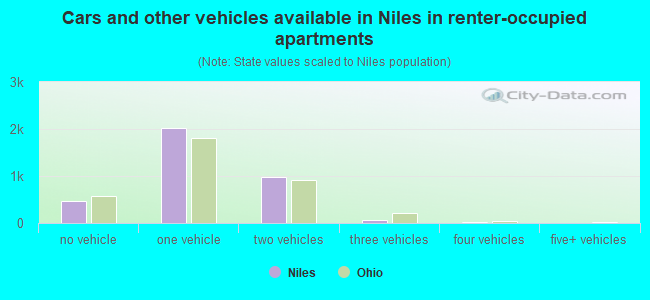
Vehicles available in renter-occupied houses - no vehicle available (%)
Vehicles available in renter-occupied houses - 1 vehicle available (%)
Vehicles available in renter-occupied houses - 2 Vehicles available (%)
Vehicles available in renter-occupied houses - 3 Vehicles available (%)
Vehicles available in renter-occupied houses - 4 Vehicles available (%)
Vehicles available in renter-occupied houses - 5+ Vehicles available (%)
Housing units in structures - 1, detached (%)
Housing units in structures - 1, attached (%)
Housing units in structures - 2 (%)
Housing units in structures - 3 or 4 (%)
Housing units in structures - 5 to 9 (%)
Housing units in structures - 10 to 19 (%)
Housing units in structures - 20 to 49 (%)
Housing units in structures - 50 or more (%)
Housing units in structures - Mobile home (%)
Housing units in structures - Boat, RV, van, etc. (%)
Housing units in structures - Owners - 1, detached (%)
Housing units in structures - Owners - 1, attached (%)
Housing units in structures - Owners - 2 (%)
Housing units in structures - Owners - 3 or 4 (%)
Housing units in structures - Owners - 5 to 9 (%)
Housing units in structures - Owners - 10 to 19 (%)
Housing units in structures - Owners - 20 to 49 (%)
Housing units in structures - Owners - 50 or more (%)
Housing units in structures - Owners - Mobile home (%)
Housing units in structures - Owners - Boat, RV, van, etc. (%)
Housing units in structures - Renters - 1, detached (%)
Housing units in structures - Renters - 1, attached (%)
Housing units in structures - Renters - 2 (%)
Housing units in structures - Renters - 3 or 4 (%)
Housing units in structures - Renters - 5 to 9 (%)
Housing units in structures - Renters - 10 to 19 (%)
Housing units in structures - Renters - 20 to 49 (%)
Housing units in structures - Renters - 50 or more (%)
Housing units in structures - Renters - Mobile home (%)
Housing units in structures - Renters - Boat, RV, van, etc. (%)
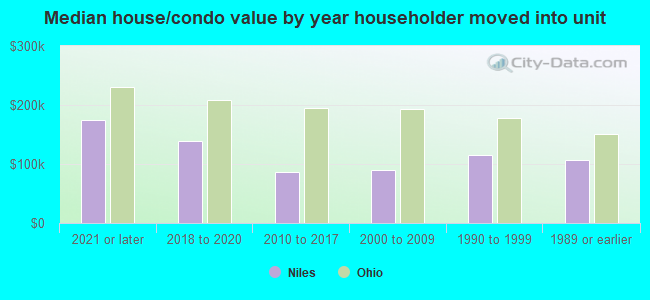
House/condo owner moved in on average (years ago)
Renter moved in on average (years ago)
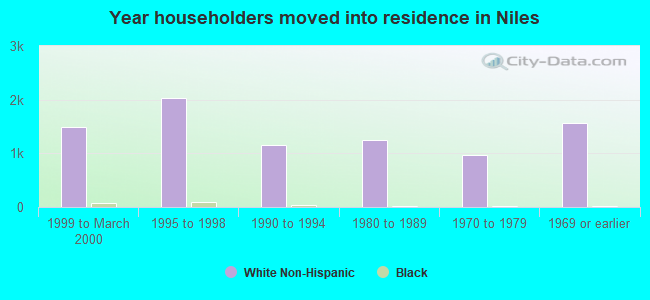
Year householder moved into unit - Moved in 1999 to March 2000 (%)
Year householder moved into unit - Moved in 1999 to March 2000 (%) - White
Year householder moved into unit - Moved in 1999 to March 2000 (%) - Black or African American
Year householder moved into unit - Moved in 1999 to March 2000 (%) - Asian
Year householder moved into unit - Moved in 1999 to March 2000 (%) - Hispanic or Latino
Year householder moved into unit - Moved in 1999 to March 2000 (%) - American Indian and Alaska Native
Year householder moved into unit - Moved in 1999 to March 2000 (%) - Multirace
Year householder moved into unit - Moved in 1999 to March 2000 (%) - Other Race
Year householder moved into unit - Moved in 1995 to 1998 (%)
Year householder moved into unit - Moved in 1995 to 1998 (%) - White
Year householder moved into unit - Moved in 1995 to 1998 (%) - Black or African American
Year householder moved into unit - Moved in 1995 to 1998 (%) - Asian
Year householder moved into unit - Moved in 1995 to 1998 (%) - Hispanic or Latino
Year householder moved into unit - Moved in 1995 to 1998 (%) - American Indian and Alaska Native
Year householder moved into unit - Moved in 1995 to 1998 (%) - Multirace
Year householder moved into unit - Moved in 1995 to 1998 (%) - Other Race
Year householder moved into unit - Moved in 1990 to 1994 (%)
Year householder moved into unit - Moved in 1990 to 1994 (%) - White
Year householder moved into unit - Moved in 1990 to 1994 (%) - Black or African American
Year householder moved into unit - Moved in 1990 to 1994 (%) - Asian
Year householder moved into unit - Moved in 1990 to 1994 (%) - Hispanic or Latino
Year householder moved into unit - Moved in 1990 to 1994 (%) - American Indian and Alaska Native
Year householder moved into unit - Moved in 1990 to 1994 (%) - Multirace
Year householder moved into unit - Moved in 1990 to 1994 (%) - Other Race
Year householder moved into unit - Moved in 1980 to 1989 (%)
Year householder moved into unit - Moved in 1980 to 1989 (%) - White
Year householder moved into unit - Moved in 1980 to 1989 (%) - Black or African American
Year householder moved into unit - Moved in 1980 to 1989 (%) - Asian
Year householder moved into unit - Moved in 1980 to 1989 (%) - Hispanic or Latino
Year householder moved into unit - Moved in 1980 to 1989 (%) - American Indian and Alaska Native
Year householder moved into unit - Moved in 1980 to 1989 (%) - Multirace
Year householder moved into unit - Moved in 1980 to 1989 (%) - Other Race
Year householder moved into unit - Moved in 1970 to 1979 (%)
Year householder moved into unit - Moved in 1970 to 1979 (%) - White
Year householder moved into unit - Moved in 1970 to 1979 (%) - Black or African American
Year householder moved into unit - Moved in 1970 to 1979 (%) - Asian
Year householder moved into unit - Moved in 1970 to 1979 (%) - Hispanic or Latino
Year householder moved into unit - Moved in 1970 to 1979 (%) - American Indian and Alaska Native
Year householder moved into unit - Moved in 1970 to 1979 (%) - Multirace
Year householder moved into unit - Moved in 1970 to 1979 (%) - Other Race
Year householder moved into unit - Moved in 1969 or earlier (%)
Year householder moved into unit - Moved in 1969 or earlier (%) - White
Year householder moved into unit - Moved in 1969 or earlier (%) - Black or African American
Year householder moved into unit - Moved in 1969 or earlier (%) - Asian
Year householder moved into unit - Moved in 1969 or earlier (%) - Hispanic or Latino
Year householder moved into unit - Moved in 1969 or earlier (%) - American Indian and Alaska Native
Year householder moved into unit - Moved in 1969 or earlier (%) - Multirace
Year householder moved into unit - Moved in 1969 or earlier (%) - Other Race
Housing units lacking complete plumbing facilities (%)
Housing units lacking complete kitchen facilities (%)
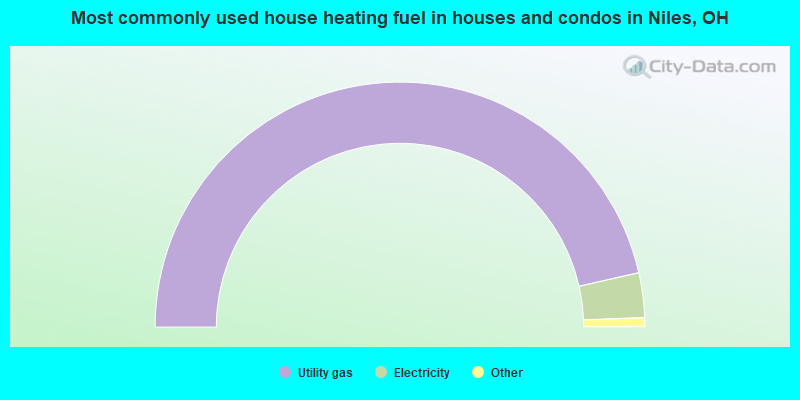
House heating fuel used in houses and condos - Utility gas (%)
House heating fuel used in houses and condos - Bottled, tank, or LP gas (%)
House heating fuel used in houses and condos - Electricity (%)
House heating fuel used in houses and condos - Fuel oil, kerosene, etc. (%)
House heating fuel used in houses and condos - Coal or coke (%)
House heating fuel used in houses and condos - Wood (%)
House heating fuel used in houses and condos - Solar energy (%)
House heating fuel used in houses and condos - Other fuel (%)
House heating fuel used in houses and condos - No fuel used (%)
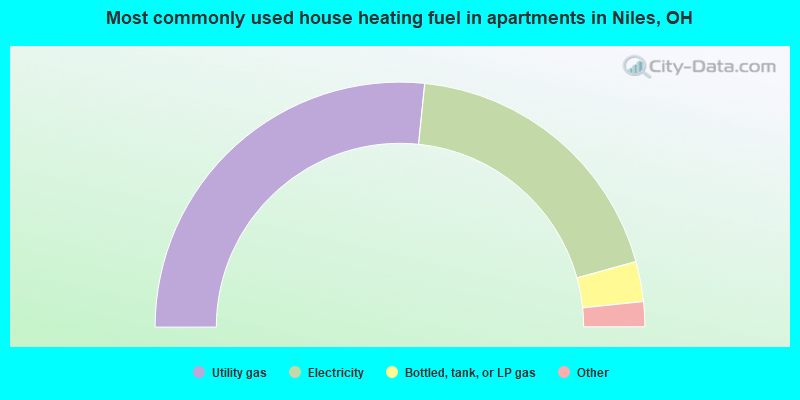
House heating fuel used in apartments - Utility gas (%)
House heating fuel used in apartments - Bottled, tank, or LP gas (%)
House heating fuel used in apartments - Electricity (%)
House heating fuel used in apartments - Fuel oil, kerosene, etc. (%)
House heating fuel used in apartments - Coal or coke (%)
House heating fuel used in apartments - Wood (%)
House heating fuel used in apartments - Solar energy (%)
House heating fuel used in apartments - Other fuel (%)
House heating fuel used in apartments - No fuel used (%)
Latest news about housing in Niles, OH collected exclusively by city-data.com from local newspapers, TV, and radio stations
Median year house/condo built: 1957Median year apartment built: 1975Household type by relationship:
Households: 18,007
Male householders: 3,944 (1,539 living alone ), Female householders: 4,414 (1,875 living alone )2,913 spouses (2,851 opposite-sex spouses ), 738 unmarried partners , (711 opposite-sex unmarried partners ), 4,362 children (3,771 natural , 147 adopted , 444 stepchildren ), 276 grandchildren , 219 brothers or sisters , 290 parents , 0 foster children , 209 other relatives , 354 non-relatives In group quarters: 282
Size of family households: 2,184 2-persons , 1,044 3-persons , 688 4-persons , 219 5-persons , 70 6-persons .
Size of nonfamily households: 3,398 1-person , 735 2-persons , 35 3-persons .
1,474 married couples with children. single-parent households (212 men , 950 women ).
97.1% of residents of Niles speak English at home. of residents speak Spanish at home (41% speak English very well , 31% speak English well , 27% speak English not well ).of residents speak other Indo-European language at home (66% speak English very well , 23% speak English well , 10% speak English not well ).of residents speak Asian or Pacific Island language at home (40% speak English very well , 31% speak English well , 30% speak English not well ).of residents speak other language at home (100% speak English well ).
Foreign born population: 283 (1.6%)of them are naturalized citizens )
Median number of rooms in houses and condos:
Median number of rooms in apartments
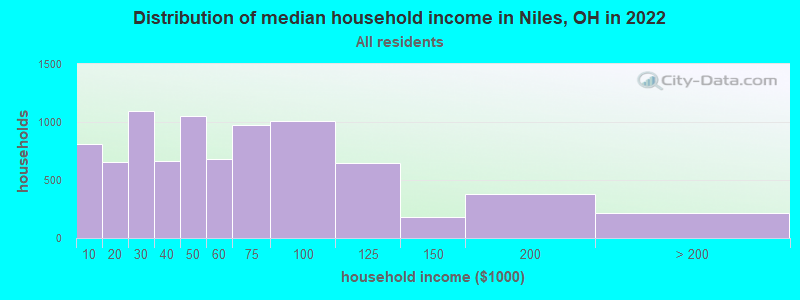
Niles, OH household income distribution 811 Less than $10,000651 $10,000 to $19,9991,091 $20,000 to $29,999668 $30,000 to $39,9991,053 $40,000 to $49,999680 $50,000 to $59,999971 $60,000 to $74,9991,008 $75,000 to $99,999645 $100,000 to $124,999184 $125,000 to $149,999376 $150,000 to $199,999218 $200,000 or more
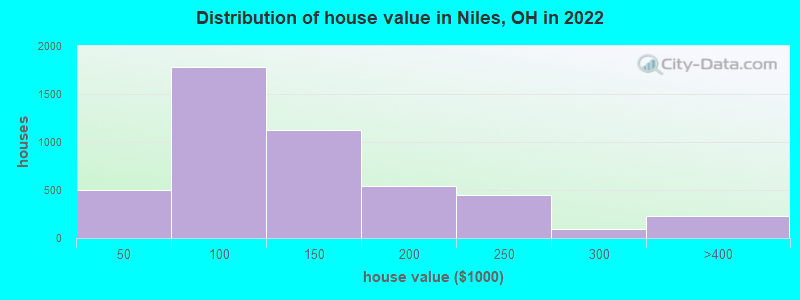
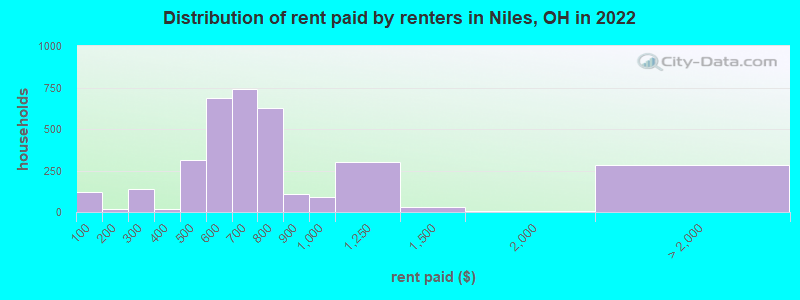
Home value of owner - occupied houses in 2022 in Niles, OH 55 Less than $10,00017 $10,000 to $14,99970 $15,000 to $19,99945 $20,000 to $24,99918 $25,000 to $29,999119 $30,000 to $34,99947 $35,000 to $39,999123 $40,000 to $49,999143 $50,000 to $59,999318 $60,000 to $69,999277 $70,000 to $79,999421 $80,000 to $89,999499 $90,000 to $99,999847 $100,000 to $124,999278 $125,000 to $149,999406 $150,000 to $174,999137 $175,000 to $199,999447 $200,000 to $249,99997 $250,000 to $299,999232 $300,000 to $399,999Rent paid by renters in 2022 in Niles, OH 117 Less than $10021 $150 to $199108 $200 to $24932 $250 to $29910 $300 to $3497 $350 to $399146 $400 to $449166 $450 to $499175 $500 to $549510 $550 to $599493 $600 to $649243 $650 to $699515 $700 to $749113 $750 to $799109 $800 to $89990 $900 to $999300 $1,000 to $1,24933 $1,250 to $1,4994 $1,500 to $1,99912 $2,000 to $2,4996 $2,500 to $2,99970 $3,000 to $3,499194 No cash rent
Percentage of workers working in this county: 69.3%Number of people working at home: 194 (2.3% of all workers )
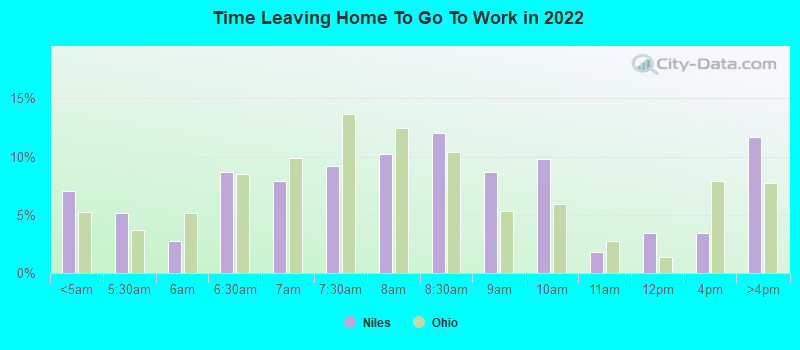
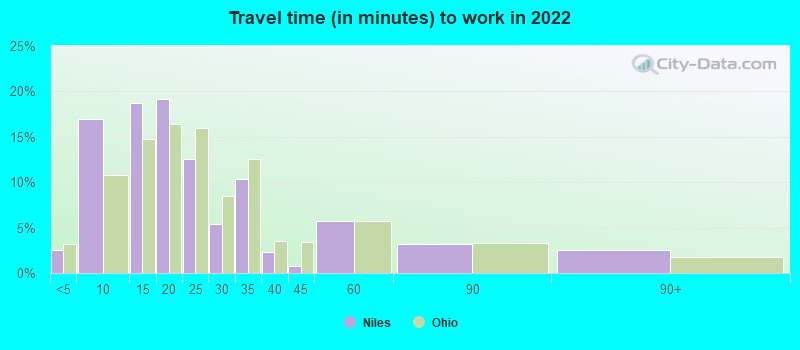
Travel time to work (commute)
Less than 5 minutes: 1685 to 9 minutes: 1,40710 to 14 minutes: 1,54115 to 19 minutes: 1,33620 to 24 minutes: 1,43225 to 29 minutes: 62930 to 34 minutes: 52935 to 39 minutes: 27340 to 44 minutes: 11245 to 59 minutes: 25060 to 89 minutes: 18290 or more minutes: 306
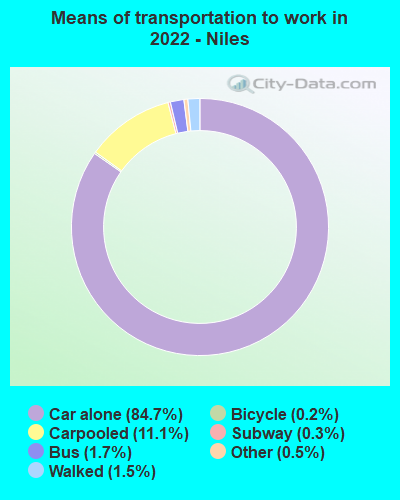
Means of transportation to work:
Drove a car alone: 7,342 (82.2%)Carpooled: 1,081 (12.1%)Bus : 97 (1.1%)Long-distance train or commuter rail : 26 (0.3%)Taxi: 53 (0.6%)Bicycle: 22 (0.2%)Walked: 99 (1.1%)Worked at home: 194 (2.2%)
Unemployment by race in 2022
Unemployment rate for White non-Hispanic residents 7.1% Males3.5% FemalesUnemployment rate for two or more race residents 10.5% Males
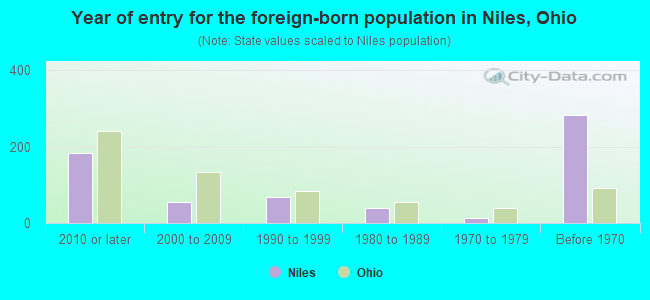
Year of entry for the foreign-born population in Niles, Ohio
183 2010 or later 55 2000 to 2009 69 1990 to 1999 40 1980 to 1989 14 1970 to 1979 283 Before 1970
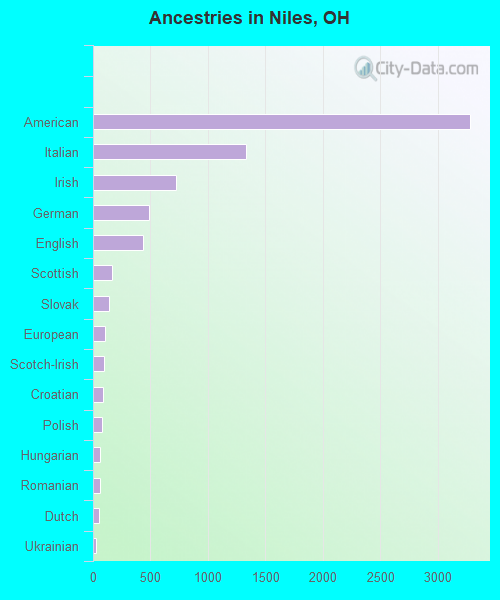
First ancestries reported:
American: 3,281 (37.7%)
Italian: 1,329 (15.3%)
Irish: 726 (8.4%)
German: 485 (5.6%)
English: 437 (5.0%)
Scottish: 162 (1.9%)
Slovak: 142 (1.6%)
European: 104 (1.2%)
Scotch-Irish: 94 (1.1%)
Croatian: 88 (1.0%)
Polish: 76 (0.9%)
Hungarian: 61 (0.7%)
Romanian: 60 (0.7%)
Dutch: 49 (0.6%)
Ukrainian: 30 (0.3%)
Eastern European: 23 (0.3%)
Welsh: 19 (0.2%)
Danish: 16 (0.2%)
Norwegian: 14 (0.2%)
Greek: 12 (0.1%)
British: 11 (0.1%)
Finnish: 10 (0.1%)
Russian: 10 (0.1%)
Slovene: 7 (0.08%)
Swedish: 5 (0.06%)
Czechoslovakian: 3 (0.03%) Most common places of birth for foreign-born residents (%): Philippines Niles:
39.0% (146)Ohio:
3.1% (17,818)
Vietnam Niles:
10.2% (38)Ohio:
1.9% (10,960)
Guatemala Niles:
6.7% (25)Ohio:
1.6% (9,312)
Italy Niles:
5.9% (22)Ohio:
1.2% (6,679)
Japan Niles:
4.8% (18)Ohio:
1.4% (8,101)
Netherlands Niles:
4.5% (17)Ohio:
0.3% (1,793)
Colombia Niles:
4.5% (17)Ohio:
0.8% (4,549)
India Niles:
4.3% (16)Ohio:
11.6% (66,525)
Germany Niles:
4.0% (15)Ohio:
2.2% (12,846)
Mexico Niles:
2.4% (9)Ohio:
7.8% (44,796)
Place of birth for U.S.-born residents:
This state: 13,773Other state: 3,713Northeast: 2,082Midwest: 292South: 902West: 407 87.5% of Niles residents lived in the same house 1 years ago.
Out of people who lived in different houses, 35.4% lived in this county.
Out of people who lived in different counties, 58.6% lived in Ohio.
Niles:
87.5%State average:
87.8%
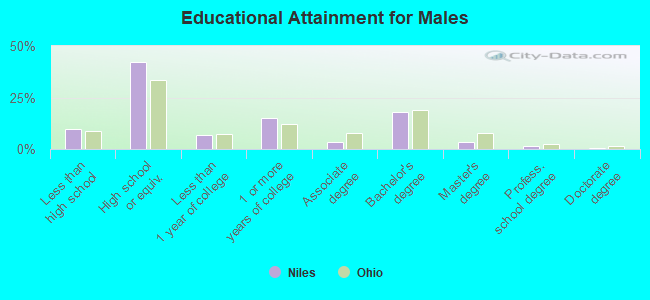
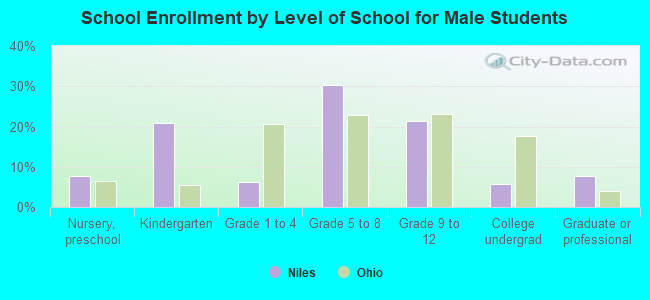
Education attainment for males 25 years and older:
No schooling: 99Nursery to 4th grade: 05th and 6th grade: 47th and 8th grade: 469th grade: 14310th grade: 8511th grade: 10512th grade, no diploma: 142High school graduate (or equivalency): 2,736Less than 1 year of college: 443Some college more than 1 year, no degree: 961Associate degree: 229Bachelor's degree: 1,170Master's degree: 224Professional school degree: 79Doctorate degree: 23
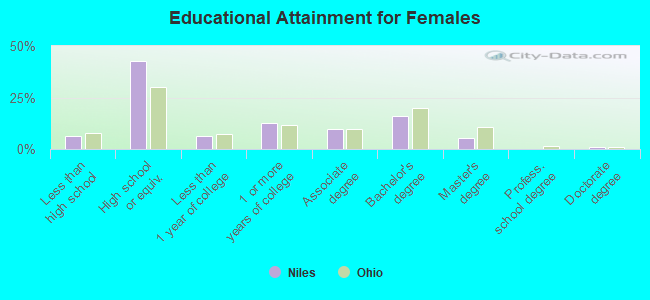
Education attainment for females 25 years and older:
No schooling: 71Nursery to 4th grade: 115th and 6th grade: 267th and 8th grade: 199th grade: 3310th grade: 8011th grade: 12412th grade, no diploma: 67High school graduate (or equivalency): 2,937Less than 1 year of college: 443Some college more than 1 year, no degree: 859Associate degree: 657Bachelor's degree: 1,103Master's degree: 382Professional school degree: 10Doctorate degree: 64
Housing units in structures:
One, detached: 6,093One, attached: 268Two: 4493 or 4: 3955 to 9: 43010 to 19: 48920 to 49: 32950 or more: 834Mobile homes: 125Boats, RVs, vans, etc.: 16Median worth of mobile homes: $14,629
Housing units lacking complete plumbing facilities in 2022: 0.4%Housing units lacking complete kitchen facilities in 2022: 5.3%House/condo owner moved in on average 18 years ago
Renter moved in on average 1 years ago
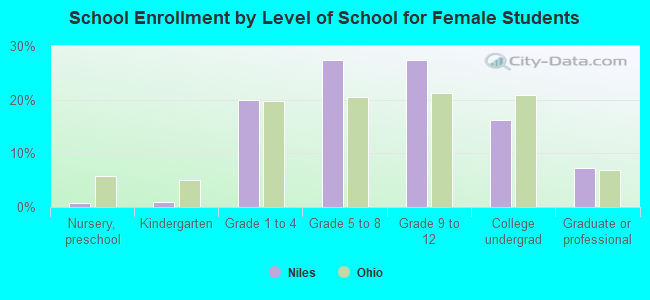
Private vs. public school enrollment:
Students in private schools in grades 1 to 8 (elementary and middle school): 44 Students in private schools in grades 9 to 12 (high school): 115 Students in private undergraduate colleges: 24