Housing density: 2,987 houses/condos per square mile
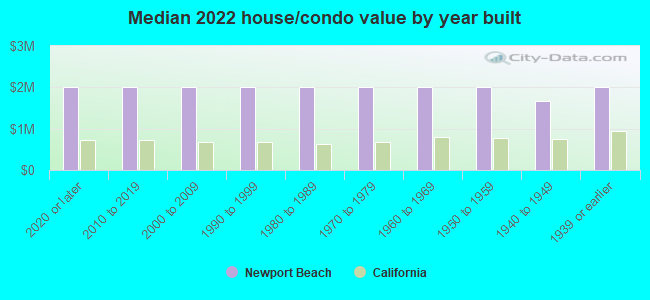
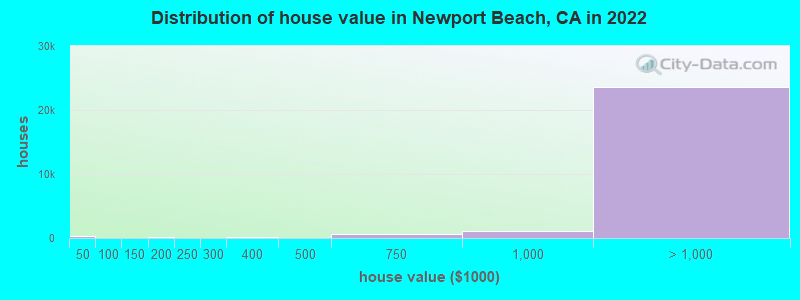
Median price asked for vacant for-sale houses and condos in 2022: $2,839,944.
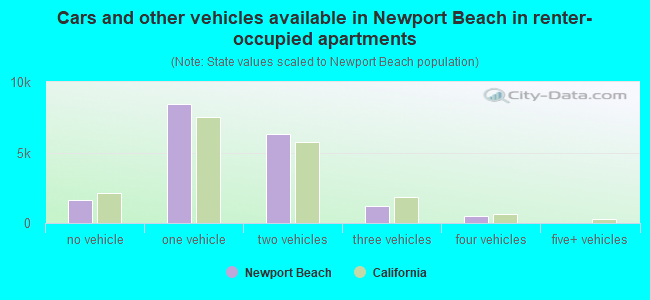
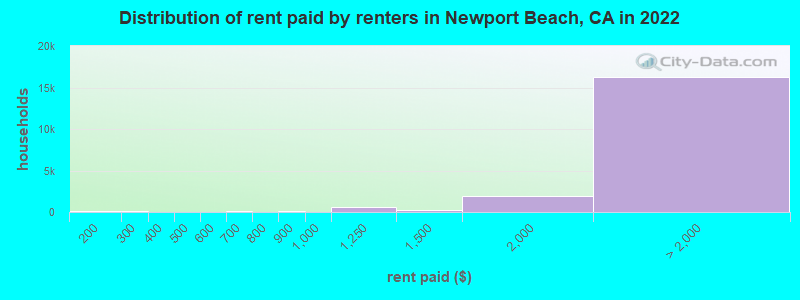
Median contract rent in 2022: over $2,000 (lower quartile is over $2,000, upper quartile is over $2,000)
Median rent asked for vacant for-rent units in 2022: $4,106
Median gross rent in Newport Beach, CA in 2022: over $2,000
Housing units in Newport Beach with a mortgage: 11,598 (1,523 second mortgage, 0 home equity loan, 1,479 both second mortgage and home equity loan) Houses without a mortgage: 289
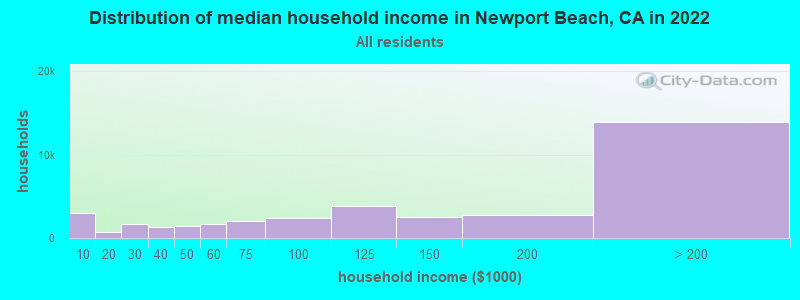
Median household income for houses/condos with a mortgage: $250,001
Median household income for apartments without a mortgage: $126,450
Median monthly housing costs: $3,342
Compare current foreclosures in Newport Beach, CA:
9,928 married couples with children.
3,215 single-parent households (1,016 men, 2,199 women).
80.1% of residents of Newport Beach speak English at home.
5.5% of residents speak Spanish at home (80% speak English very well, 12% speak English well, 7% speak English not well, 1% don't speak English at all).
8.7% of residents speak other Indo-European language at home (86% speak English very well, 8% speak English well, 3% speak English not well, 2% don't speak English at all).
4.8% of residents speak Asian or Pacific Island language at home (60% speak English very well, 27% speak English well, 12% speak English not well, 1% don't speak English at all).
0.4% of residents speak other language at home (89% speak English very well, 4% speak English well, 7% speak English not well).
Foreign born population: 12,533 (14.9%)
(57.9% of them are naturalized citizens)
Percentage of workers working in this county: 94.2% Number of people working at home: 12,369 (28.7% of all workers)
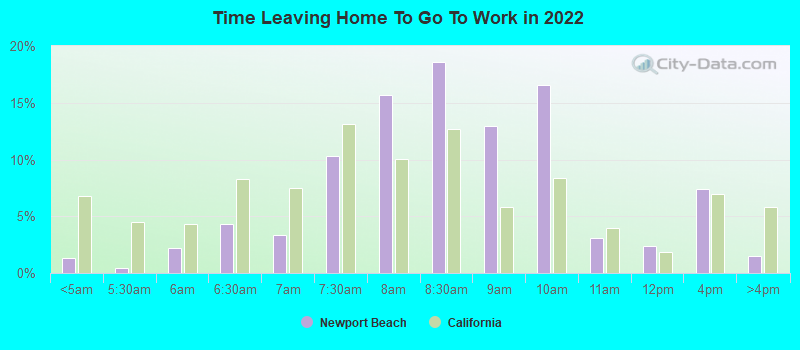
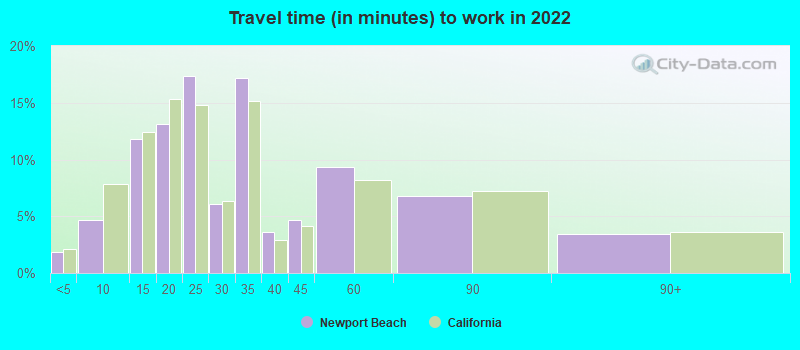
Travel time to work (commute)
Less than 5 minutes: 947
5 to 9 minutes: 2,661
10 to 14 minutes: 6,194
15 to 19 minutes: 6,317
20 to 24 minutes: 4,981
25 to 29 minutes: 1,839
30 to 34 minutes: 2,624
35 to 39 minutes: 394
40 to 44 minutes: 45
45 to 59 minutes: 1,350
60 to 89 minutes: 788
90 or more minutes: 339
Means of transportation to work:
Drove a car alone: 63,987 (73.9%)
Carpooled: 6,691 (7.7%)
Bus: 504 (0.6%)
Long-distance train or commuter rail: 22 (0.0%)
Taxi: 1,124 (1.3%)
Bicycle: 473 (0.5%)
Walked: 851 (1.0%)
Worked at home: 12,369 (14.3%)
Unemployment by race in 2022
Unemployment rate for White non-Hispanic residents
1.4%Males
5.4%Females
Unemployment rate for Asian residents
0.3%Males
0.7%Females
Unemployment rate for other race residents
3.5%Males
Unemployment rate for two or more race residents
2.7%Males
3.8%Females
Unemployment rate for Hispanic or Latino residents
2.0%Males
1.9%Females
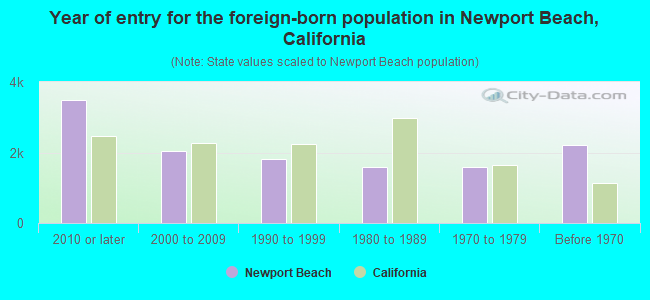
Year of entry for the foreign-born population in Newport Beach, California
3,4822010 or later
2,0472000 to 2009
1,8091990 to 1999
1,5811980 to 1989
1,5871970 to 1979
2,207Before 1970
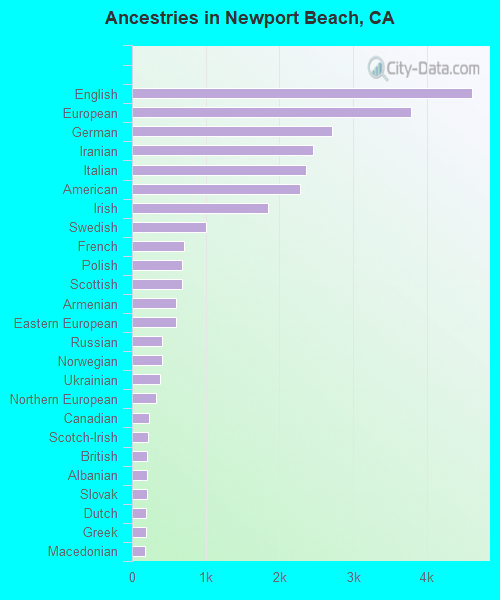
First ancestries reported:
English: 4,612 (10.8%)
European: 3,782 (8.9%)
German: 2,713 (6.3%)
Iranian: 2,451 (5.7%)
Italian: 2,359 (5.5%)
American: 2,278 (5.3%)
Irish: 1,851 (4.3%)
Swedish: 1,009 (2.4%)
French: 706 (1.7%)
Polish: 684 (1.6%)
Scottish: 678 (1.6%)
Armenian: 600 (1.4%)
Eastern European: 592 (1.4%)
Russian: 410 (1.0%)
Norwegian: 407 (1.0%)
Ukrainian: 376 (0.9%)
Northern European: 325 (0.8%)
Canadian: 237 (0.6%)
Scotch-Irish: 216 (0.5%)
British: 210 (0.5%)
Albanian: 199 (0.5%)
Slovak: 199 (0.5%)
Dutch: 195 (0.5%)
Greek: 191 (0.4%)
Macedonian: 180 (0.4%)
Welsh: 172 (0.4%)
Portuguese: 155 (0.4%)
Danish: 134 (0.3%)
Scandinavian: 128 (0.3%)
Turkish: 113 (0.3%)
Czech: 108 (0.3%)
Austrian: 108 (0.3%)
Hungarian: 97 (0.2%)
Lebanese: 85 (0.2%)
French Canadian: 73 (0.2%)
Romanian: 66 (0.2%)
Lithuanian: 64 (0.1%)
Jordanian: 62 (0.1%)
Australian: 58 (0.1%)
Egyptian: 51 (0.1%)
Brazilian: 47 (0.1%)
Arab: 44 (0.1%)
Maltese: 42 (0.10%)
Croatian: 37 (0.09%)
Syrian: 35 (0.08%)
Latvian: 27 (0.06%)
Finnish: 24 (0.06%)
Ethiopian: 24 (0.06%)
Swiss: 23 (0.05%)
Haitian: 21 (0.05%)
Iraqi: 19 (0.04%)
New Zealander: 19 (0.04%)
Icelander: 15 (0.04%)
Yugoslavian: 15 (0.04%)
Cajun: 9 (0.02%)
Slovene: 9 (0.02%)
Czechoslovakian: 8 (0.02%)
Belgian: 8 (0.02%)
Pennsylvania German: 6 (0.01%)
Bulgarian: 3 (0.01%)
Most common places of birth for foreign-born residents (%):
Iran
Newport Beach:
13.0% (1,677)
California:
2.0% (206,004)
Canada
Newport Beach:
8.3% (1,077)
California:
1.2% (127,477)
Mexico
Newport Beach:
8.0% (1,039)
California:
37.2% (3,881,193)
Vietnam
Newport Beach:
5.9% (761)
California:
4.9% (512,335)
India
Newport Beach:
5.3% (687)
California:
5.2% (539,184)
Taiwan
Newport Beach:
4.9% (635)
California:
1.7% (176,274)
Korea
Newport Beach:
4.5% (583)
California:
3.0% (315,248)
France
Newport Beach:
3.8% (495)
California:
0.4% (40,224)
China, excluding Hong Kong and Taiwan
Newport Beach:
3.7% (481)
California:
6.6% (684,672)
England
Newport Beach:
3.1% (403)
California:
0.6% (57,953)
Turkey
Newport Beach:
2.8% (357)
California:
0.2% (20,474)
Czechoslovakia (includes Czech Republic and Slovakia)
Newport Beach:
2.5% (326)
California:
0.1% (9,241)
Philippines
Newport Beach:
2.4% (315)
California:
7.8% (818,297)
United Kingdom, excluding England and Scotland
Newport Beach:
2.1% (278)
California:
0.6% (60,582)
Indonesia
Newport Beach:
1.8% (231)
California:
0.4% (39,097)
Argentina
Newport Beach:
1.7% (225)
California:
0.3% (33,960)
Russia
Newport Beach:
1.7% (224)
California:
0.7% (71,932)
Australia
Newport Beach:
1.7% (218)
California:
0.2% (23,338)
Place of birth for U.S.-born residents:
This state: 49,347
Other state: 21,139
Northeast: 6,284
Midwest: 8,317
South: 3,145
West: 3,393
83.3% of Newport Beach residents lived in the same house 1 years ago. Out of people who lived in different houses, 37.8% lived in this county. Out of people who lived in different counties, 50.8% lived in California.
Newport Beach:
83.3%
State average:
88.9%
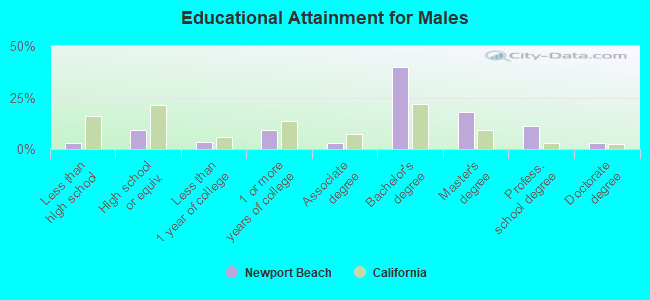
Education attainment for males 25 years and older:
No schooling: 451
Nursery to 4th grade: 0
5th and 6th grade: 89
7th and 8th grade: 62
9th grade: 75
10th grade: 94
11th grade: 0
12th grade, no diploma: 90
High school graduate (or equivalency): 2,550
Less than 1 year of college: 976
Some college more than 1 year, no degree: 2,640
Associate degree: 817
Bachelor's degree: 11,139
Master's degree: 5,096
Professional school degree: 3,189
Doctorate degree: 782
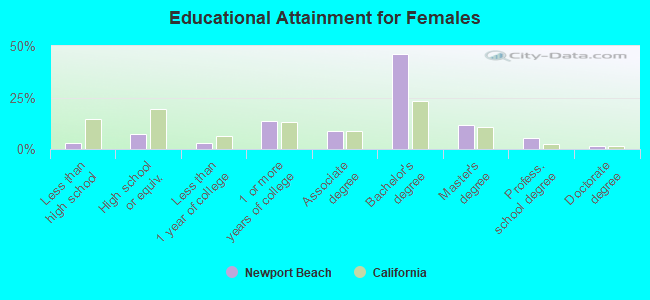
Education attainment for females 25 years and older:
No schooling: 129
Nursery to 4th grade: 0
5th and 6th grade: 83
7th and 8th grade: 0
9th grade: 0
10th grade: 115
11th grade: 167
12th grade, no diploma: 361
High school graduate (or equivalency): 2,380
Less than 1 year of college: 978
Some college more than 1 year, no degree: 4,282
Associate degree: 2,827
Bachelor's degree: 14,674
Master's degree: 3,732
Professional school degree: 1,738
Doctorate degree: 501
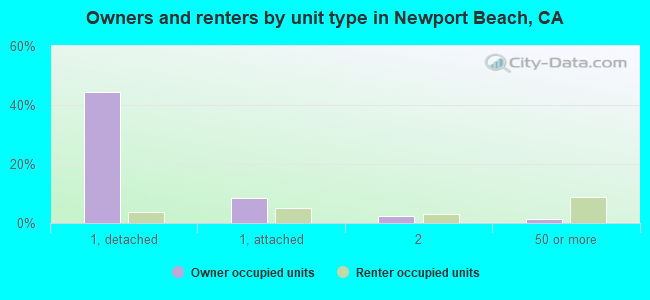
Housing units in structures:
One, detached: 19,913
One, attached: 7,578
Two: 2,639
3 or 4: 2,074
5 to 9: 2,136
10 to 19: 1,679
20 to 49: 1,051
50 or more: 6,131
Mobile homes: 938
Housing units lacking complete plumbing facilities in 2022: 0.3%
Housing units lacking complete kitchen facilities in 2022: 0.6%
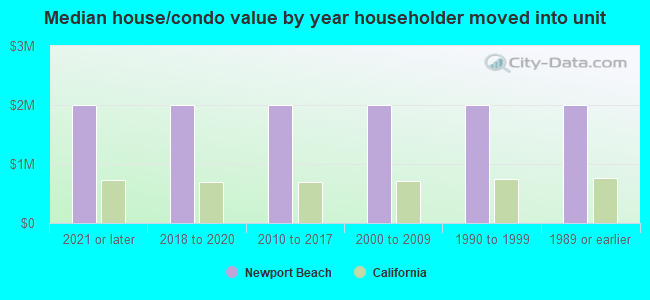
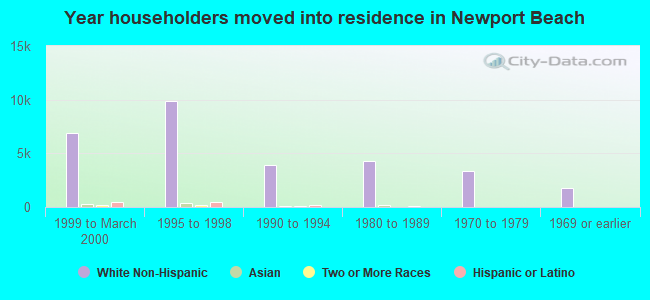
House/condo owner moved in on average 12 years ago