Housing density: 1,127 houses/condos per square mile
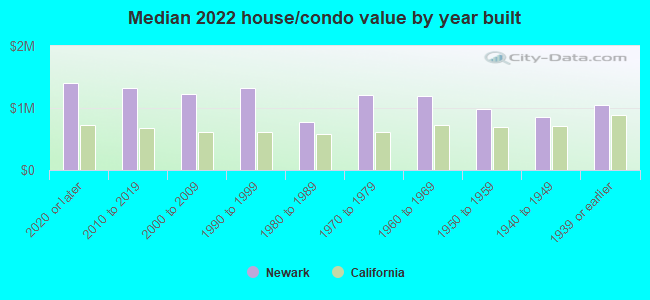
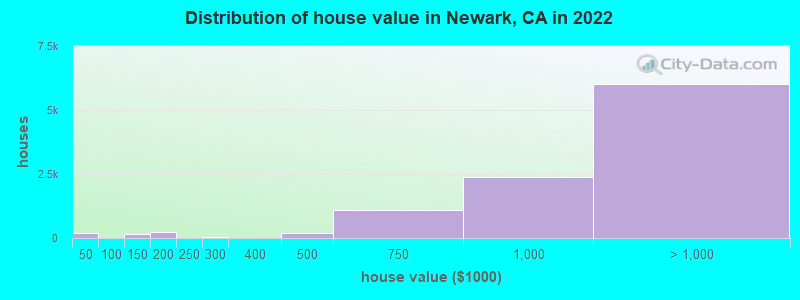
Median price asked for vacant for-sale houses and condos in 2022: $1,041,491.
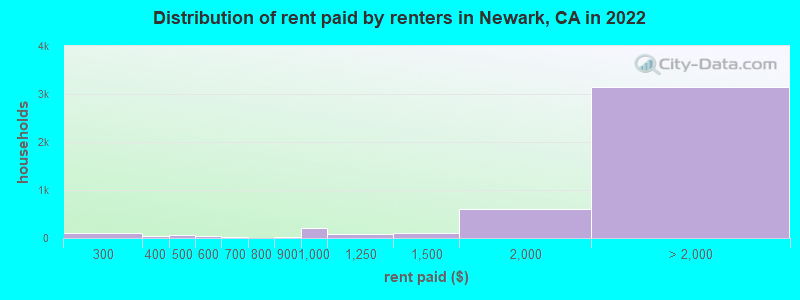
Median contract rent in 2022: over $2,000 (lower quartile is $1,867, upper quartile is over $2,000)
Median rent asked for vacant for-rent units in 2022: $2,372
Median gross rent in Newark, CA in 2022: over $2,000
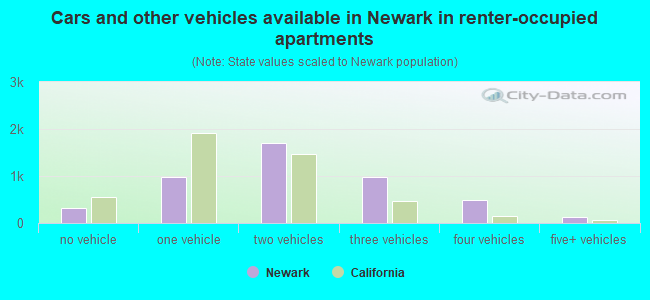
Housing units in Newark with a mortgage: 8,148 (844 second mortgage, 24 home equity loan, 639 both second mortgage and home equity loan) Houses without a mortgage: 182
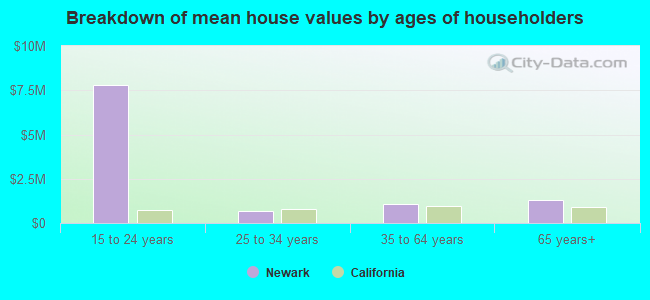
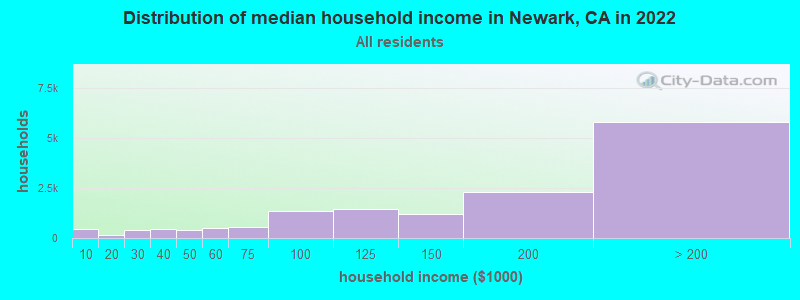
Median household income for houses/condos with a mortgage: $222,889
Median household income for apartments without a mortgage: $116,114
6,281 married couples with children.
1,247 single-parent households (335 men, 912 women).
42.6% of residents of Newark speak English at home.
19.8% of residents speak Spanish at home (62% speak English very well, 20% speak English well, 14% speak English not well, 5% don't speak English at all).
11.4% of residents speak other Indo-European language at home (77% speak English very well, 18% speak English well, 4% speak English not well, 1% don't speak English at all).
25.7% of residents speak Asian or Pacific Island language at home (60% speak English very well, 22% speak English well, 14% speak English not well, 4% don't speak English at all).
0.4% of residents speak other language at home (82% speak English very well, 12% speak English well, 6% speak English not well).
Foreign born population: 20,281 (43.6%)
(55.7% of them are naturalized citizens)
Percentage of workers working in this county: 68.1% Number of people working at home: 6,915 (28.2% of all workers)
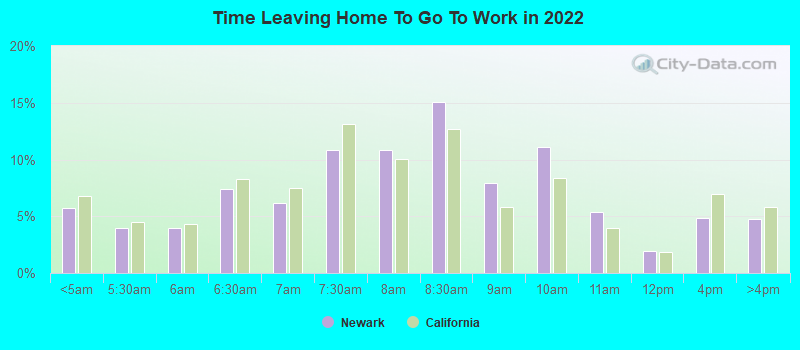
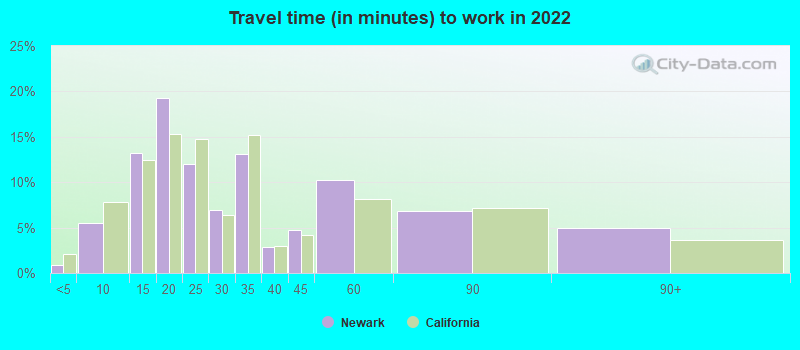
Travel time to work (commute)
Less than 5 minutes: 121
5 to 9 minutes: 1,213
10 to 14 minutes: 1,772
15 to 19 minutes: 2,230
20 to 24 minutes: 2,677
25 to 29 minutes: 1,019
30 to 34 minutes: 3,240
35 to 39 minutes: 501
40 to 44 minutes: 1,170
45 to 59 minutes: 2,234
60 to 89 minutes: 1,368
90 or more minutes: 313
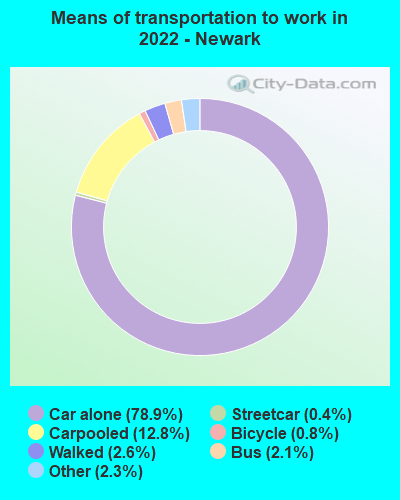
Means of transportation to work:
Drove a car alone: 13,223 (56.3%)
Carpooled: 2,239 (9.5%)
Bus: 291 (1.2%)
Subway or elevated rail: 52 (0.2%)
Long-distance train or commuter rail: 12 (0.1%)
Taxi: 403 (1.7%)
Bicycle: 155 (0.7%)
Walked: 445 (1.9%)
Worked at home: 6,915 (29.5%)
Unemployment by race in 2022
Unemployment rate for White non-Hispanic residents
1.9%Males
2.0%Females
Unemployment rate for Black residents
2.2%Males
Unemployment rate for American Indian and Alaska Native residents
3.4%Males
8.2%Females
Unemployment rate for Asian residents
3.4%Males
3.8%Females
Unemployment rate for other race residents
3.0%Males
9.1%Females
Unemployment rate for two or more race residents
7.0%Males
4.1%Females
Unemployment rate for Hispanic or Latino residents
5.1%Males
8.3%Females
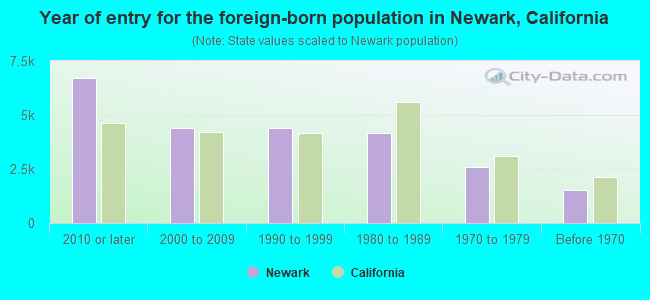
Year of entry for the foreign-born population in Newark, California
6,7282010 or later
4,4022000 to 2009
4,3931990 to 1999
4,1881980 to 1989
2,6011970 to 1979
1,531Before 1970
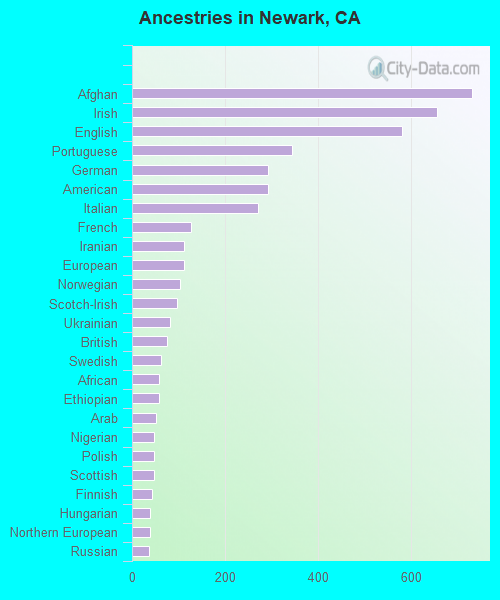
First ancestries reported:
Afghan: 732 (2.4%)
Irish: 657 (2.1%)
English: 581 (1.9%)
Portuguese: 344 (1.1%)
German: 293 (0.9%)
American: 292 (0.9%)
Italian: 271 (0.9%)
French: 128 (0.4%)
Iranian: 113 (0.4%)
European: 112 (0.4%)
Norwegian: 103 (0.3%)
Scotch-Irish: 96 (0.3%)
Ukrainian: 81 (0.3%)
British: 76 (0.2%)
Swedish: 62 (0.2%)
African: 59 (0.2%)
Ethiopian: 58 (0.2%)
Arab: 51 (0.2%)
Nigerian: 48 (0.2%)
Polish: 48 (0.2%)
Scottish: 47 (0.2%)
Finnish: 42 (0.1%)
Hungarian: 39 (0.1%)
Northern European: 38 (0.1%)
Russian: 37 (0.1%)
Cajun: 31 (0.1%)
Brazilian: 30 (0.10%)
Swiss: 28 (0.09%)
Egyptian: 24 (0.08%)
Bulgarian: 17 (0.05%)
Basque: 16 (0.05%)
Romanian: 15 (0.05%)
Scandinavian: 13 (0.04%)
Israeli: 11 (0.04%)
Turkish: 10 (0.03%)
Lithuanian: 7 (0.02%)
Austrian: 6 (0.02%)
Jordanian: 5 (0.02%)
Danish: 5 (0.02%)
Yugoslavian: 5 (0.02%)
Australian: 4 (0.01%)
Slovene: 3 (0.01%)
Most common places of birth for foreign-born residents (%):
India
Newark:
22.0% (4,455)
California:
5.2% (539,184)
China, excluding Hong Kong and Taiwan
Newark:
18.8% (3,806)
California:
6.6% (684,672)
Mexico
Newark:
17.0% (3,440)
California:
37.2% (3,881,193)
Philippines
Newark:
12.7% (2,577)
California:
7.8% (818,297)
Vietnam
Newark:
3.2% (648)
California:
4.9% (512,335)
Hong Kong
Newark:
2.6% (525)
California:
1.0% (105,215)
Taiwan
Newark:
2.6% (521)
California:
1.7% (176,274)
El Salvador
Newark:
2.5% (505)
California:
4.2% (440,287)
Afghanistan
Newark:
1.8% (366)
California:
0.5% (53,260)
Place of birth for U.S.-born residents:
This state: 21,922
Other state: 3,741
Northeast: 948
Midwest: 1,189
South: 932
West: 655
89.4% of Newark residents lived in the same house 1 years ago. Out of people who lived in different houses, 35.6% lived in this county. Out of people who lived in different counties, 75.6% lived in California.
Newark:
89.4%
State average:
88.9%
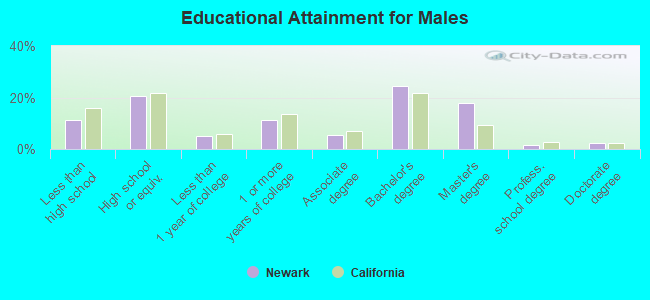
Education attainment for males 25 years and older:
No schooling: 447
Nursery to 4th grade: 160
5th and 6th grade: 122
7th and 8th grade: 110
9th grade: 220
10th grade: 148
11th grade: 162
12th grade, no diploma: 645
High school graduate (or equivalency): 3,622
Less than 1 year of college: 920
Some college more than 1 year, no degree: 2,012
Associate degree: 977
Bachelor's degree: 4,361
Master's degree: 3,134
Professional school degree: 242
Doctorate degree: 414
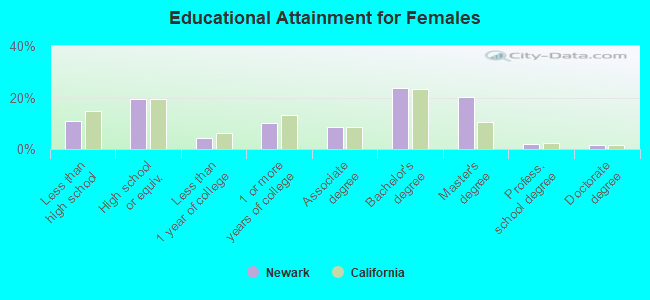
Education attainment for females 25 years and older:
No schooling: 455
Nursery to 4th grade: 171
5th and 6th grade: 278
7th and 8th grade: 113
9th grade: 264
10th grade: 92
11th grade: 71
12th grade, no diploma: 284
High school graduate (or equivalency): 3,085
Less than 1 year of college: 685
Some college more than 1 year, no degree: 1,595
Associate degree: 1,350
Bachelor's degree: 3,811
Master's degree: 3,267
Professional school degree: 280
Doctorate degree: 233
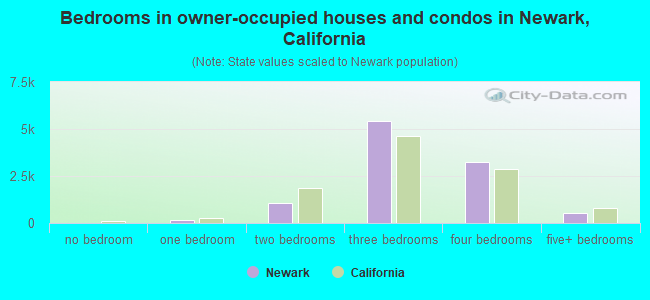
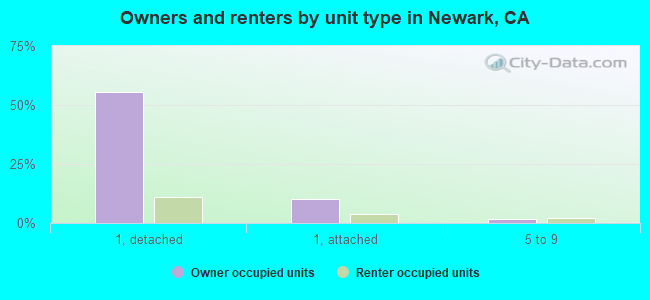
Housing units in structures:
One, detached: 10,539
One, attached: 2,058
Two: 117
3 or 4: 697
5 to 9: 710
10 to 19: 265
20 to 49: 429
50 or more: 845
Mobile homes: 81
Housing units lacking complete plumbing facilities in 2022: 0.9%
Housing units lacking complete kitchen facilities in 2022: 0.4%
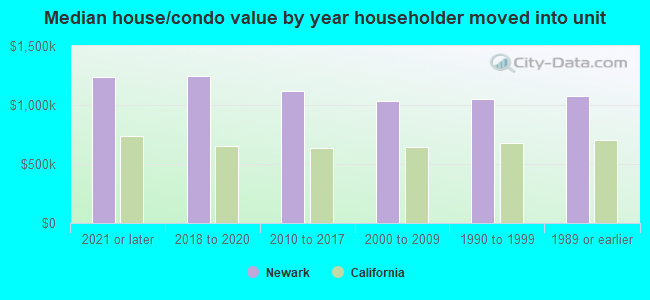
House/condo owner moved in on average 10 years ago