New Hartford, CT (Connecticut) Houses and Residents
| New Hartford: | $380,709 |
| Connecticut: | $347,200 |
Total population: 6,970 (Urban population: 798 (all inside urban clusters), Rural population: 5,290 (30 farm, 5,260 nonfarm))
Houses: 2,368 (2,228 occupied: 1,926 owner occupied, 302 renter occupied)
| % of renters here: | 14% |
| State: | 34% |
Housing density: 64 houses/condos per square mile
Median price asked for vacant for-sale houses and condos in 2022 in this county: $399,480.
Median contract rent in 2022: $1,242 (lower quartile is $969, upper quartile is $1,539)
Median rent asked for vacant for-rent units in 2022: $1,427
Median gross rent in New Hartford, CT in 2022: $1,511
Housing units in New Hartford with a mortgage: 1,288 (188 second mortgage, 282 home equity loan, 0 both second mortgage and home equity loan)
Houses without a mortgage: 349
Compare current foreclosures near New Hartford, CT:
| Photo | Address | Area | Beds / Baths | Price | Details |
|---|---|---|---|---|---|

|
#1
Main St Apt 9c
New Hartford, CT 06057
|
1,136 sq. feet
|
1 baths 2 beds |
show details | |

|
#2
Allen St
Bristol, CT 06010
|
1,092 sq. feet
|
1 baths 3 beds |
$215,000
|
show details |

|
#3
Woodbine St
Torrington, CT 06790
|
2,756 sq. feet
|
3 baths 6 beds |
$419,900
|
show details |

|
#4
Litchfield Rd
Norfolk, CT 06058
|
3,678 sq. feet
|
3 baths 6 beds |
$650,000
|
show details |

|
#5
Dowd Ave
Canton, CT 06019
|
1,190 sq. feet
|
1 baths 2 beds |
$239,900
|
show details |

|
#6
Clinton Hill Rd
Wolcott, CT 06716
|
1,828 sq. feet
|
1 baths 3 beds |
$240,000
|
show details |

|
#7
W Main St
New Britain, CT 06053
|
1,584 sq. feet
|
2 baths 4 beds |
show details | |

|
#8
Cornwall St
Hartford, CT 06112
|
1,248 sq. feet
|
1 baths 3 beds |
show details | |

|
#9
Parents Way
Bloomfield, CT 06002
|
1,230 sq. feet
|
3 baths 4 beds |
show details | |

|
#10
Benton St
Winsted, CT 06098
|
1,109 sq. feet
|
2 baths 2 beds |
show details |
| Photo | Address | Area | Beds / Baths | Price | Details |
|---|---|---|---|---|---|

|
#11
Melinda Ln
Bristol, CT 06010
|
- sq. feet
|
2 baths 4 beds |
show details | |

|
#12
Harvest Ln
Windsor, CT 06095
|
1,322 sq. feet
|
2 baths 3 beds |
show details | |

|
#13
Farmington Chase Cre
Farmington, CT 06032
|
1,317 sq. feet
|
1 baths 2 beds |
show details | |

|
#14
Litchfield Rd
Harwinton, CT 06791
|
2,216 sq. feet
|
1 baths 3 beds |
show details | |

|
#15
Park Ave
Windsor, CT 06095
|
969 sq. feet
|
2 baths 3 beds |
show details | |

|
#16
Marcia Dr
Torrington, CT 06790
|
1,496 sq. feet
|
2 baths 4 beds |
show details | |

|
#17
Surrey Dr
Bristol, CT 06010
|
1,079 sq. feet
|
1 baths 3 beds |
show details | |

|
#18
Horne Cir
Southington, CT 06489
|
1,902 sq. feet
|
2 baths 4 beds |
show details | |

|
#19
White Pine Rd
Torrington, CT 06790
|
1,536 sq. feet
|
2 baths 3 beds |
show details | |

|
#20
Strong Ter
Winsted, CT 06098
|
1,590 sq. feet
|
1 baths 4 beds |
show details |
| Photo | Address | Area | Beds / Baths | Price | Details |
|---|---|---|---|---|---|

|
#21
Ridgewood Rd
West Hartford, CT 06107
|
1,590 sq. feet
|
1 baths 3 beds |
show details | |

|
#22
Pine St
Bristol, CT 06010
|
835 sq. feet
|
1 baths 3 beds |
show details | |

|
#23
W Main St
Plainville, CT 06062
|
900 sq. feet
|
1 baths 3 beds |
show details | |

|
#24
E Maxwell Dr
West Hartford, CT 06107
|
1,222 sq. feet
|
1 baths 3 beds |
show details | |

|
#25
Fairbanks St
Plainville, CT 06062
|
968 sq. feet
|
2 baths 2 beds |
show details | |

|
#26
Lakeview Rd
Terryville, CT 06786
|
1,012 sq. feet
|
1 baths 3 beds |
show details | |

|
#27
Branch Rd Unit 8e
Thomaston, CT 06787
|
1,128 sq. feet
|
1 baths 2 beds |
show details | |

|
#28
Fall Mountain Ter
Terryville, CT 06786
|
912 sq. feet
|
1 baths 3 beds |
show details | |

|
#29
Sweetbrier Rd
East Granby, CT 06026
|
1,470 sq. feet
|
1 baths 3 beds |
show details | |

|
#30
Cedar Mountain Rd
Thomaston, CT 06787
|
1,404 sq. feet
|
2 baths 2 beds |
show details |
| Photo | Address | Area | Beds / Baths | Price | Details |
|---|---|---|---|---|---|

|
#31
Loomis St
North Granby, CT 06060
|
1,616 sq. feet
|
2 baths 4 beds |
show details | |

|
#32
Emmett St Apt 78
Bristol, CT 06010
|
900 sq. feet
|
1 baths 2 beds |
show details | |

|
#33
Watch Tower Rd
Plymouth, CT 06782
|
2,036 sq. feet
|
3 baths 3 beds |
show details | |

|
#34
Howe Rd
New Britain, CT 06053
|
1,263 sq. feet
|
1 baths 3 beds |
show details | |

|
#35
Loren Cir
Windsor, CT 06095
|
1,293 sq. feet
|
2 baths 3 beds |
show details | |

|
#36
Country Club Rd
New Britain, CT 06053
|
1,080 sq. feet
|
1 baths 3 beds |
show details | |

|
#37
S Washington St
Plainville, CT 06062
|
1,594 sq. feet
|
1 baths 4 beds |
show details | |

|
#38
Gunhill Rd
New Britain, CT 06053
|
832 sq. feet
|
1 baths 3 beds |
show details | |

|
#39
Stonegate Rd
New Britain, CT 06053
|
954 sq. feet
|
1 baths 2 beds |
show details | |

|
#40
Yew Pl
New Britain, CT 06053
|
1,220 sq. feet
|
1 baths 3 beds |
show details |
| Photo | Address | Area | Beds / Baths | Price | Details |
|---|---|---|---|---|---|

|
#41
Hillhurst Ave
New Britain, CT 06053
|
1,196 sq. feet
|
1 baths 3 beds |
show details | |

|
#42
W Point Ter
West Hartford, CT 06107
|
1,082 sq. feet
|
1 baths 3 beds |
show details | |

|
#43
Beaman Brk
Bloomfield, CT 06002
|
1,344 sq. feet
|
2 baths 2 beds |
show details | |

|
#44
E Normandy Dr
West Hartford, CT 06107
|
1,597 sq. feet
|
2 baths 4 beds |
show details | |

|
#45
Birch St
Bristol, CT 06010
|
1,188 sq. feet
|
1 baths 2 beds |
show details | |

|
#46
Oakland Ave
New Britain, CT 06053
|
2,332 sq. feet
|
2 baths 6 beds |
show details | |

|
#47
Hamlin Dr
West Hartford, CT 06117
|
1,696 sq. feet
|
2 baths 3 beds |
show details | |

|
#48
Chestnut St
Bristol, CT 06010
|
2,644 sq. feet
|
3 baths 4 beds |
show details | |

|
#49
Northwest Dr
Plainville, CT 06062
|
2,088 sq. feet
|
2 baths 4 beds |
show details | |

|
Check over 1 million property listings on Foreclosure.com!
|
browse all offers | |||


Household type by relationship:
Households: 187,123- In family households: 156,490 (36,561 male householders, 14,969 female householders)
41,185 spouses, 52,814 children (49,404 natural, 1,325 adopted, 2,085 stepchildren), 2,365 grandchildren, 1,073 brothers or sisters, 1,650 parents, foster children, 1,216 other relatives, 3,500 non-relatives
- In nonfamily households: 30,633 (11,692 male householders (9,019 living alone)), 13,418 female householders (11,384 living alone)), 5,523 nonrelatives
- In group quarters: 2,804 (1,566 institutionalized population)
34,479 married couples with children.
7,472 single-parent households (1,895 men, 5,577 women).
96.9% of residents of New Hartford speak English at home.
0.3% of residents speak Spanish at home (100% speak English very well).
2.5% of residents speak other Indo-European language at home (80% speak English very well, 20% speak English well).
0.2% of residents speak other language at home (50% speak English well, 50% speak English not well).
Foreign born population: 434 (6.0%)
(73.5% of them are naturalized citizens)
| Here: | 8.3 |
| State: | 6.5 |
| Here: | 3.5 |
| State: | 4.0 |

- Bedrooms in owner-occupied houses and condos in New Hartford, Connecticut
- 0no bedroom
- 261 bedroom
- 2852 bedrooms
- 1,0233 bedrooms
- 5594 bedrooms
- 335+ bedrooms

- Bedrooms in renter-occupied apartments in New Hartford, Connecticut
- 0no bedroom
- 1231 bedroom
- 872 bedrooms
- 653 bedrooms
- 274 bedrooms
- 05+ bedrooms

- Cars and other vehicles available in New Hartford in owner-occupied houses/condos
- 31no vehicle
- 2571 vehicle
- 1,0552 vehicles
- 4873 vehicles
- 764 vehicles
- 205+ vehicles

- Cars and other vehicles available in New Hartford in renter-occupied apartments
- 0no vehicle
- 1331 vehicle
- 1412 vehicles
- 83 vehicles
- 104 vehicles
- 105+ vehicles

- Rooms in owner-occupied houses in New Hartford, Connecticut
- 01 room
- 182 rooms
- 83 rooms
- 414 rooms
- 2405 rooms
- 4506 rooms
- 4487 rooms
- 4048 rooms
- 3179+ rooms

- Rooms in renter-occupied apartments in New Hartford, Connecticut
- 01 room
- 552 rooms
- 823 rooms
- 404 rooms
- 795 rooms
- 186 rooms
- 187 rooms
- 108 rooms
- 09+ rooms


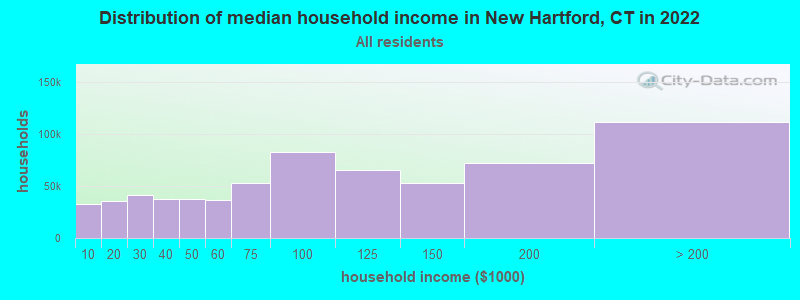
New Hartford, CT household income distribution

- 16,416Less than $10,000
- 17,290$10,000 to $19,999
- 20,926$20,000 to $29,999
- 20,705$30,000 to $39,999
- 19,408$40,000 to $49,999
- 20,214$50,000 to $59,999
- 31,639$60,000 to $74,999
- 48,006$75,000 to $99,999
- 40,414$100,000 to $124,999
- 32,398$125,000 to $149,999
- 45,274$150,000 to $199,999
- 74,262$200,000 or more
Percentage of workers working in this county: 45.8%
Number of people working at home: 685 (18.3% of all workers)
Travel time to work (commute)
- Less than 5 minutes: 123
- 5 to 9 minutes: 145
- 10 to 14 minutes: 437
- 15 to 19 minutes: 316
- 20 to 24 minutes: 362
- 25 to 29 minutes: 211
- 30 to 34 minutes: 442
- 35 to 39 minutes: 227
- 40 to 44 minutes: 162
- 45 to 59 minutes: 512
- 60 to 89 minutes: 117
- 90 or more minutes: 67
Means of transportation to work:
- Drove a car alone: 2,804 (87.3%)
- Carpooled: 179 (5.6%)
- Bus or trolley bus: 65 (2.0%)
- Walked: 55 (1.7%)
- Other means: 18 (0.6%)
- Worked at home: 91 (2.8%)

- Year of entry for the foreign-born population in New Hartford, Connecticut
- 251995 to March 2000
- 171990 to 1994
- 361985 to 1989
- 331980 to 1984
- 401975 to 1979
- 291970 to 1974
- 211965 to 1969
- 63Before 1965

First ancestries reported:
- English: 1,334 (15.9%)
- Italian: 1,158 (13.8%)
- Irish: 1,056 (12.6%)
- German: 904 (10.8%)
- Polish: 895 (10.7%)
- French: 640 (7.6%)
- Other: 538 (6.4%)
- French Canadian: 361 (4.3%)
- United States: 267 (3.2%)
- Swedish: 261 (3.1%)
- Russian: 174 (2.1%)
- Scottish: 119 (1.4%)
- Lithuanian: 117 (1.4%)
- Scotch-Irish: 86 (1.0%)
- Arab: 80 (1.0%)
- Slovak: 53 (0.6%)
- Hungarian: 51 (0.6%)
- Dutch: 45 (0.5%)
- Welsh: 45 (0.5%)
- Czech: 40 (0.5%)
- Norwegian: 31 (0.4%)
- Swiss: 29 (0.3%)
- Danish: 27 (0.3%)
- Subsaharan African: 24 (0.3%)
- Portuguese: 17 (0.2%)
- Ukrainian: 17 (0.2%)
Most common places of birth for foreign-born residents (%):
| New Hartford: | 25.0% (66) |
| Connecticut: | 5.2% (19,083) |
| New Hartford: | 17.4% (46) |
| Connecticut: | 4.4% (16,395) |
| New Hartford: | 7.2% (19) |
| Connecticut: | 0.3% (1,285) |
| New Hartford: | 6.8% (18) |
| Connecticut: | 4.1% (15,108) |
| New Hartford: | 5.3% (14) |
| Connecticut: | 0.7% (2,646) |
| New Hartford: | 5.3% (14) |
| Connecticut: | 6.9% (25,507) |
| New Hartford: | 4.5% (12) |
| Connecticut: | 3.1% (11,432) |
| New Hartford: | 4.5% (12) |
| Connecticut: | 1.7% (6,247) |
| New Hartford: | 4.2% (11) |
| Connecticut: | 2.1% (7,596) |
| New Hartford: | 4.2% (11) |
| Connecticut: | 0.3% (1,032) |
| New Hartford: | 3.8% (10) |
| Connecticut: | 1.4% (5,021) |
| New Hartford: | 3.4% (9) |
| Connecticut: | 1.5% (5,508) |
| New Hartford: | 3.4% (9) |
| Connecticut: | 3.2% (12,009) |
| New Hartford: | 2.7% (7) |
| Connecticut: | 1.8% (6,680) |
| New Hartford: | 2.3% (6) |
| Connecticut: | 0.7% (2,742) |
Place of birth for U.S.-born residents:
- This state: 4,266
- Other state: 1,551
- Northeast: 1,066
- Midwest: 181
- South: 202
- West: 102
70% of New Hartford residents lived in the same house 5 years ago.
Out of people who lived in different houses, 47% lived in this county.
Out of people who lived in different counties, 70% lived in Connecticut.
Education attainment for males 25 years and older:
- No schooling: 0
- Nursery to 4th grade: 11
- 5th and 6th grade: 11
- 7th and 8th grade: 38
- 9th grade: 12
- 10th grade: 74
- 11th grade: 80
- 12th grade, no diploma: 71
- High school graduate (or equivalency): 386
- Less than 1 year of college: 122
- Some college more than 1 year, no degree: 274
- Associate degree: 115
- Bachelor's degree: 456
- Master's degree: 267
- Professional school degree: 113
- Doctorate degree: 21

Education attainment for females 25 years and older:
- No schooling: 0
- Nursery to 4th grade: 0
- 5th and 6th grade: 0
- 7th and 8th grade: 60
- 9th grade: 37
- 10th grade: 30
- 11th grade: 22
- 12th grade, no diploma: 55
- High school graduate (or equivalency): 467
- Less than 1 year of college: 132
- Some college more than 1 year, no degree: 233
- Associate degree: 175
- Bachelor's degree: 560
- Master's degree: 313
- Professional school degree: 60
- Doctorate degree: 12


Housing units in structures:
- One, detached: 2,001
- One, attached: 74
- Two: 63
- 3 or 4: 86
- 5 to 9: 26
- 10 to 19: 81
- 20 to 49: 9
- 50 or more: 8
- Boats, RVs, vans, etc.: 20
Housing units lacking complete kitchen facilities: 1.3%

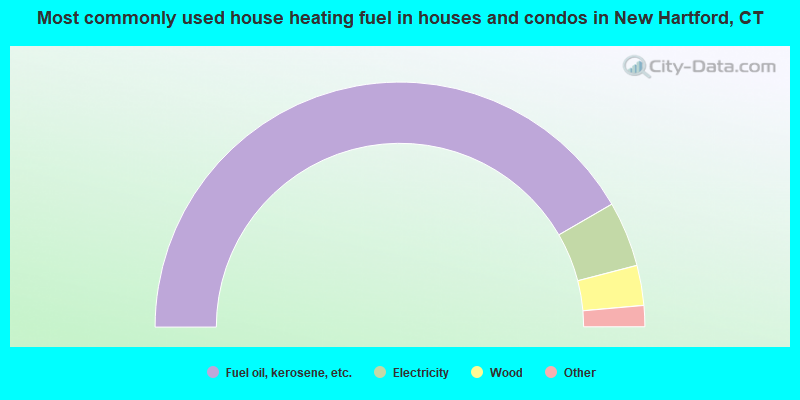
- 83.3%Fuel oil, kerosene, etc.
- 8.6%Electricity
- 5.3%Wood
- 1.5%Bottled, tank, or LP gas
- 0.9%Utility gas
- 0.4%Other fuel
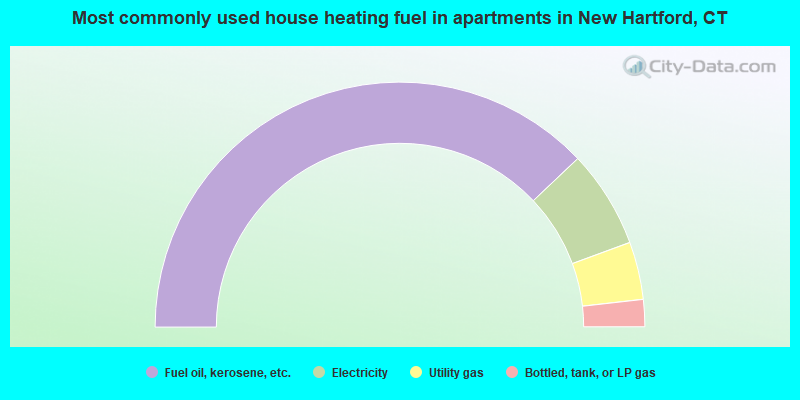
- 75.8%Fuel oil, kerosene, etc.
- 12.9%Electricity
- 7.6%Utility gas
- 3.6%Bottled, tank, or LP gas
Private vs. public school enrollment:
| Here: | 6.4% |
| Connecticut: | 9.9% |
| Here: | 9.9% |
| Connecticut: | 11.0% |
| Here: | 28.2% |
| Connecticut: | 33.4% |


